INTRODUCTION
MATERIALS AND METHODS
Study Design
Inclusion and Exclusion Criteria
Use of Corticosteroids
Definition of Terms
Clinical Management
Data Assessment
Statistical Analyses
RESULTS
Baseline and Steroid-Related Characteristics between the Control and Pulse Steroid Groups
Table 1.
| Variable | Control steroid (n=14) | Pulse steroid (n=30) | Total (n=44) | P-value |
|---|---|---|---|---|
| Age (yr) | 72 (64–76) | 70 (65–76) | 71 (64–81) | 0.860 |
| Male:female | 12:2 | 12:18 | 24:20 | 0.005d) |
| CURB-65 scorea) | 1 (1–2) | 2 (1–3) | 1 (1–2) | 0.305 |
| APACHE II score | 10 (9–14) | 12 (9–15) | 11 (9–15) | 0.383 |
| Day from symptom onset to hospitalization | 4 (1–8) | 6 (3–7) | 6 (3–8) | 0.541 |
| Day from dyspnea onset to hospitalization | 1 (1–2) | 1 (1–3) | 1 (1–3) | 0.313 |
| Day from diagnosis to steroid administration | 1 (0–4) | 1 (0–3) | 1 (0–4) | 0.843 |
| Day from hospitalization to steroid administration | 1 (0–4) | 1 (0–3) | 1 (0–4) | 0.843 |
| Type of corticosteroids | <0.001d) | |||
| Methylprednisolone | 5 (35.7) | 29 (96.7) | 34 (77.3) | |
| Dexamethasone | 8 (57.1) | 1 (3.3) | 9 (20.5) | |
| Hydrocortisone | 1 (7.1) | 0 | 1 (2.3) | |
| Starting doseb) (mg) | 32 (32–62) | 250 (250–272) | 250 (91–267) | <0.001e) |
| Accumulation doseb) (mg) | 465 (352–620) | 1,462 (1,313–1,745) | 1,313 (680–1,635) | <0.001e) |
| Duration of steroid administration (day) | 10 (10–10) | 9 (7–11) | 10 (8–11) | 0.076 |
| Underlying disease | ||||
| Hypertension | 7 (50.0) | 19 (63.3) | 26 (59.1) | 0.402 |
| Diabetes mellitus | 3 (21.4) | 8 (26.7) | 11 (25.0) | 0.709 |
| Cerebrovascular disease | 4 (28.6) | 5 (16.7) | 9 (20.5) | 0.362 |
| Chronic lung disease | 2 (14.3) | 5 (16.7) | 7 (15.9) | 0.841 |
| Cardiovascular disease | 1 (7.1) | 3 (10.0) | 4 (9.1) | 0.759 |
| Chronic liver disease | 2 (14.3) | 1 (3.3) | 3 (6.8) | 0.179 |
| Malignancy | 2 (14.3) | 0 | 2 (4.5) | 0.034d) |
| Immune suppressionc) | 1 (7.1) | 1 (3.3) | 2 (4.5) | 0.572 |
| Dementia | 0 | 1 (3.3) | 1 (2.3) | 0.490 |
| Connective tissue disease | 0 | 1 (3.3) | 1 (2.3) | 0.490 |
| Chronic kidney disease | 0 | 1 (3.3) | 1 (2.3) | 0.490 |
| Confusion at hospitalization | 4 (28.6) | 9 (30.0) | 13 (29.5) | 0.923 |
| Chest X-ray | ||||
| Pre-steroid RALE score | 14 (11–19) | 16 (13–20) | 15 (12–20) | 0.117 |
| Post-steroid RALE score | 10 (5–12) | 8 (7–11) | 9 (7–12) | 0.919 |
Values are presented as median (interquartile range) or number (%).
COVID-19: coronavirus disease 2019; APACHE: Acute Physiology and Chronic Health Evaluation; RALE: Radiographic Assessment of Lung Edema.
a) The scores was measured using factors below; confusion of new onset, blood urea nitrogen level greater than 19 mg/dl, respiratory rate of 30/min or greater, systolic blood pressure less than 90 mm Hg or diastolic blood pressure 60 mm Hg or less, age 65 or older;
ARDS Severity and Laboratory Findings between the Control and Pulse Steroid Groups
Table 2.
| Variable | Control steroid (n=14) | Pulse steroid (n=30) | Total (n=44) | P-value |
|---|---|---|---|---|
| Pre-steroid ARDS severitya) | 0.666 | |||
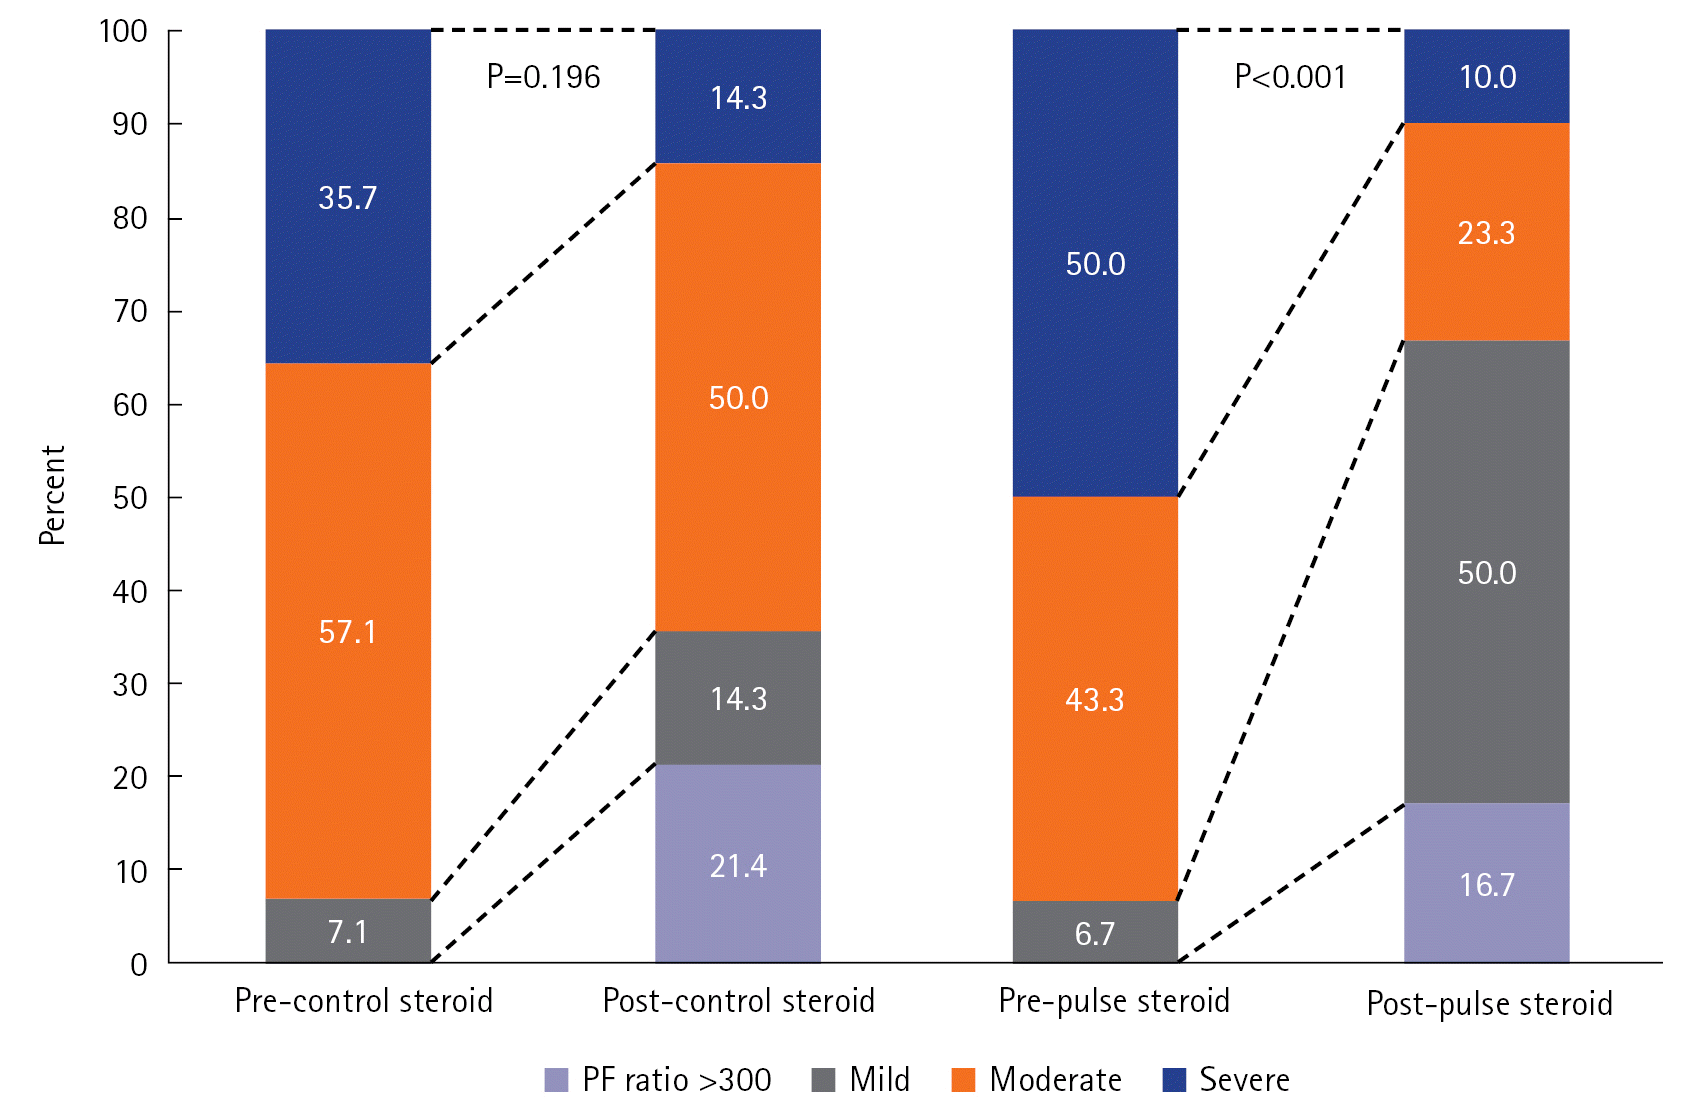
| Severe | 5 (35.7) | 15 (50.0) | 20 (45.5) | |
| Moderate | 8 (57.1) | 13 (43.3) | 21 (47.7) | |
| Mild | 1 (7.1) | 2 (6.7) | 3 (6.8) | |
| Post-steroid ARDS severitya) | 0.135 | |||
| Severe | 2 (14.3) | 3 (10.0) | 5 (11.4) | |
| Moderate | 7 (50.0) | 7 (23.3) | 14 (31.8) | |
| Mild | 2 (14.3) | 15 (50.0) | 17 (38.6) | |
| PF ratio >300 | 3 (21.4) | 5 (16.7) | 8 (18.2) | |
| Pre-steroid PF ratio | 130 (87–150) | 103 (71–130) | 112 (74–140) | 0.166 |
| Post-steroid PF ratio | 184 (144–277) | 219 (181–253) | 214 (156–257) | 0.496 |
| Pre-steroid lab | ||||
| Leukocyte (×103/ul) | 9.0 (8.1–11.4) | 9.3 (5.8–12.3) | 9.2 (5.9–12.3) | 0.920 |
| Neutrophil (%) | 85 (78–92) | 86 (77–93) | 85 (77–93) | 0.830 |
| Lymphocyte (%) | 7 (4–11) | 8 (3–14) | 8 (4–14) | 0.632 |
| Hematocrit (%) | 38 (35–44) | 38 (35–39) | 38 (35–39) | 0.427 |
| Platelet (×103/ul) | 158 (118–224) | 192 (154–219) | 175 (140–223) | 0.231 |
| CRP (mg/l) | 105 (44–139) | 95 (49–155) | 95 (45–145) | 0.980 |
| Procalcitonin (ng/ml) | 0.34 (0.10–0.46) | 0.14 (0.08–0.50) | 0.17 (0.08–0.49) | 0.313 |
| Lactate (mmol/L) | 1.9 (1.5–2.2) | 1.7 (1.3–2.2) | 1.8 (1.3–2.2) | 0.631 |
| BUN (mg/dl) | 17 (13–23) | 19 (15–25) | 19 (14–25) | 0.715 |
| Total bilirubin (mg/dl) | 0.6 (0.4–0.8) | 0.5 (0.3–0.8) | 0.5 (0.3–0.8) | 0.315 |
| Potassium (mmol/L) | 4.1 (3.6–4.8) | 4.1 (3.8–4.3) | 4.1 (3.7–4.4) | 0.920 |
| Glucose (mg/dl) | 137 (114–210) | 153 (131–184) | 153 (124–201) | 0.900 |
| Post-steroid lab | ||||
| Leukocyte (103/ul) | 8.8 (5.6–15.5) | 8.1 (6.9–10.2) | 8.7 (6.4–12.0) | 0.579 |
| Neutrophil (%) | 82 (74–89) | 87 (82–90) | 86 (79–90) | 0.252 |
| Lymphocyte (%) | 10 (3–15) | 7 (4–12) | 7 (4–13) | 0.435 |
| Hematocrit (%) | 39 (30–42) | 36 (34–39) | 36 (34–39) | 0.650 |
| Platelet (×103/ul) | 207 (117–263) | 233 (166–304) | 217 (159–282) | 0.445 |
| CRP (mg/l) | 4 (1–28) | 16 (6–36) | 12 (4–33) | 0.021b) |
| Procalcitonin (ng/ml) | 0.06 (0.02–0.16) | 0.05 (0.03–0.16) | 0.05 (0.02–0.16) | 0.607 |
| Lactate (mmol/L) | 1.6 (1.2–2.4) | 2.2 (1.8–2.6) | 2.1 (1.5–2.5) | 0.056 |
| BUN (mg/dl) | 28 (21–29) | 34 (21–35) | 26 (21–35) | 0.910 |
| Total bilirubin (mg/dl) | 0.8 (0.7–1.0) | 0.6 (0.4–0.7) | 0.7 (0.5–0.9) | 0.003b) |
| Potassium (mmol/L) | 4.1 (3.5–4.7) | 3.7 (3.3–3.9) | 3.7 (3.4–4.2) | 0.022b) |
| Glucose (mg/dl) | 136 (106–216) | 247 (197–302) | 220 (139–299) | 0.003b) |
Values are presented as number (%) or median (interquartile range).
COVID-19: coronavirus disease 2019; ARDS: acute respiratory distress syndrome; PF ratio: partial pressure of oxygen in arterial blood/fraction of inspired oxygen; CRP: C-reactive protein; BUN: blood urea nitrogen.
a) ARDS severity was adopted from Berlin definition [15]: severe, defined as PF ratio ≤100; moderate, defined as 100< PF ratio ≤200; and mild, defined as 200< PF ratio ≤300;
Changes in ARDS Severity According to the Control and Pulse Steroid Groups
 | Figure 2.Changes in the acute respiratory distress syndrome (ARDS) severity of the control and pulse steroid groups, which include patients with critical or severe coronavirus disease 2019 (COVID-19) cases. ARDS severity was adopted from the Berlin definition [16]: severe, PF ratio ≤100; moderate, 100< PF ratio ≤200; mild, 200< PF ratio ≤300. PF ratio, partial pressure of oxygen in arterial blood/fraction of inspired oxygen ratio. |
Treatment and Prognosis between the Control and Pulse Steroid Groups
Table 3.
| Variable | Control steroid (n=14) | Pulse steroid (n=30) | Total (n=44) | P-value |
|---|---|---|---|---|
| High flow nasal cannula oxygen | 14 (100) | 29 (96.7) | 43 (97.7) | 0.490 |
| Mechanical ventilation | 4 (28.6) | 6 (20.0) | 10 (22.7) | 0.527 |
| Duration of mechanical ventilation (day) | 18 (11–33) | 8 (4–10) | 10 (6–8) | 0.063 |
| Other treatmenta) | 1 (7.1) | 3 (10.0) | 4 (9.1) | 0.759 |
| Prone positionb) | 7 (50.0) | 21 (70.0) | 28 (63.6) | 0.199 |
| In-hospital mortality | 6 (42.9) | 7 (23.3) | 31 (70.5) | 0.186 |
| In-hospital mortality among moderate and mild ARDS groups | 4 (44.4) | 2 (13.3) | 6 (25.0) | 0.088 |
| In-hospital mortality among severe ARDS group | 2 (40.0) | 5 (33.3) | 7 (35.0) | 0.933 |
| 28-Day mortality | 5 (35.7) | 7 (23.3) | 32 (72.7) | 0.390 |
| Cause of death | 0.255 | |||
| Respiratory failure | 4 (28.6) | 5 (16.7) | 9 (20.5) | |
| Hepatic failure | 2 (14.3) | 0 | 2 (4.5) | |
| Arrhythmia | 0 | 1 (3.3) | 1 (2.3) | |
| Renal failure | 0 | 1 (3.3) | 1 (2.3) | |
| Length of hospital stay (day) | 14 (12–24) | 11 (9–16) | 11 (8–17) | 0.039d) |
| Complication after steroid use | 1 (7.1) | 3 (9.9) | 4 (9.0) | 0.295 |
| Uncontrolled hyperglycemia | 0 | 2 (6.7) | 2 (4.8) | |
| Othersc) | 1 (7.1) | 1 (3.3) | 2 (4.8) |


 PDF
PDF Citation
 Print
Print


 XML Download