Introduction
Materials and Methods
Ethics statement
Experimental animals
LPS-induced sepsis model
RIPoC
Harvesting
Experimental protocols and experimental groups
Protocol 1. LPS-induced hepatic injury
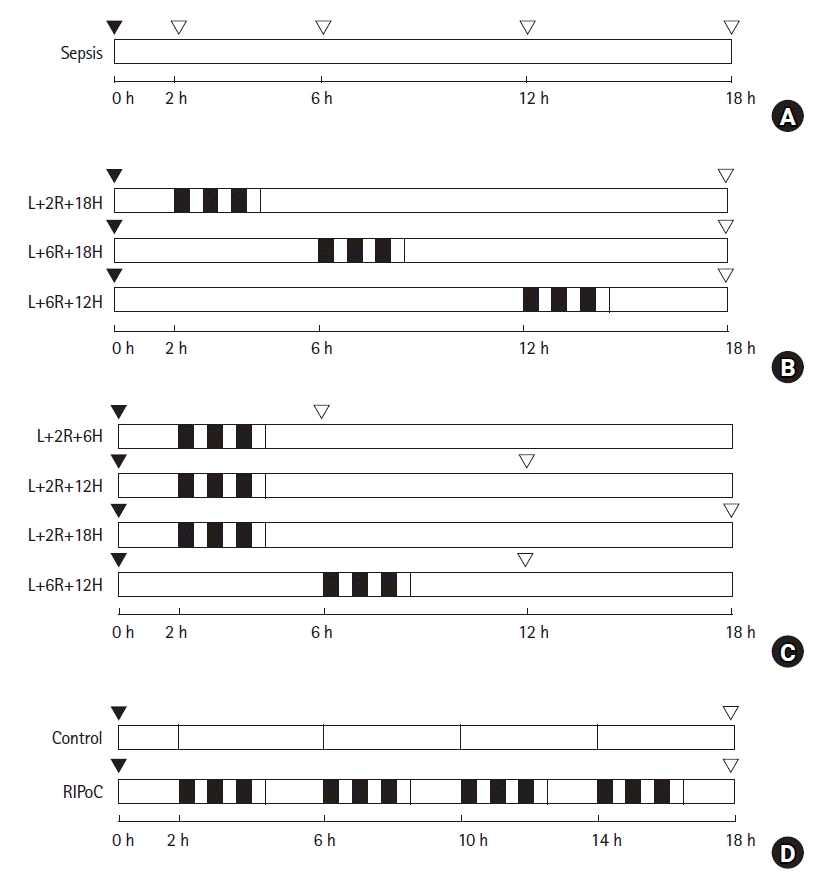 | Fig. 1.Schematic overview of the study design and experimental groups. (A) To investigate the effects of LPS-induced sepsis on the liver, rats (n = 15) were intraperitoneally administered 1.5 mg/kg LPS. Blood and liver tissue samples were collected after 0, 2, 6, 12, and 18 h. (B) To investigate the effect of RIPoC on LPS-induced hepatic injury, rats (n = 18) were randomly assigned to three groups. (C) To examine duration of RIPoC effects, rats (n = 24) were randomly assigned to four sampling groups (n = 6). (D) To examine repeated RIPoC effects, rats (n = 12) were divided into control and RIPoC groups. Both groups were injected intraperitoneally with ketamine (60 mg/kg) and xylazine (10 mg/kg) to induce anesthesia.  RIPoC: Three cycles (Rt. hind limb ischemia for 5 min + reperfusion for 5 min), ▼ LPS intraperitoneally injected, ▽ sample, L+2R+18H: RIPoC performed at 2 h and sampling at 18 h after LPS injection, L+6R+18H: RIPoC performed at 6 h and sampling at 18 h after LPS injection, L+12R+18H: RIPoC performed at 12 h and blood and liver tissue sampling at 18 h after LPS injection, L+2R+6H: RIPoC performed at 2 h and blood and liver tissue sampling at 6 h after LPS injection, L+2R+12H: RIPoC performed at 2 h and blood and liver tissue sampling at 12 h after LPS injection, L+6R+12H: RIPoC performed at 6 h and blood and liver tissue sampling at 12 h after LPS injection. LPS: lipopolysaccharide, RIPoC: remote ischemic postconditioning. RIPoC: Three cycles (Rt. hind limb ischemia for 5 min + reperfusion for 5 min), ▼ LPS intraperitoneally injected, ▽ sample, L+2R+18H: RIPoC performed at 2 h and sampling at 18 h after LPS injection, L+6R+18H: RIPoC performed at 6 h and sampling at 18 h after LPS injection, L+12R+18H: RIPoC performed at 12 h and blood and liver tissue sampling at 18 h after LPS injection, L+2R+6H: RIPoC performed at 2 h and blood and liver tissue sampling at 6 h after LPS injection, L+2R+12H: RIPoC performed at 2 h and blood and liver tissue sampling at 12 h after LPS injection, L+6R+12H: RIPoC performed at 6 h and blood and liver tissue sampling at 12 h after LPS injection. LPS: lipopolysaccharide, RIPoC: remote ischemic postconditioning. |
Protocol 2. The effects of RIPoC on LPS-induced hepatic injury
Protocol 3. Assessing RIPoC duration
Protocol 4. The effects of repeated RIPoC
Serum liver enzyme measurements
Hepatic tissue malondialdehyde (MDA) levels and superoxide dismutase (SOD) activity
Western blotting
Histopathological analyses
Statistical analyses
Results
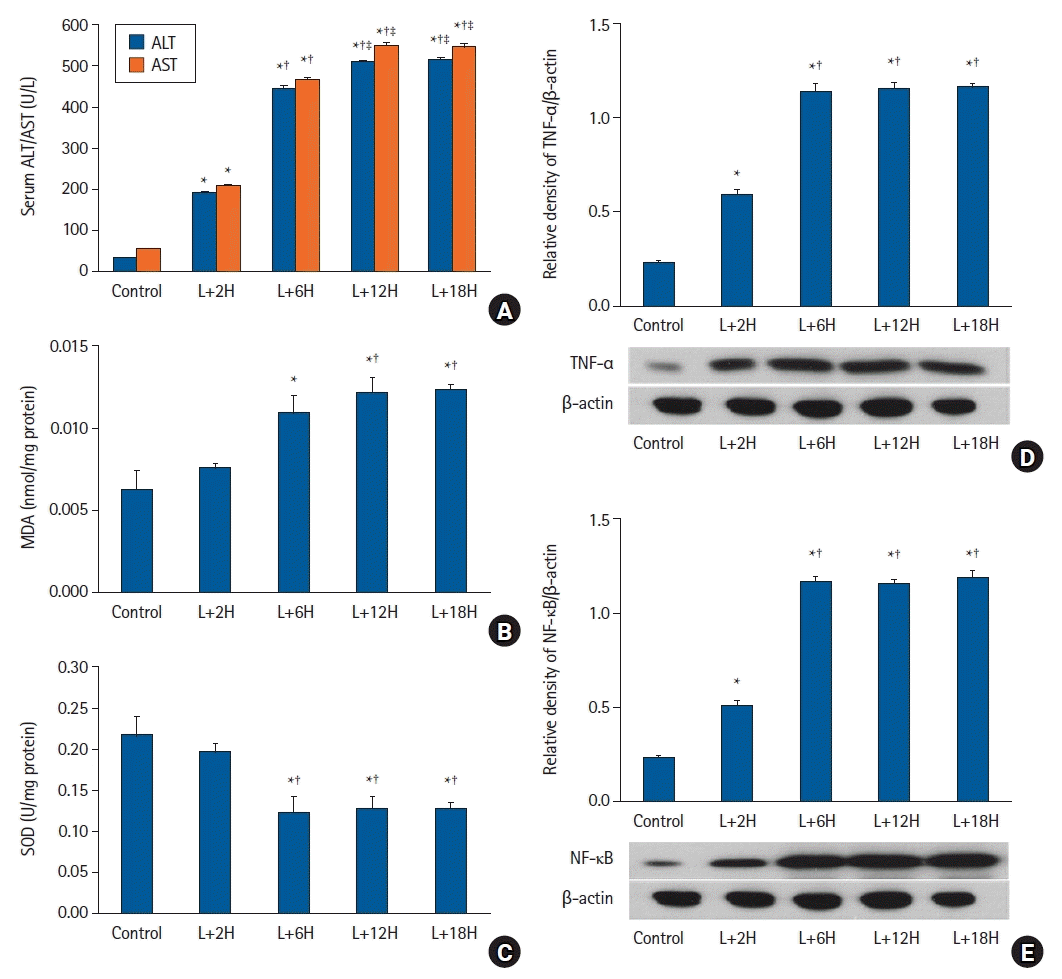 | Fig. 2.The LPS-induced sepsis model. (A) Serum ALT and AST levels increased over time (P < 0.001) but plateaued after approximately 12 h. (B) Hepatic tissue MDA levels did not significantly change until 2 h and increased up to 12 h. (C) Hepatic tissue SOD activity did not significantly change until 2 h and decreased up to 12 h. (D) TNF-α and (E) NF-κB expression levels showed similar patterns to MDA. *P < 0.05 versus the sham group, †P < 0.05 versus the L+2H group, ‡P < 0.05 versus the L+6H group. Data are expressed as the mean ± standard error of the mean (n = 3 rats/group). LPS: lipopolysaccharide, ALT: alanine transaminase, AST: aspartate transaminase, MDA: malondialdehyde, SOD: superoxide dismutase, TNF-α: tumor necrosis factor-α, NF-κB: nuclear factor-κB. |
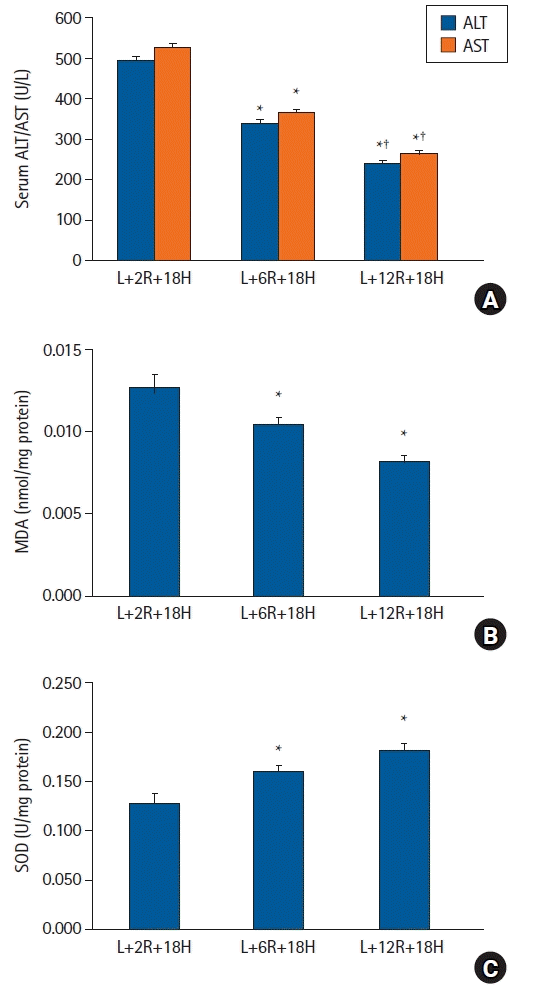 | Fig. 3.The effects of RIPoC on LPS-induced hepatic injury. (A) Serum ALT and AST levels in L+6R+18H and L+12R+18H groups were lower when compared with the L+2R+18H group, while levels in the L+12H+18H group were also lower when compared with the L+6R+18H group. (B) Hepatic tissue MDA levels in L+6R+18H and L+12R+18H groups were lower when compared with the L+2R+18H group. (C) Hepatic tissue SOD activity in L+6R+18H and L+12R+18H groups were higher when compared with the L+2R+18H group. *P < 0.05 versus the L+2R+18H group, †P < 0.05 versus the L+6R+18H group. Data are expressed as the mean ± standard error of the mean (n = 6 rats/group). RIPoC: remote ischemic postconditioning, LPS: lipopolysaccharide, ALT: alanine transaminase, AST: aspartate transaminase, MDA: malondialdehyde, SOD: superoxide dismutase. |
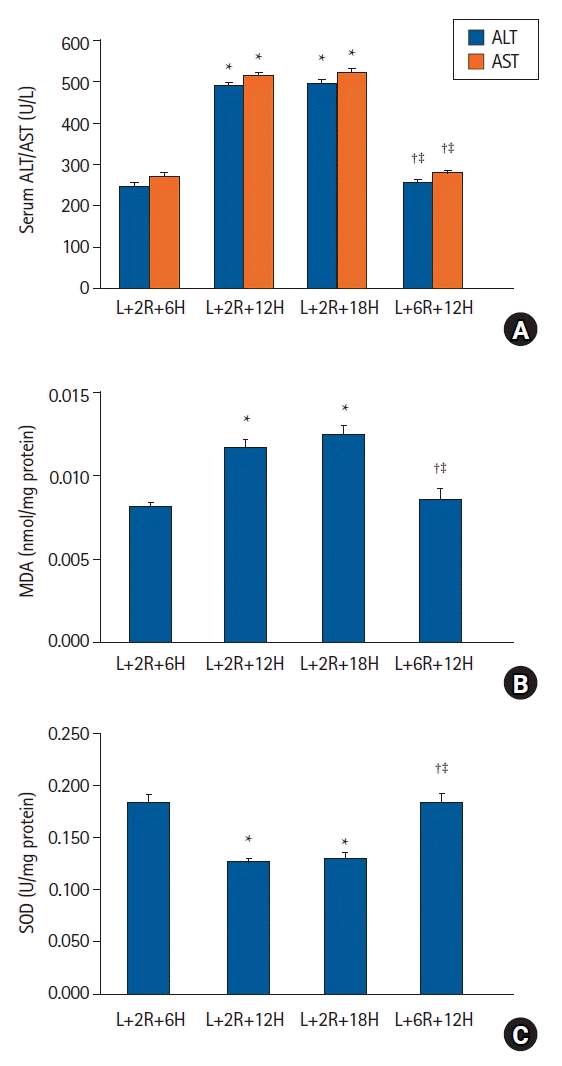 | Fig. 4.Duration of RIPoC effects. (A) Serum ALT and AST levels in the L+2R+6H group were lower when compared with L+2R+12H and L+2R+18H groups. Levels in the L+6R+12H group were lower when compared with L+2R+12H and L+2R+18H groups. (B) Hepatic tissue MDA levels also showed similar patterns to serum ALT and AST levels. (C) Hepatic tissue SOD activity in the L+2R+6H group was higher when compared with L+2R+12H and L+2R+18H groups. Levels in the L+6R+12H group were higher when compared with L+2R+12H and L+2R+18H groups. *P < 0.05 versus the L+2R+6H group, †P < 0.05 versus the L+2R+12H group, ‡P < 0.05 versus L+12R+18H group. Data are expressed as the mean ± standard error of the mean (n = 6 rats/group). RIPoC: remote ischemic postconditioning, ALT: alanine transaminase, AST: aspartate transaminase, MDA: malondialdehyde, SOD: superoxide dismutase. |
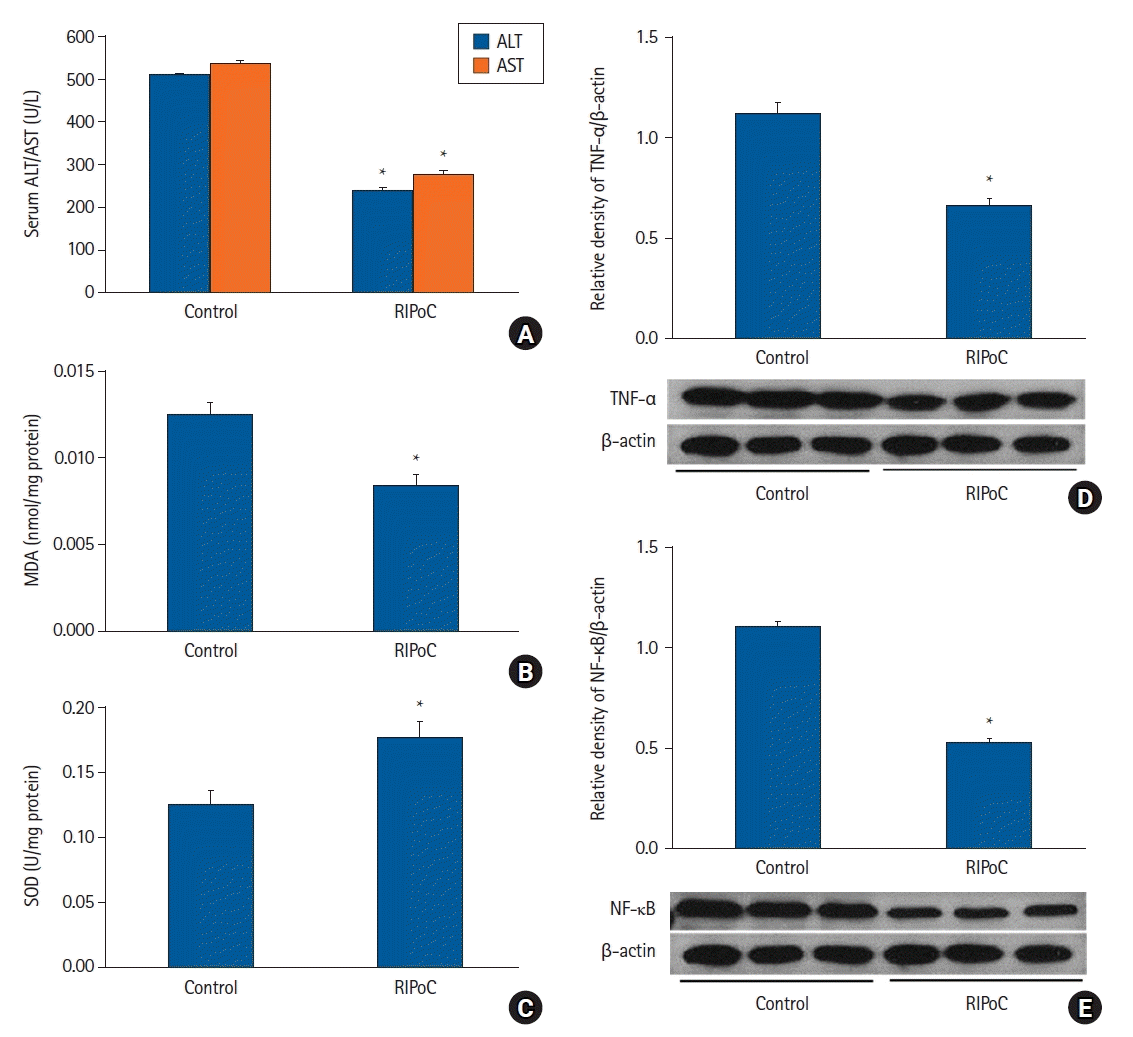 | Fig. 5.Repeated RIPoC effects. (A) Serum ALT and AST levels in the RIPoC group were significantly lower when compared with the control group. (B) Hepatic tissue MDA levels in the RIPoC group showed similar patterns to ALT and AST levels. (C) Hepatic tissue SOD activity in the RIPoC group was maintained when compared with the control group. (D) TNF-α and (E) NF-κB expression levels were also significantly lower when compared with the control group. *P < 0.05 versus the control group. Data were expressed as the mean ± standard error of the mean (n = 6 rats/group). RIPoC: remote ischemic postconditioning, ALT: alanine transaminase, AST: aspartate transaminase, MDA: malondialdehyde, SOD: superoxide dismutase, TNF-α: tumor necrosis factor-α, NF-κB: nuclear factor-κB. |
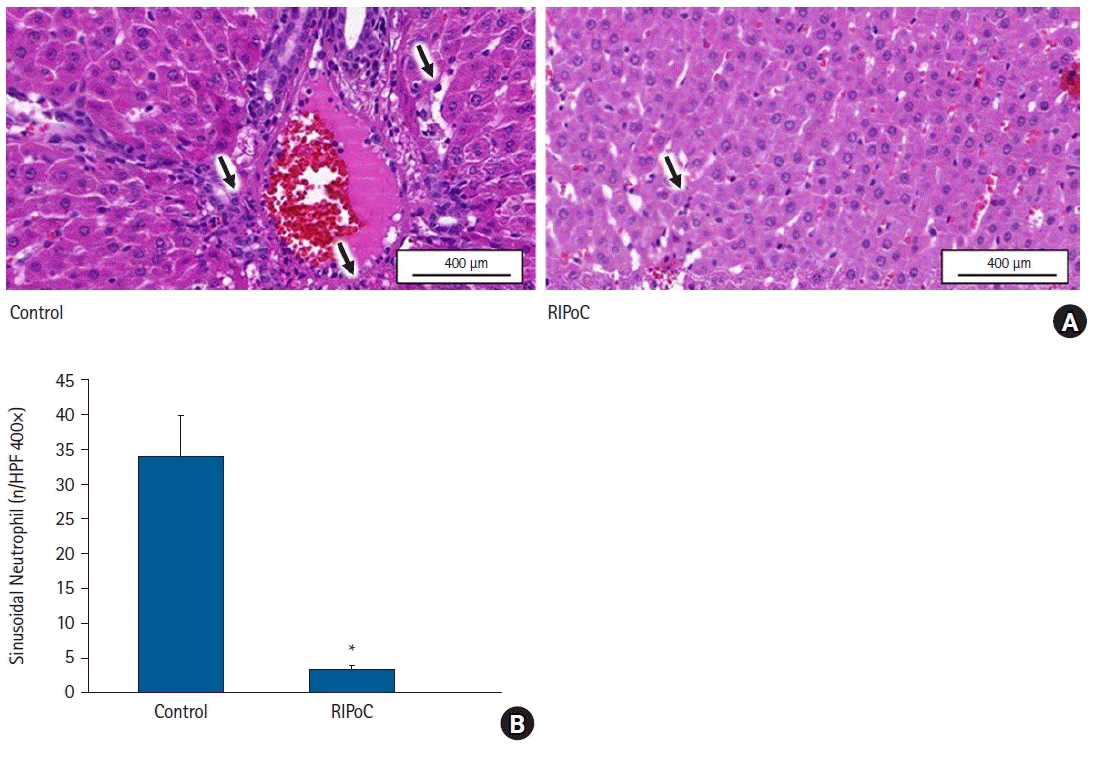 | Fig. 6.Histopathological analyses. (A) PMN infiltration in liver sinusoid and perivascular areas was significantly reduced in the RIPoC group when compared with controls (arrows) (400×). (B) Intrahepatic sinusoidal neutrophil numbers in 16 random high-power fields (400×). *P < 0.05 versus the control group. Data are expressed as the mean ± standard error of the mean (n = 6 rats/group). PMNs: polymorphonuclear neutrophils, RIPoC: remote ischemic postconditioning. |


 PDF
PDF Citation
 Print
Print


 XML Download