Journal List > Int J Stem Cells > v.16(3) > 1516083566

Liu, Chen, Li, Cao, Zhang, Zhou, Chen, Gong, Yang, Cheng, Chen, Shen, Xiao, Tan, and Deng: Dissection of Cellular Communication between Human Primary Osteoblasts and Bone Marrow Mesenchymal Stem Cells in Osteoarthritis at Single-Cell Resolution

Abstract

Background and Objectives

Osteoblasts are derived from bone marrow mesenchymal stem cells (BMMSCs) and play important role in bone remodeling. While our previous studies have investigated the cell subtypes and heterogeneity in osteoblasts and BMMSCs separately, cell-to-cell communications between osteoblasts and BMMSCs in vivo in humans have not been characterized. The aim of this study was to investigate the cellular communication between human primary osteoblasts and bone marrow mesenchymal stem cells.

Methods and Results

To investigate the cell-to-cell communications between osteoblasts and BMMSCs and identify new cell subtypes, we performed a systematic integration analysis with our single-cell RNA sequencing (scRNA-seq) transcriptomes data from BMMSCs and osteoblasts. We successfully identified a novel preosteoblasts subtype which highly expressed ATF3, CCL2, CXCL2 and IRF1. Biological functional annotations of the transcriptomes suggested that the novel preosteoblasts subtype may inhibit osteoblasts differentiation, maintain cells to a less differentiated status and recruit osteoclasts. Ligand-receptor interaction analysis showed strong interaction between mature osteoblasts and BMMSCs. Meanwhile, we found FZD1 was highly expressed in BMMSCs of osteogenic differentiation direction. WIF1 and SFRP4, which were highly expressed in mature osteoblasts were reported to inhibit osteogenic differentiation. We speculated that WIF1 and sFRP4 expressed in mature osteoblasts inhibited the binding of FZD1 to Wnt ligand in BMMSCs, thereby further inhibiting osteogenic differentiation of BMMSCs.

Conclusions

Our study provided a more systematic and comprehensive understanding of the heterogeneity of osteogenic cells. At the single cell level, this study provided insights into the cell-to-cell communications between BMMSCs and osteoblasts and mature osteoblasts may mediate negative feedback regulation of osteogenesis process.

Introduction

Bone is a metabolically active organ that undergoes continuous remodeling throughout life (1). Bone remodeling involves the bone resorption by osteoclasts followed by the formation of bone matrix through the osteoblasts. Osteoblasts are derived from bone marrow mesenchymal stem cells (BMMSCs). In addition to osteoblasts, BMMSCs can differentiate into adipocytes and chondrocytes. The adipogenic and osteoblastogenic differentiation are competitively balanced (2, 3). Osteoblastogenic development is a complex process that requires the tight regulation of specific transcription factors activation or suppression in response to local signaling pathways (4, 5). For instance, Wnt signaling is implicated in cell fate determination, proliferation, differentiation and apoptosis of osteoblasts (4). The combination of the Wnt and the seven-pass transmembrane receptor Frizzled (FZD) or single-pass transmembrane co-receptor complex LRP5/6 activates the canonical Wnt signaling pathway to promote downstream osteoblast target gene expression (5).
Cell heterogeneity is an important contributor to biological function. During the entire osteoblast development process from BMMSCs to mature osteoblasts, several cell subtypes have been identified. Two subpopulations of BMMSCs were found: a skeletal stem cell subpopulation that differentiated into bone, cartilage and fat, and another subpopulation that modulated immune function and inflammation (6). Our previous studies performed single-cell sequencing of human BMMSCs and osteoblasts. In BMMSCs population, we identified osteoblast precursors, adipocyte precursors, chondrocyte precursors and terminal-stage cells subpopulations in LEPRhighCD45low BMMSCs (7). In osteoblasts, we identified two known cell subtypes and a novel undetermined osteoblasts subtype. Meanwhile, our studies revealed the functional characteristics of each osteoblast subtype in bone metabolism, angiogenesis modulation and hematopoietic stem cells (HSC) niche regulation (8). The osteoblast development from BMMSCs to mature osteoblast was a continuous process. But in our previous studies, BMMSCs and osteoblasts were analyzed separately, which neglected the continuity of differentiation and the cell to cell communication of different cell subtypes. Therefore, due to the lack of comprehensive combined analysis of BMMSCs and osteoblasts, the regulation mechanisms involved in osteoblast development process and cell to cell communication between BMMSCs and osteoblasts at single cell level remained limited.
In this study, we conducted an integrated analysis of BMMSCs and osteoblasts at the single-cell level, reconstructed pseudotime trajectories and analyzed cell to cell communication between BMMSCs and osteoblasts. We suggested that SFRP4 and WIF1 which highly expressed in mature osteoblasts, inhibited the binding of FZD1 to Wnt ligand in BMMSCs, thereby further inhibiting the regulation of osteogenic differentiation.

Materials and Methods

Study population

The study subject of osteoblast included one 31-year-old male with osteoarthritis and osteopenia (BMD T-score: 0.6 at lumbar spine, −1.1 at the total hip). And study subjects of bone marrow mesenchymal stem cells consisted of two subjects: one 67-year-old female with osteoporosis (T-score: −3.3 at lumbar spine, −3.7 at the total hip), the other 84-year-old male with osteoarthritis (T-score: −0.9 at lumbar spine, 2.7 at the total hip).
All subjects were screened with a detailed questionnaire, medical history, physical examination, and bone mineral density (BMD) testing before surgery. Subjects were excluded from this study if they had conditions that affect bone metabolism, including diseases of the kidney, liver, parathyroid, and thyroid, or any of the following conditions: diabetes mellitus, hyperprolactinemia, oophorectomy, ankylosing spondylitis, malabsorption syndromes, malignant tumors, hematologic diseases, or previous pathologic fractures.

Isolation of osteoblasts

We isolated osteoblasts from the human femoral head according to a previously widely used protocol with only minor modifications (9). Briefly, bone tissue was divided into bone fragments with bone forceps and washed with phosphate-buffered saline (PBS). The fragments were placed into the digestive solution containing a highly purified, endotoxin-free type II collagenase (1 mg/ml, Cat: A004174-0001, Sangon Biotech, Shanghai, China) and digested for two rounds at 37℃, the first round for 30 min and the second round for 60 min. The solution was then collected and filtered through a 70 μm filter and incubated with red blood cell lysis buffer for five minutes. The collected cells were washed twice with PBS and incubated with human CD31/34/45-PE (Cat:303106, Cat:343606, Cat:304008, BioLegend, San Diego, CA, USA), and human ALPL-APC (Cat: FAB1448A, R&D Systems, Minneapolis, MN, USA) antibodies. After incubation, ALP+/CD45/34/31 cells were collected as osteoblasts by fluorescence-activated cell sorting (FACS).

Isolation of bone marrow mesenchymal stem cells (BMMSCs)

BMMSCs were isolated from human bone marrow cells extracted from the bone marrow cavity of the femoral diaphysis according to the widely used isolation protocol (10). Briefly, the bone marrow was diluted with twice the volume of PBS and mixed gently. The mixture was then evenly layered onto an equivalent volume of Ficoll (GE Healthcare, Chicago, Illinois, USA) and the buffy coat was separated by centrifugation (440 g, 35 min, 4℃). The separated buffy coat was transferred to a new 15 ml centrifuge tube and washed with PBS. Then, red blood cells were lysed with RBC Lysis Buffer (Thermo Fisher, Waltham, MA, USA). After washing twice with PBS, the remaining cells were further purified with CD271 magnetic MicroBeads for positive selection (11). BMMSCs were incubated for 10 min at 4℃∼8℃ with monoclonal antibody (mAb) against CD271. After washing, the cells were incubated with anti-IgG1 immunomagnetic beads for 15 min at 4℃. The cell suspension was placed on a column in a cell separator (Miltenyi Biotec), and the positive fraction was subjected to a second separation step. The cells were then counted and assessed for viability with a Countstar Rigel S3 fluorescence cell analyzer (ALIT Life Science Co., Ltd, Shanghai, China).

Single cell RNA-seq library preparation

The RNA library was constructed using Single Cell 3'Library Gel Bead Kit V3 on the 10x platform. The sequencing principle was based on the droplet method. The single cell suspension was added to the 10x Genomics Chromium Controller for single cell capture and sequencing tag addition. After PCR amplification of the library, the two types of single-cell RNA-seq libraries were sequenced separately on the Illumina Novaseq6000 platform.

Preprocessing of the scRNA-seq data

For separate preprocessing of BMMSCs and osteoblast data sets, Seurat (12) package V3 (https://satijalab.org/seurat/) was used for filtering, variable gene selection, dimensionality reduction analysis, and clustering. From the dataset of osteoblast, we obtained 7,506 ALPL/RUNX2/COL1A1high/CD45low cells. All osteoblasts were clustered by dimensionality reduction, and 9 clusters (O1-O9) were obtained. Among them, clusters O5 and O6 were nucleated erythrocyte groups that highly expressed hemoglobin coding genes (HBA1 and HBB); clusters O8 was smooth muscle cell group that expressed smooth muscle alpha (alpha)-2 actin coding gene (ACTA2) and smooth muscle myosin heavy chain (MYH11) (13); cluster O9 was neutrophil group that expressed the neutrophil related genes S100A8 and hematopoietic marker gene PTPRC (also known as CD45) (Supplementary Fig. S1C and S1D).
After the first pre-screening, we got 3,756 BMMSCs. For details, please refer to our previous research (7) and GSE147287. Among them, cluster B5 highly expressed hematopoietic marker gene PTPRC (CD45) and neutrophil marker gene S100A8 (Supplementary Fig. S2B), so the cluster B5 was eliminated in the subsequent analysis. The B6 cluster was separated from BMMSCs in the dimensionality reduction figure (Supplementary Fig. S2A). Based on the highly expressed IBSP and ENPP1 marker genes of cluster B6 (Supplementary Fig. S2B), cluster B6 might be in the late stage of osteoblast development, so we kept cluster B6 for subsequent analysis.

Integrated analysis

To analyze the datasets from different cell types, we also used Seurat V3 for integrated analysis. To unify quality control criteria, we removed cells with a high fraction of mitochondrial transcripts (20% for BMMSCs and osteoblasts, respectively), a low unique molecular identifier counts >40,000, and a low number of detected genes (<200&>5,000) for analysis. Finally, we retained 8,841 cells (including 2,865 BMMSCs and 5,976 osteoblasts) for further analyses. First, the first 2,000 genes with the most obvious cell-to-cell differences were selected by the “FindVariableFeatures” function in the Seurat package. Subsequently, principal component analysis (PCA) analysis was performed on the submatrix consisting of the highly variable genes. The top 20 principal components were used for clustering analysis and visualization.

Cell cycle scores

To assess cell cycle effects on the dataset, we used the “CellCycleScoring” function in the Seurat package to score each cell. Each cell was divided into G1, G2M, and S phases based on Seurat’s built-in cell cycle marker gene dataset (https://satijalab.org/seurat/v3.2/cell_cycle_vignette.html).

Diffusion pseudotime analysis

To delineate the developmental progression of bone marrow mesenchymal cells to mature osteoblasts in pseudotime, we performed the diffusion map analysis (14) as implemen-ted in the R package destiny (bioconductor.org/packages/destiny). The method inferred the low-dimensional manifolds by estimating the eigenvalues and eigenvectors for the diffusion operator related to the data. We used the variable genes identified by Seurat as the basis to construct a single cell differentiation trajectory. Then, the diffusion map was constructed using the “DiffusionMap” function of R package destiny.

Pathway enrichment analysis

Gene Ontology (GO) term enrichment analysis was performed using the standalone clusterProfiler package (https://github.com/YuLab-SMU/clusterProfiler). When the adjusted p-value was less than 0.05, the term we obtained was considered to be significantly enriched.

Cell to cell ligand-receptor interaction analysis

To infer the hypothetical intercellular communication, we used iTALK (15) R packages (https://github.com/Coolgenome/iTALK) to visualize the ligand-receptor networks. We used the built-in database of ligand-receptor interaction for iTALK, which collected a total of 2,648 nonredundant and known interacting ligand-receptor pairs. The ligand receptor pairs were classified into 4 categories based on the primary function: cytokines/chemokines, immune checkpoint genes, growth factors, and others. iTALK incorporates commonly used algorithms for batch effects corrections and differential gene expression analysis.

Protein-protein interaction network analysis

We constructed the Protein-Protein Interaction (PPI) network based on STRING v10 (https://string-db.org/) database and Cytoscape (16) software. The first 30 genes of each subcluster were selected, and then the genes of the two subclusters were input into the STRING v10 database to obtain the basic protein-protein interaction network. We imported the network data into Cytoscape software, and used the built-in program cytoHubba (17) to identify hub genes of the PPI network.

Results

Integration of single-cell transcriptome sequencing data from osteoblasts and BMMSCs

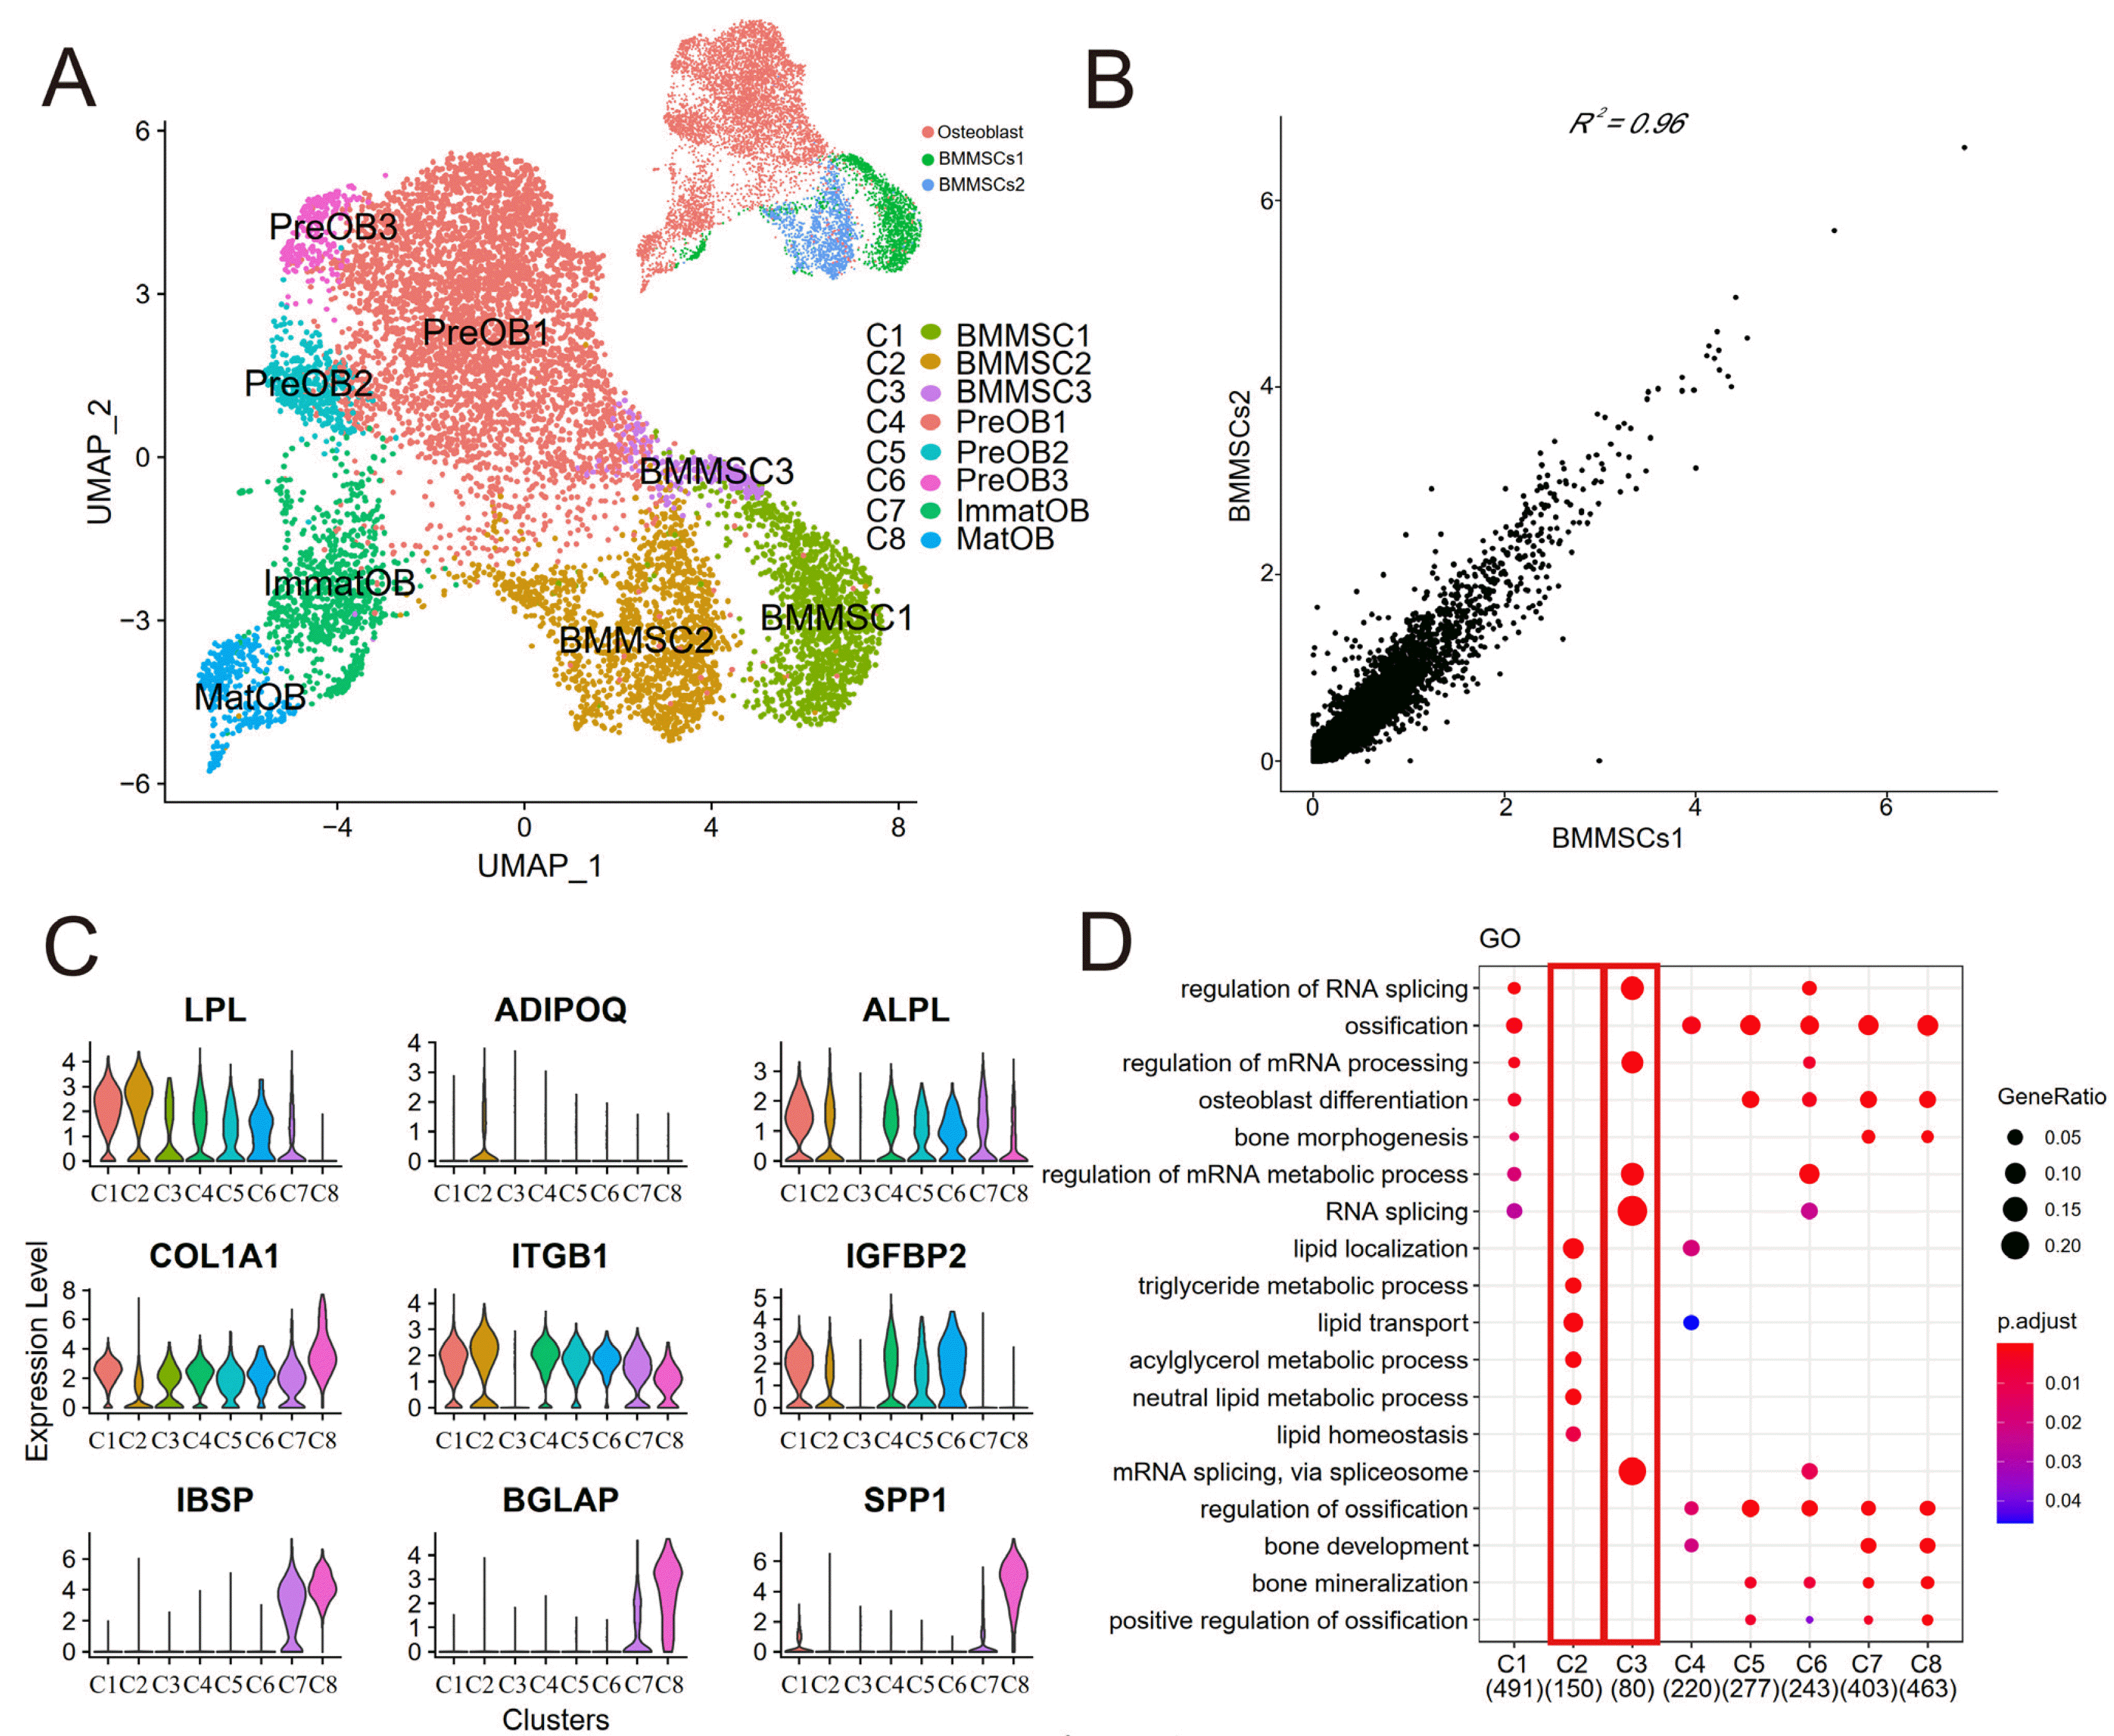
The scRNA-seq data of human osteoblasts (8) and BMMSCs (7) from two subjects used in this study were detailed in our previous publication. After quality control and excluding contaminant cell types, 8,841 cells (5,976 osteoblasts and 2,865 BMMSCs) were used in the integration analysis. We performed unsupervised detection using principal component analysis in Seurat (12) and generated a two-dimensional (2D) embedding plot for visualization using the uniform manifold approximation and projection (UMAP) algorithm (18). 8 clusters (C1-C8) were identified based on highly variable genes (Fig. 1A). C1-C3 were BMMSCs (BMMSC1, BMMSC2, BMMSC3). C4-C6 were preosteoblasts1-3 clusters (PreOB1, PreOB2, PreOB3). C7 and C8 were immature osteoblasts cluster (ImmatOB) and mature osteoblasts cluster (MatOB) respectively. The gene expression profiles between the two subjects were strongly correlated (R2=0.96, Fig. 1B), so we combined the data from the two subjects for subsequent analysis.
Next, we identified highly expressed genes in each cluster (Fig. 1C) and used Gene Ontology (GO) enrichment analysis to characterize the most significant gene expression signatures from each cell cluster (Fig. 1D). Most of clusters were enriched for GO terms related to “ossification”, “bone development”, “osteoblast differentiation”, “bone mineralization”. Most of clusters expressed osteoblasts related marker genes (eg, ALPL, COL1A1, ITGB1) and mature osteoblasts marker genes (eg, IBSP, BGLAP, SPP1) (Fig. 1C). However, we found cluster BMMSC2 was enriched for terms related to “lipid localization”, “lipid transport”, and “lipid homeostasis” (Fig. 1D). Also, we found that LPL which was a marker gene expressed earlier in adipogenesis showed increased expression in both the directions of osteogenic (cluster BMMSC1) and adipogenic (cluster BMMSC2) differentiation, but adiponectin (ADIPOQ) which was a representative adipokine only expressed in cluster BMMSC2 (Fig. 1C). Therefore, we suggested that cluster BMMSC2 was a BMMSCs subcluster with adipogenic potential and function. Similarly, the cluster BMMSC3 from BMMSCs did not enrich for “ossification”, “osteoblast differentiation” and other terms related to bone development (Fig. 1D), and did not express essential osteogenic genes, such as alkaline phosphatase (ALPL) and integrin subunit β1 (ITGB1) for osteoblast development (Fig. 1C). Hence, as reported in our previous study, cluster BMMSC3 was at the terminal stage of BMMSCs and lacked the capacity for cellular differentiation (7). Therefore, BMMSC1 was a BMMSCs subcluster with osteogenic potential and function. Cells from clusters BMMSC1, PreOB1, PreOB2, PreOB3, ImmatOB and MatOB were classified as osteogenesis cells and used in further analysis.
To assess if clustering was critically influenced by the cell cycle, we calculated the cell cycle score to determine the stages of the cells, in which cell cycle scores were based on its expression of G2/M and S phase markers (12). We found different cell cycle stages were present at a roughly similar proportion in each subpopulation (Supplementary Fig. S3B and S3C), therefore, the cluster results were not affected by cell cycle heterogeneity.

Developmental trajectory of osteogenesis cells

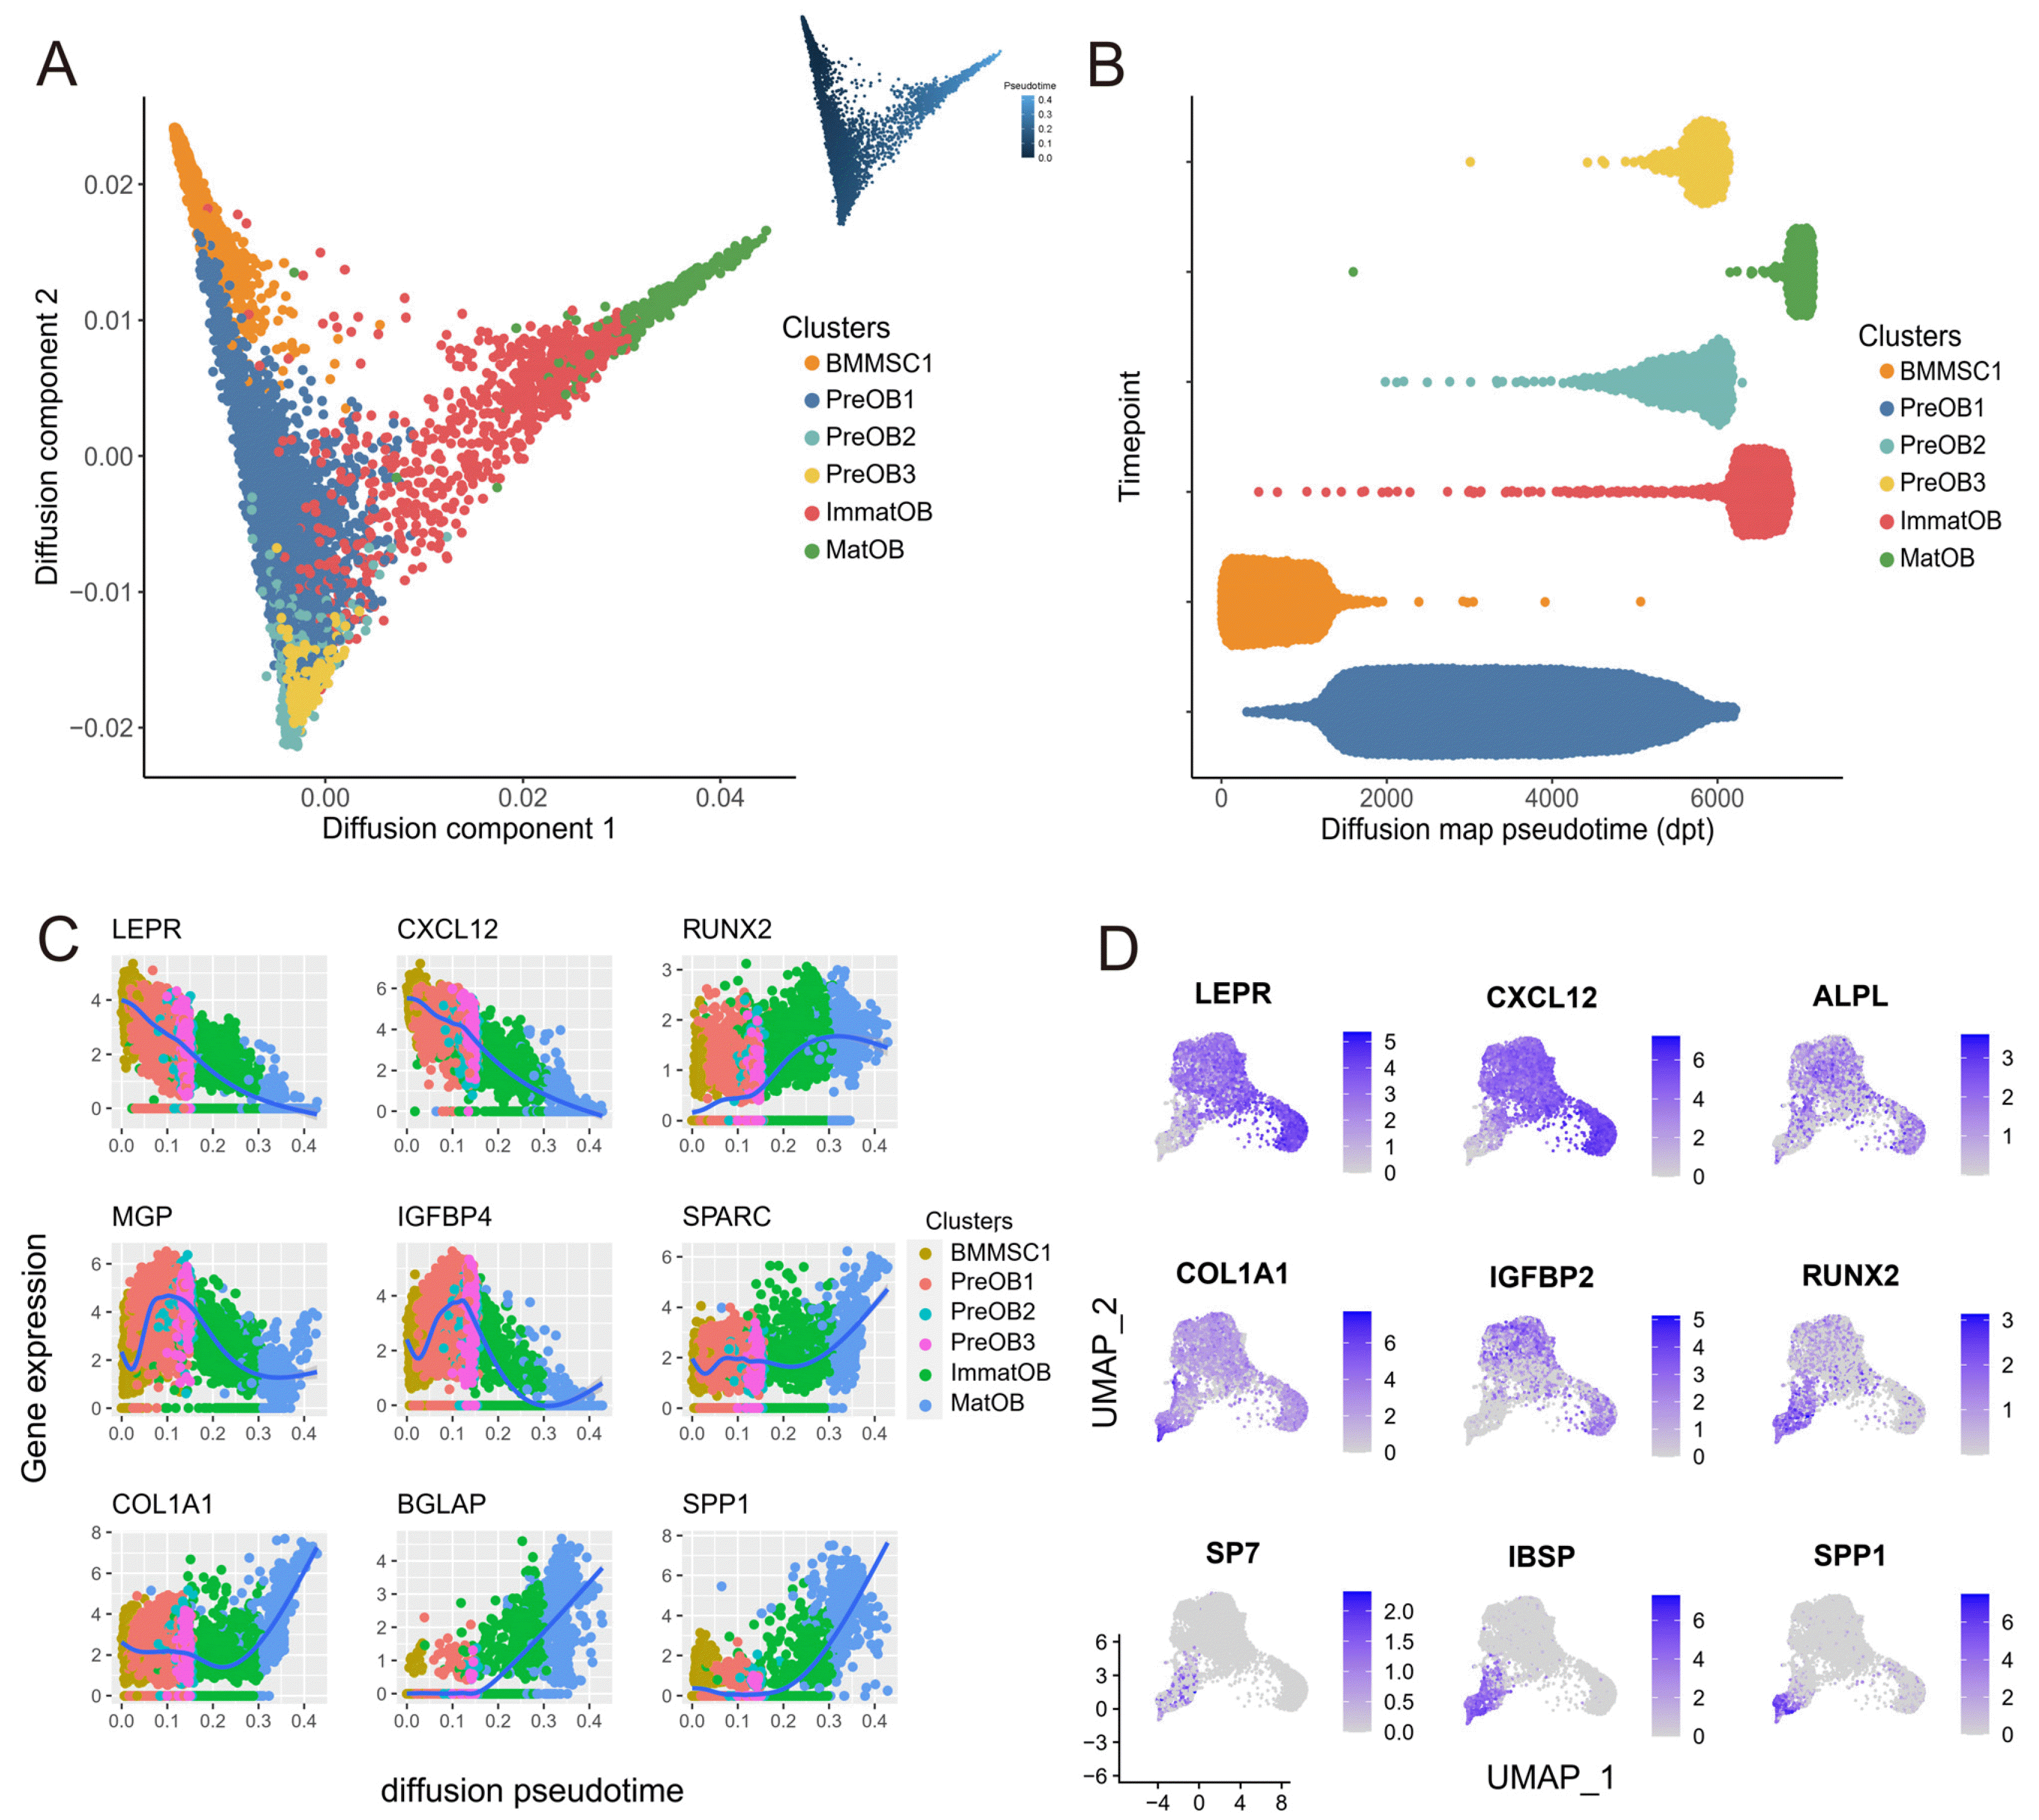
Next, we inferred osteogenesis differentiation trajectory using unsupervised ordering of the scRNA-seq for osteogenesis cells by diffusion mapping (Fig. 2A) (14). By comparing the distribution of the pseudotime, we found that cluster BMMSC1was enriched in the early stage of pseudotime (Fig. 2B). The clusters ImmatOB and MatOB, which highly expressed specific genes of late osteoblasts stage like IBSP, BGLAP and SPP1 (Fig. 1C and 2B), were mostly presented at the later stage. Therefore, clusters ImmatOB and MatOB were at the terminal stages throughout the pseudotime. Next, we checked the transcriptional continuous expression of osteoblast characteristic genes during the process of osteogenesis differentiation. The osteogenesis cells specific genes such as SPARC, COL1A1, BGLAP and SPP1 were upregulated from BMMSCs to mature osteoblasts (Fig. 2C). A subset of genes was consistently downregulated during the osteogenesis differentiation process, such as CXCL12 and LEPR (Fig. 2C). To support the trajectory inference, the expression of significant osteogenesis regulatory factors and transcription factors were mapped to osteogenic lineage. We observed that IBSP was expressed in mature osteoblasts as previously reported, and genes expressed in early osteogenic development such as LEPR and CXCL12 were not expressed in mature osteoblasts (Fig. 2D). This result was consistent with the findings of transcriptional continuum in osteoblasts differentiation (19).

Transcriptional characteristics of human osteogenesis cells

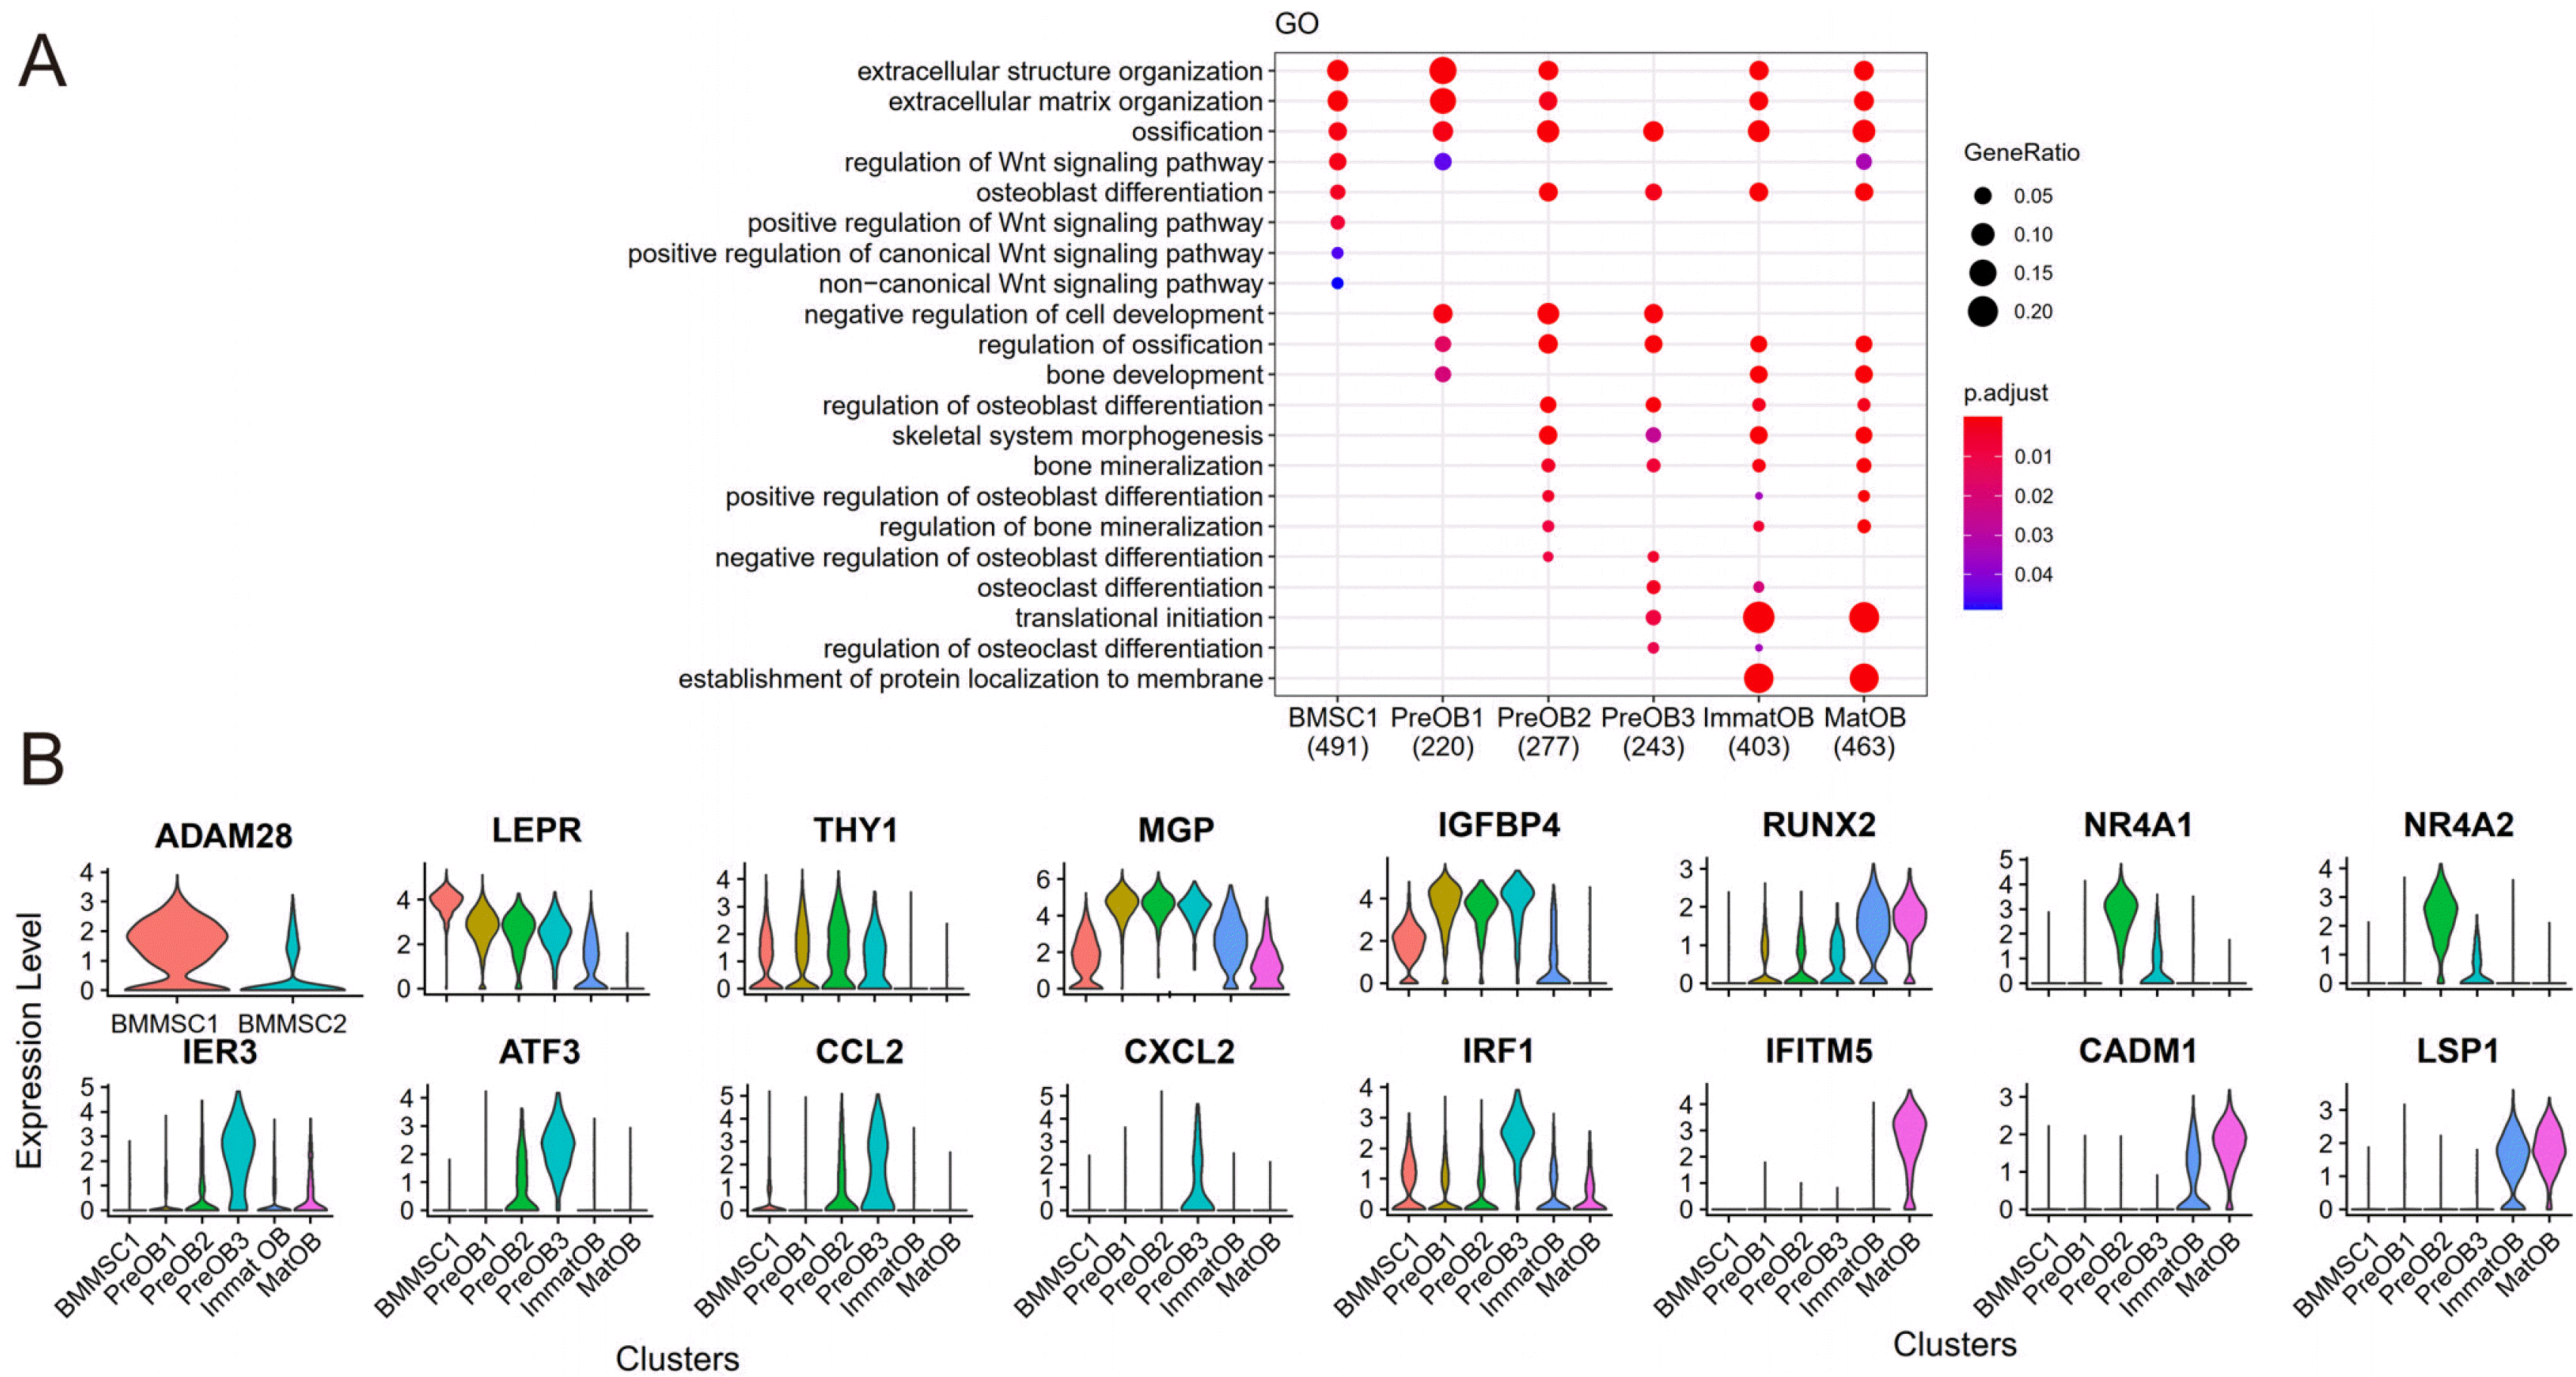
Based on the functional enrichment analysis of the highly expressed genes, we found that the GO terms related to the Wnt/β-catenin pathway, such as “regulation of Wnt signaling pathway”, “positive regulation of Wnt signaling pathway”, “positive regulation of canonical Wnt signaling pathway”, “non-canonical Wnt signaling pathway” were mainly enriched in BMMSC1 (Fig. 3A). Comparing the BMMSCs subclusters related to osteogenesis (BMMSC1) with adipogenesis (BMMSC2), we found that the expression of ADAM28 (ADAM metallopeptidase domain 28) was significantly upregulated in BMMSC1, but ADAM28 was almost absent in BMMSC2 (Fig. 3B). ADAM28 belongs to the ADAM family of multifunctional cell surface and secreted glycoproteins. ADAM28 was expressed in multiple human tooth germ and tooth mesenchyme (20). Overexpression of ADAM28 favored to the proliferation and lineage-specific differentiation of human dental papilla mesenchymal cells (hDPMCs) (21). We speculated that ADAM28 played a similar role in BMMSCs and could induce BMMSCs to enter osteogenic differentiation instead of adipogenic differentiation.
Preosteoblasts, which were in the transitional stage from skeletal progenitors to osteoblasts, not only expressed BMMSCs specific genes, such as leptin receptor (LEPR) and thymus cell antigen 1 (THY1, an important regulator of osteogenic differentiation and adipogenic differentiation), but also highly expressed matrix gla protein (MGP) and insulin-like growth factor-binding protein 4 (IGFBP4) (Fig. 3B). MGP promoted the bone formation by activating the Wnt/β-catenin pathway (22). IGFBP4 reduced the proliferation of BMMSCs, thus inhibiting excessive osteogenic differentiation in rats (23, 24).
Interestingly, we noticed that two preosteoblasts subclusters with opposite functions were novelly identified in our studies. PreOB2 highly expressed nuclear receptor subfamily 4 group A member 1 and 2 (NR4A1 and NR4A2) and PreOB3 highly expressed activating transcription factor 3 (ATF3), CC motif chemokine ligand 2 (CCL2), CXC motif chemokine 2 (CXCL2) and interferon regulatory factor 1 (IRF1) (Fig. 3B). NR4A1 and NR4A2 in cluster PreOB2 were critical negative regulators of osteoclastogenesis and bone resorption, suggesting their bone protective role (25, 26). In PreOB3, IRF1 (27) and ATF3 might act as a negative regulator of osteoblast differentiation. The overexpression of ATF3 inhibited transcription of pro-osteogenic differentiation-associated genes, such as bone morphogenetic protein 2 (BMP2) and ALPL (28). CCL2 played role in recruitment of monocytes and the formation of osteoclasts (29). Studies revealed that CXCL2 promoted osteoclastogenesis and prevented preosteoblast differentiation through inhibiting the ERK1/2 signaling pathway (30, 31). Interestingly, we found that immediate early response 3 (IER3) has the highest expression in the PreOB3 cluster (Fig. 3B). It has been reported that IER3 may be associated with multiple signaling pathways, such as nuclear factor kappa B (NF-κB) pathway and extracellular regulated protein kinases (ERK) pathway (32). We speculated that it may play a role in osteogenic differentiation.
GO enrichment analysis showed that terms which were related to bone development in PreOB2 included “positive regulation of osteoblast differentiation”, “regulation of bone mineralization”, “extracellular structure organization”, “extracellular matrix organization” etc. On the contrary, the GO terms related to “osteoclast differentiation” and “regulation of osteoclast differentiation” were enriched in PreOB3 (Fig. 3A). Combining pseudotime trajectory analysis and transcription factor annotation, we found that PreOB1 would transition to PreOB2 and PreOB3 after entering the end of development, but only PreOB2 could develop into mature osteoblasts. Cluster PreOB3 and PreOB2 had different effects on osteogenesis. PreOB3 could recruit osteoclasts and inhibit the proliferation and differentiation of preosteoblasts through expressing ATF3, CCL2 and CXCL2 genes.
Next, we checked the expression of mature osteoblasts signature genes in the integrated data. Except the expression of BGLAP, COL1A1 and SPP1, we also found that interferon-induced transmembrane protein 5 (IFITM5) with bone formation and osteoblast maturation functions (33) was highly expressed (Fig. 3B). In a study, Takao and colleagues demonstrated that cell adhesion molecule 1 (CADM1) expressed transiently during osteoblastic maturation in mouse. CADM1, located on the “lateral” membrane of osteoblasts, was mainly responsible for interstitial communication (34). Our results showed that CADM1 was also highly expressed (Fig. 3B). Therefore, CADM1 might play a similar role in cellular communication in human mature osteoblasts. Previous studies showed that lymphocyte-specific protein 1 (LSP1) was mainly expressed in white blood cells (35, 36). A recent study suggested endothelium also expressed LSP1 which played an essential role in transendothelial migration (36). We found that LSP1 was highly enriched in immature osteoblasts and mature osteoblasts (Fig. 3B).

Ligand-receptor interactions in various stages of osteogenesis cells

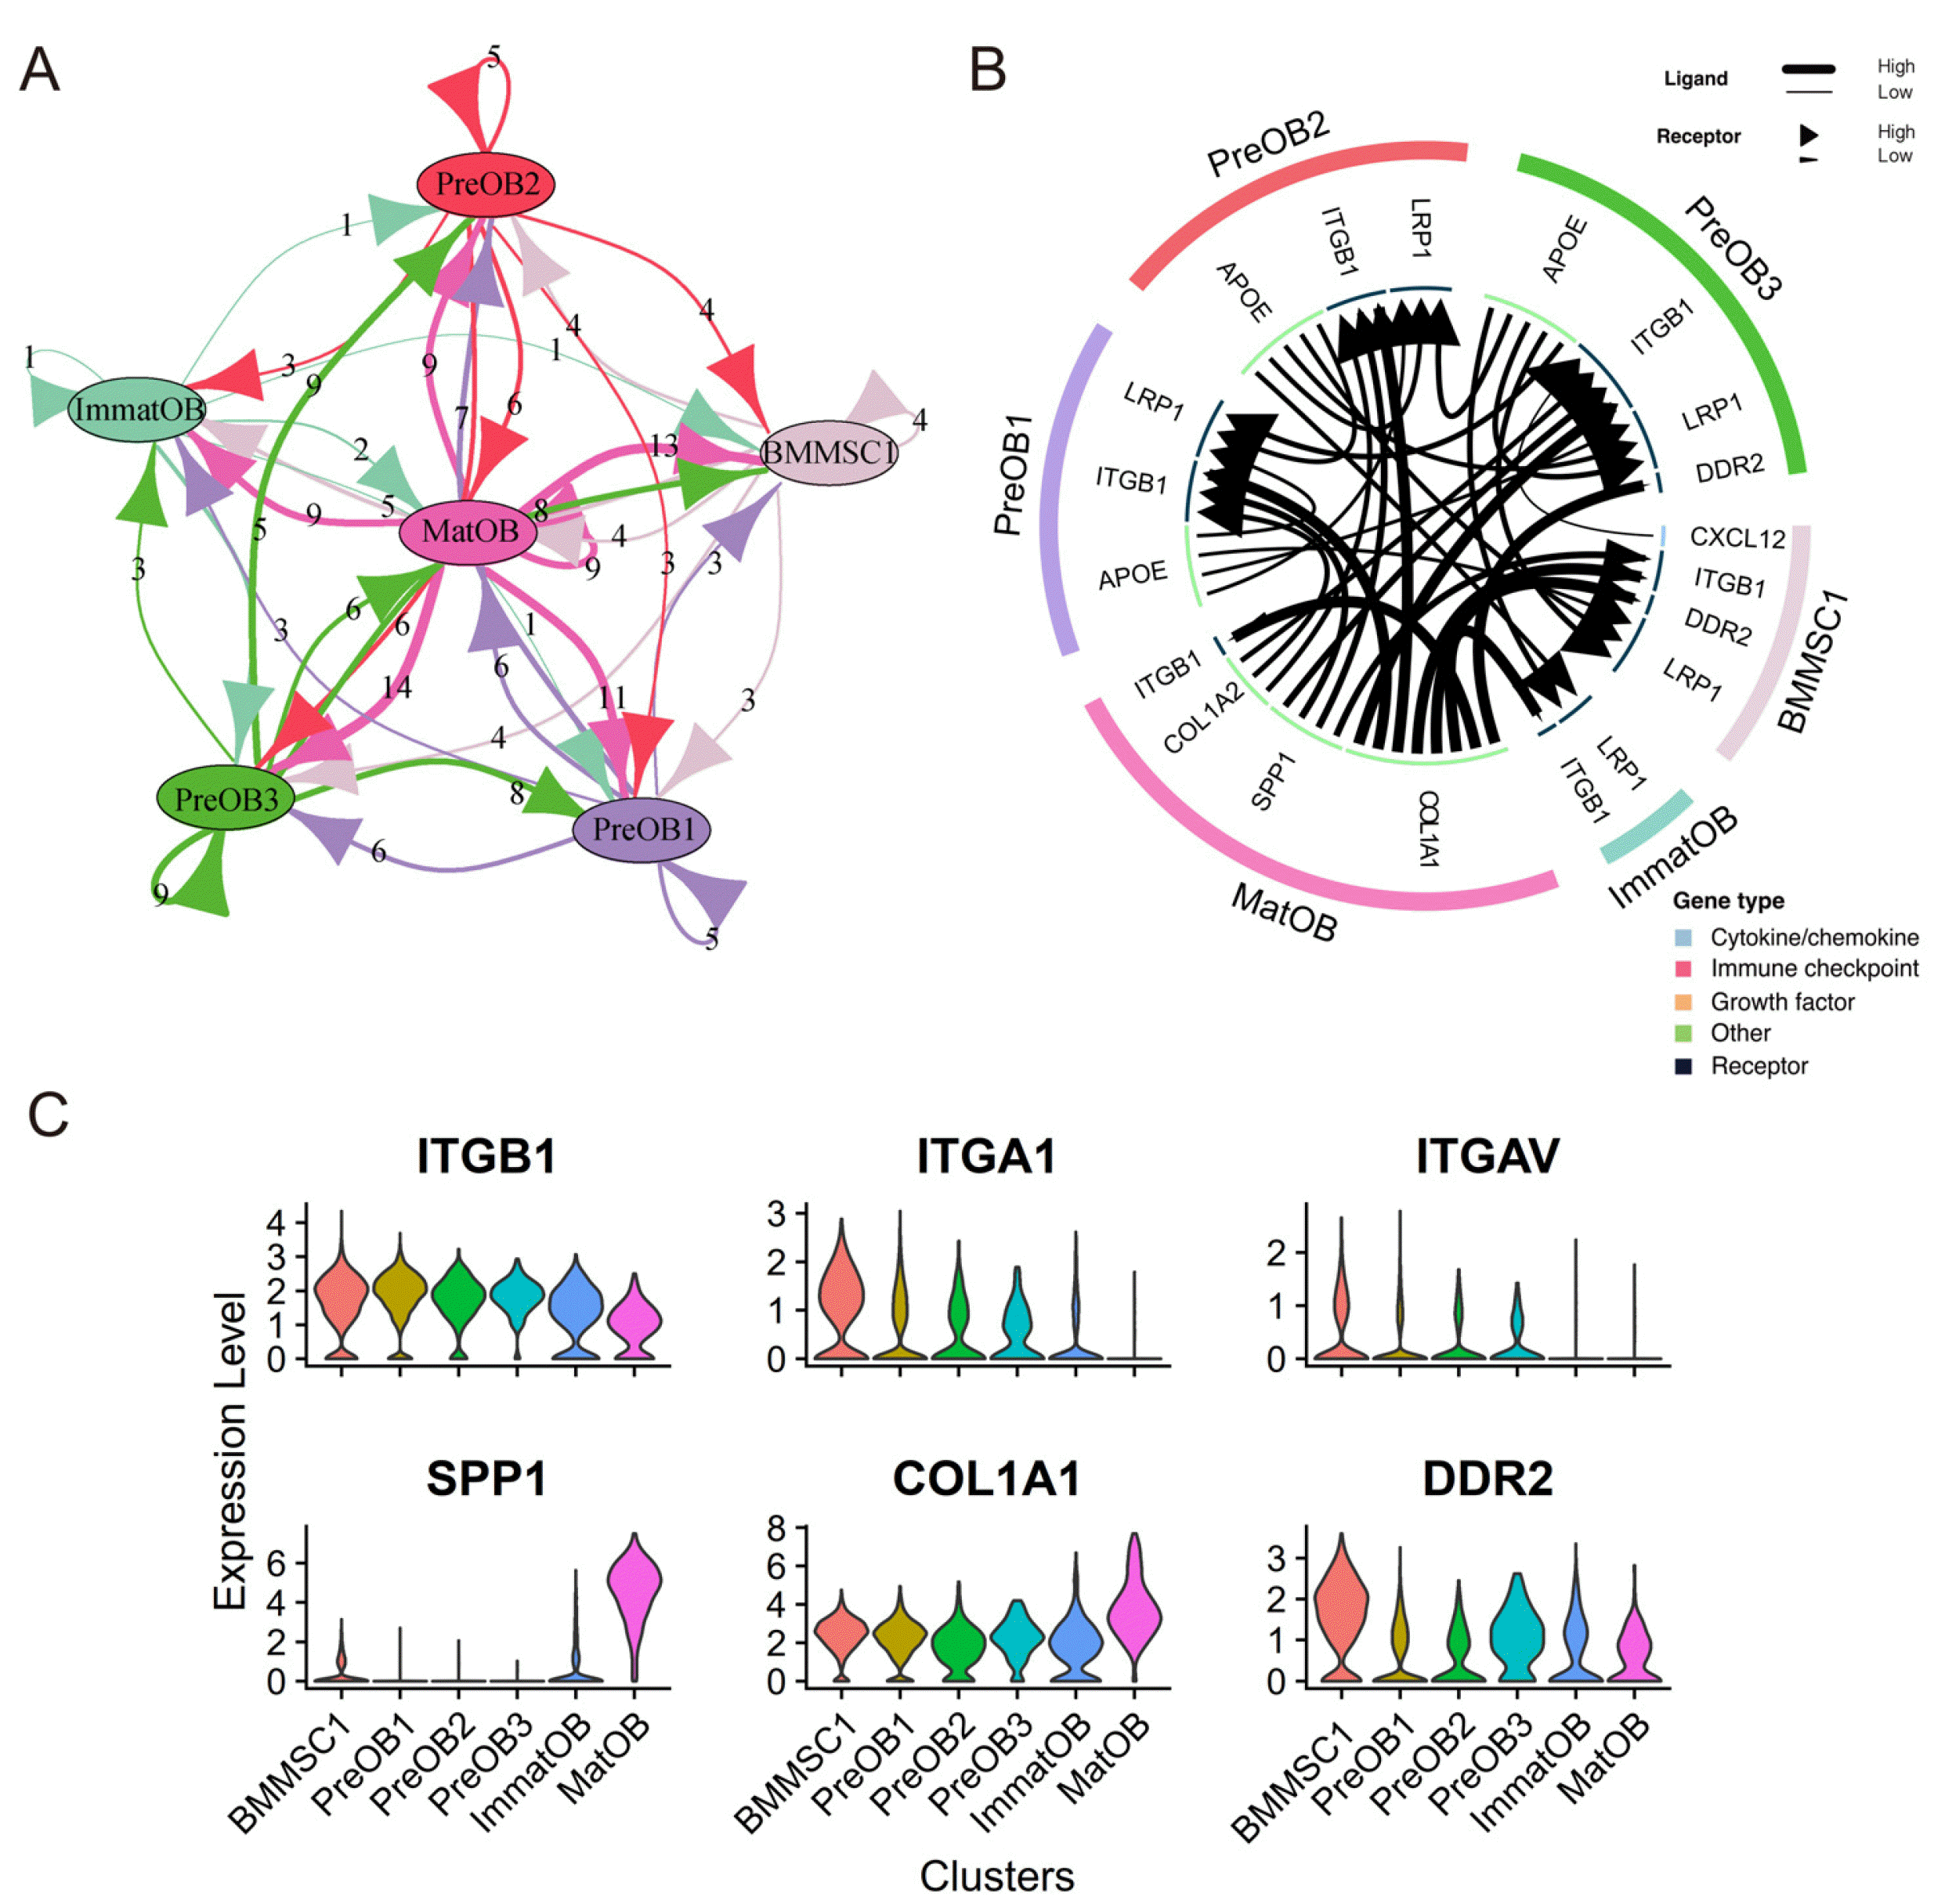
To investigate the biological interaction between BMMSCs and osteoblasts, we performed intercellular communication analysis using an R Package “iTALK” (15), which can identify ligands and receptors in scRNA-seq data (Supplementary Table S1) and analyze mediated cross-signal of cell communication (Fig. 4A). The top 30 pairs of ligand-receptor related to intercellular communication in the osteogenic lineage were visualized (Fig. 4B). We observed strong interaction between mature osteoblasts and BMMSCs. The results showed integrin subunit β1 (ITGB1) receptors were widely present in various subclusters (Fig. 4C). However, the prerequisite for integrin as a receptor was that the integrin β chain (37) must be combined with the integrin α chain to form heterodimeric transmembrane proteins (38) in order to bind the ligand. In our results, secreted phosphoprotein 1 (SPP1) and type I collagen (COL1A1) in mature osteoblast clusters could interact with ITGB1 receptor. SPP1 could inhibit adipogenesis and promote osteogenic differentiation of BMMSCs through integrin αv/β1 (39). COL1A1 regulated the process of osteogenic differentiation which was mainly mediated by integrin α1/β1 (38, 40, 41). The α chain integrin subunit alpha V (ITGAV) and integrin subunit alpha 1 (ITGA1) were mainly expressed in BMMSC1, PreOB1, PreOB2 and PreOB3 (Fig. 4C). Therefore, although ITGB1 was expressed in all subclusters of osteogenic lineage, COL1A1 and SPP1 expressed in the mature osteoblasts may promote osteogenic differentiation of BMMSCs and preosteoblasts.
Discoidin domain receptor 2 (DDR2) and COL1A1 were another significant ligand-receptor pair. COL1A1 is a common marker of osteoblasts, and the expression of COL1A1 is up-regulated during the differentiation of osteoblasts from preosteoblasts to mature osteoblasts (42). Previous studies have shown that DDR2 is a potential cellular marker for osteogenic progenitors and principally binds to collagens type I, II, III and X (43, 44). After being activated by collagen ligands, the downstream signals propagated by DDR2 stimulated the ERK1/2 and p38 MAP kinase pathways to increase osteoblast differentiation (44, 45). In our study, DDR2 was mostly expressed in BMMSC1, and COL1A1 was highly expressed in MatOB (Fig. 4C). Therefore, COL1A1 specifically expressed by mature osteoblasts could mediate the differentiation of BMMSCs towards osteogenic direction.

Protein-protein interaction network

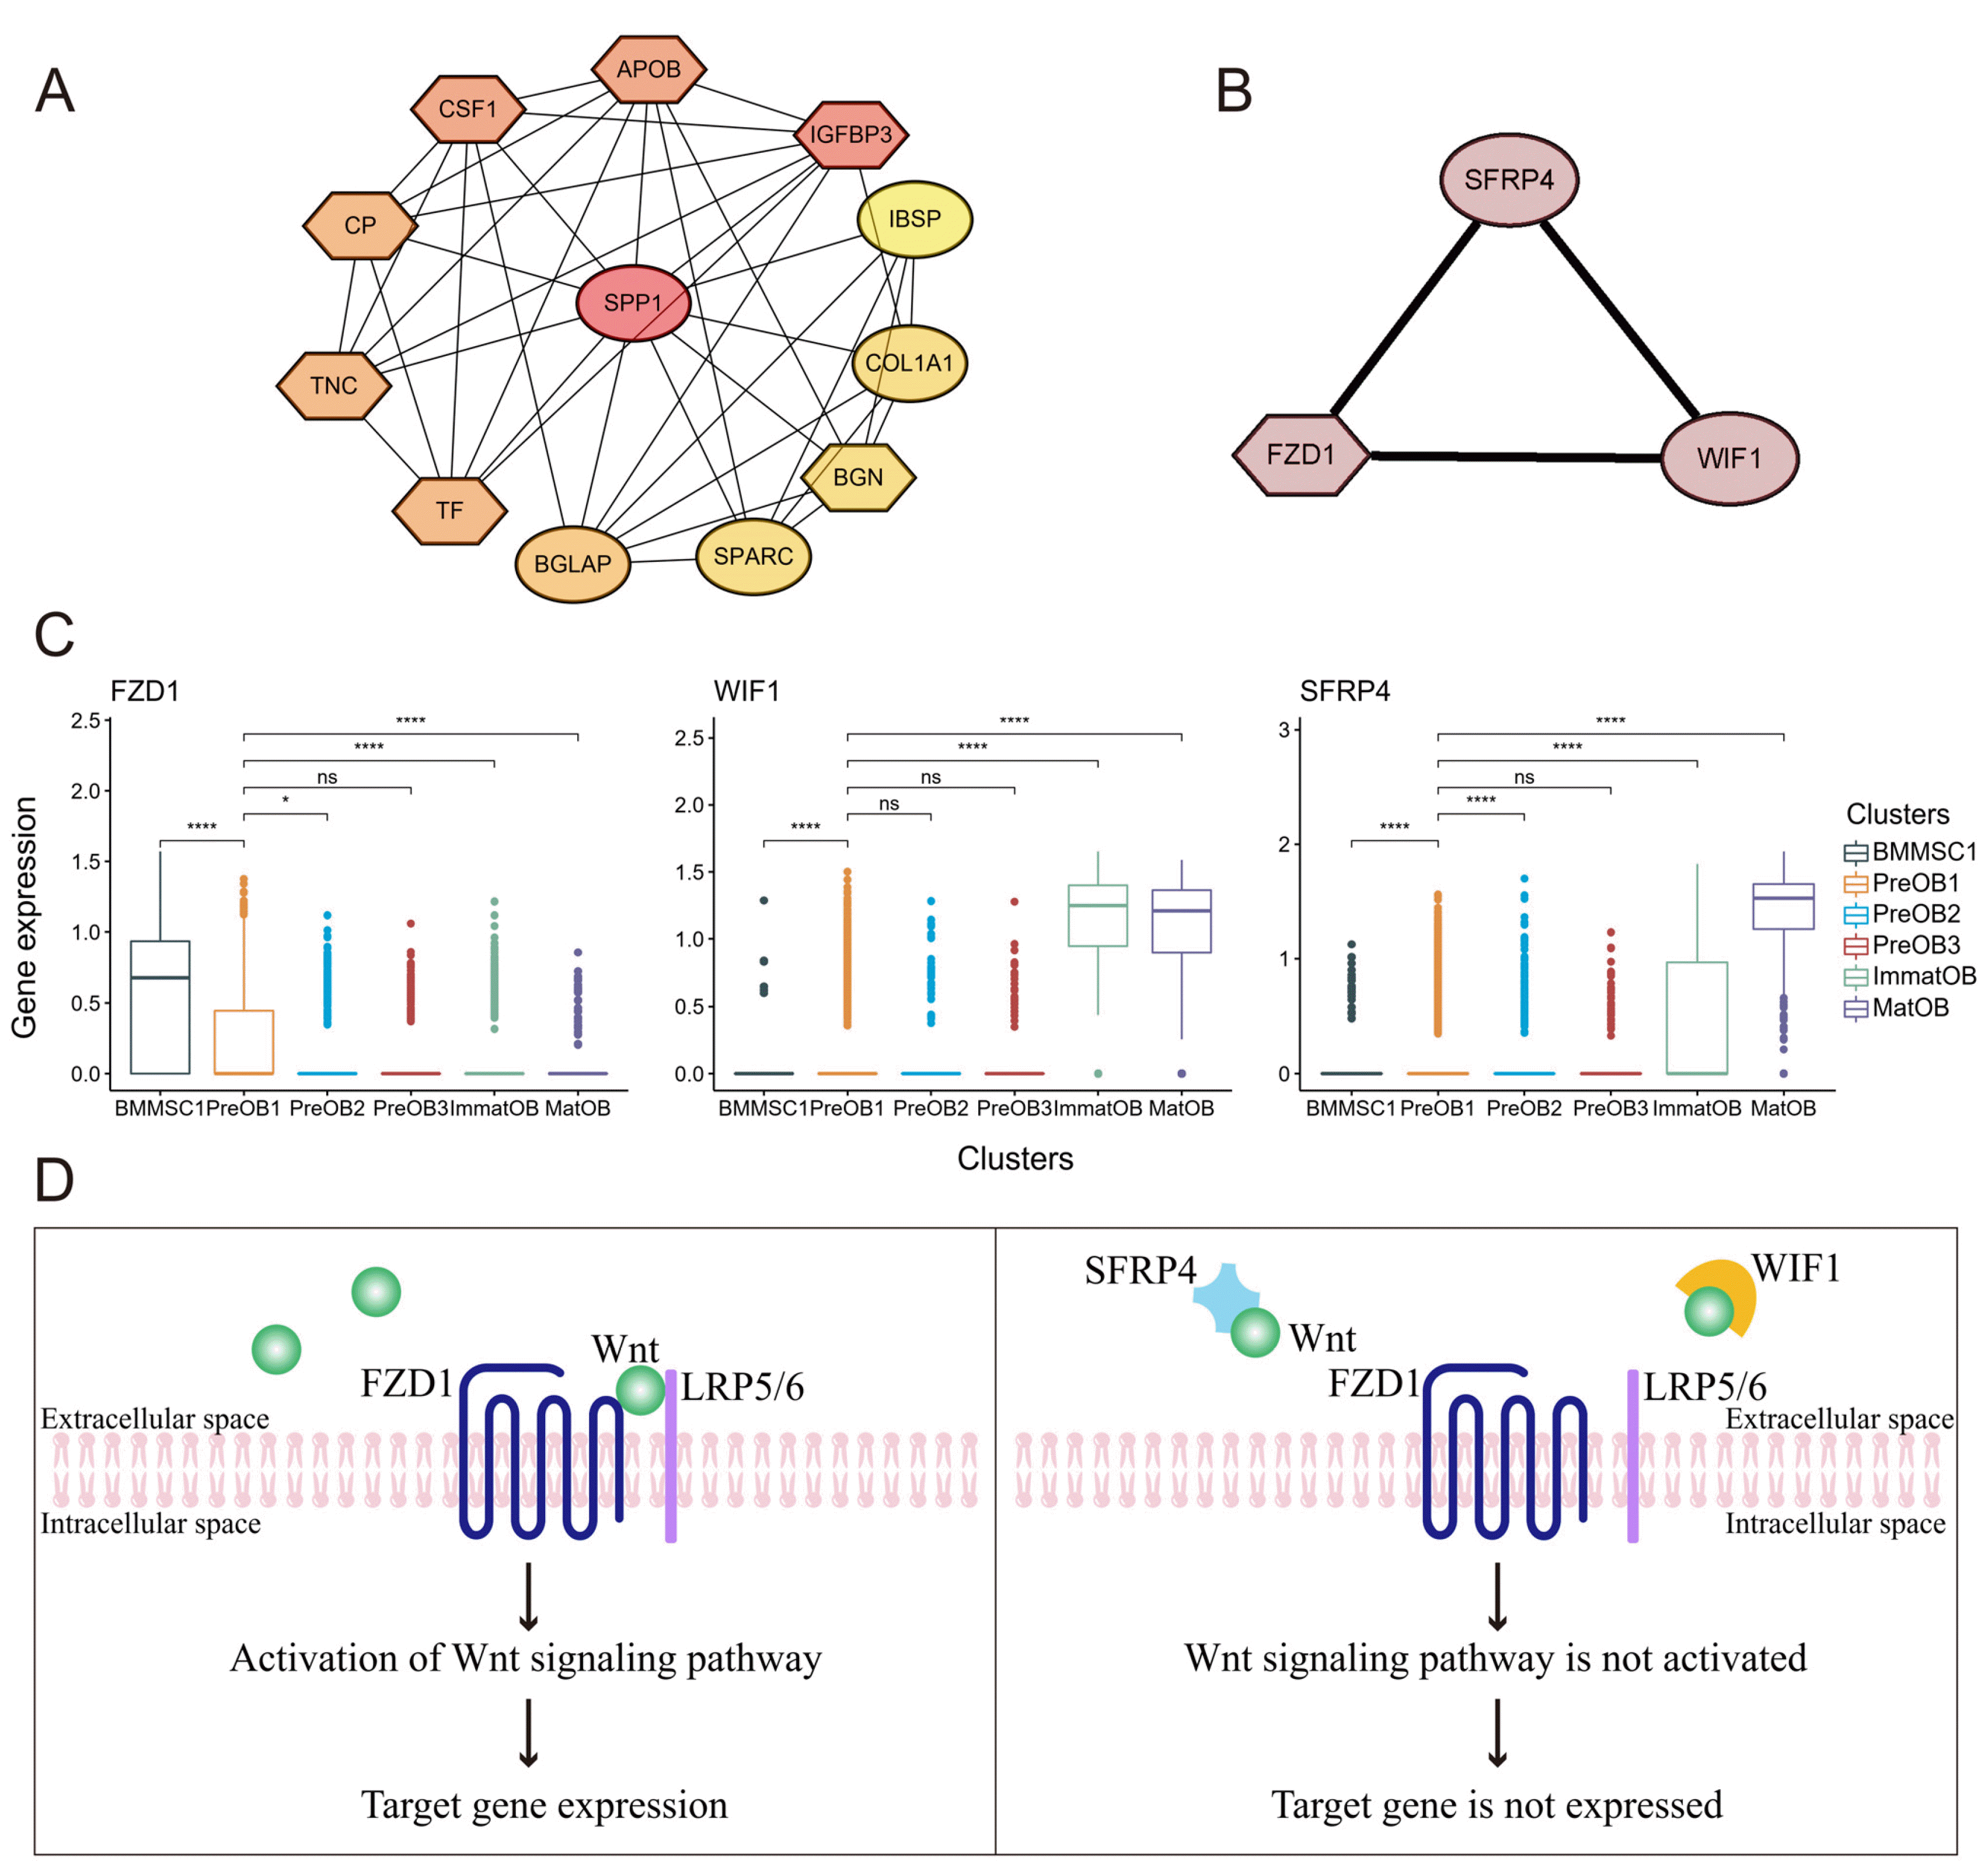
In order to identify significant genes that play a critical important role in mature osteoblasts and BMMSCs interactions. We mapped top 30 genes of the two clusters to a protein-protein interaction network based on the STRING dataset, and then used Cytoscape (16) to identify biologically meaningful genes and display their relationships. We found some interesting protein-protein interactions in mature osteoblasts (MatOB) and BMMSCs (BMMSC1). A total of 41 nodes and 120 edges were constructed in the PPI network (Supplementary Fig. S4A and S4B). This included a ribosomal protein (RP) family network that played an important role in protein biosynthesis (Supplementary Fig. S4B). Two sub-networks were identified by using MCODE (Fig. 5A and 5B). SPP1 showed intensive interactions with 11 proteins including COL1A1 and BGLAP in one of the sub-networks (Fig. 5A). We were interested in another sub-network including frizzled class receptor 1 (FZD1), WNT inhibitory factor 1 (WIF1) and secreted frizzled related protein 4 (SFRP4) (Fig. 5B).
FZD1 was a transmembrane receptor that could bind to Wnt ligand and further mediate Wnt canonical and non-canonical pathways (46). As a member of FZD protein family, the specific mechanism of how FZD1 regulated cell differentiation had not yet been elucidated. Some studies showed that transcription factor activating protein 2 (AP2) was a negative regulator of osteoblast differentiation and mineralization, and its inhibitory effect may be mediated through the down-regulation of FZD1 expression (46). Similarly, E2F transcription factor 1 (E2F1) promoted differentiation and mineralization of osteoblasts by upregulating the expression of FZD1 (47). Therefore, the above findings suggested that the expression of FZD1 had a positive effect on the differentiation of osteoblasts. When WIF1 and SFRP family members (sFRP1, 2, 3, 4, 5) competitively bound to soluble Wnt ligands, the binding of the Wnt/FZD complex was inhibited (48, 49). SFRP4 expression has been reported in the osteogenic lineage, and previous studies using in vitro assays have shown that SFRP4 inhibits osteoblast proliferation and differentiation, at least in part, by attenuating classical Wnt signaling in vivo (50, 51). Functional studies showed that sFRP4 suppressed the osteoblastic differentiation of human BMSCs (52). WIF1 expression has been detected in osteoblasts in previous studies (53, 54), and WIF1, as a secretory regulator of Wnt signaling, inhibited Wnt signaling and negatively regulated osteogenic differentiation of mouse mesenchymal cells in vitro (55). In our study, SFRP4 was highly expressed in MatOB, WIF1 was highly expressed in ImmatOB and MatOB, and FZD1 was only expressed in BMMSC1 (Fig. 5C). We verified their expression in the latest sample data collected (Supplementary Fig. S4C), in which FZD1 was highly expressed in BMMSC, WIF1 and SFRP4 were highly expressed in MatOB. We speculated that mature osteoblasts inhibited the binding of FZD1 and Wnt ligand in BMMSC through expressing sFRP4 and WIF1, hence the inhibited Wnt pathway weakened the osteogenic differentiation ability of BMMSCs (Fig. 5D).

Discussion

BMMSCs are the major source of osteoblasts and adipocytes in bone (56). Various factors participate in the process of osteogenesis via complex biochemical reactions and cellular communication. Our study integrated scRNA-seq transcriptomes of BMMSCs and osteoblasts in humans, and provided important insights into the differentiation fate of BMMSCs and osteoblasts. In addition, we also analyzed the interaction between BMMSCs and osteoblasts in terms of the ligand receptor pairs.
Previous studies have shown that during osteogenic development at least three stages were recognized: preosteoblasts, immature osteoblasts and mature osteoblasts (34, 57). Some in vivo findings combined with the previous in vitro data indicated that RUNX2 triggered the expression of downstream genes at an early stage of osteoblast differentiation, but maintained osteoblasts in an immature stage. RUNX2 inhibited osteoblast maturation and the transition to osteocytes, when the expression of RUNX2 began to decrease, the immature osteoblasts progressed to a mature state (58). The obvious fluctuation of RUNX2 expression in our results confirmed the role of RUNX2 in determining the development stage of the osteogenic subgroups. In our previous study, the cluster B6 (Supplementary Fig. S2A) from BMMSCs were defined as chondrocytes (7). After integration analysis, we found that B6 appeared in immature osteoblasts cluster (Fig. 1A). Cluster B6 highly expressed NCAM1, OMD and WIF1 genes as chondrocytes do. However, cluster B6 also highly expressed late-stage markers for osteoblast differentiation, such as IBSP and ENPP1 (Supplementary Fig. S2B). In contrast, we considered that cluster B6 was closer to late-stage osteoblasts than chondrocytes.
We described two subclusters of osteoblasts (PreOB2 and PreOB3), both of which expressed the marker genes of preosteoblast, such as LEPR, THY1, MGP and IGFBP4. Differently, the cluster PreOB2 highly expressed NR4A1 and NR4A2, which were mainly involved in the regulation of osteoblast differentiation and inhibiting the recruitment of osteoclasts. The cluster PreOB3, which was never reported before, highly expressed ATF3, CCL2, CXCL2, IRF1 and IER3, and had the function of inhibiting cell differentiation, maintaining cells less differentiated status and recruiting osteoclasts. We speculated that high expression of NR4A1 and NR4A2 in preosteoblasts is essential to osteoblast maturation. On the contrary, when preosteoblasts highly expressed ATF3, IRF1 and CXCL2, preosteoblasts probably maintained a state of arrested differentiation and played the function of recruiting osteoclasts. It was also possible that PreOB3 was bone lining cells since PreOB3 was in a less active state. However, the specific genes expressed in bone lining cells were currently unclear (59). Most studies indicated that the expression of genes in bone lining cells is similar to that in preosteoblasts. Further morphological studies are needed to verify if PreOB3 was bone lining cells.
Each cell in a multicellular organism was not independent, but connected and communicated with other cells in a variety of ways. BMMSCs and osteoblasts play a crucial role in bone metabolism, and they communicate with others through some of cell signal molecules. Under the condition of co-culture with osteoblasts, it was found that the expression levels of ALP and BSP in BMMSCs were higher than that in BMMSCs mono-cultured. And the promotion of ALP and BSP transcription was mediated by gap junctions in direct cell contact (60). By adding human primary BMMSCs-derived exosomes to the cultured osteoblasts, it was found that the exosomes were endocytosed into osteoblasts to increase calcified nodules and enhance the intensity of ALP staining (61). Another rat experiment showed that miR-395 in BMMSCs-derived exosomes can target STAT1 and inhibit STAT1 levels to promote the proliferation and differentiation of osteoblasts. In our analysis, we investigated the cells interactions between BMMSCs and osteoblasts. We observed strong interaction between mature osteoblasts and BMMSCs and COL1A1-DDR2, COL1A1-ITGB1 and SPP1-ITGB1 were possible significant ligand-receptor pairs involved in the interaction. Furthermore, we suggested that mature osteoblasts might inhibit the osteogenic ability of BMMSCs through expressing SFRP4 and WIF1 to inhibit the competitive binding of FZD1 to Wnt ligands. Therefore, mature osteoblasts may mediate negative feedback regulation of osteogenesis process.
There were two limitations in the present study. At first, all cells were collected from diseased individuals. Comparing with healthy individuals, the types or proportions of osteoblast subclusters we got from the data might have some deviations. We don’t know if the conclusion (feedback mechanism between WIF1/SFRP4 and FZD1/Wnt) derived from the data of the patient’s osteoblast and BMMSCs was applied to osteoblast and BMMSCs from a normal person. Therefore, normal subjects are needed in future studies to reveal osteoblast and BMMSCs subclusters and the molecular mechanism between WIF1/SFRP4 and FZD1/Wnt. On the other hand, age was the main factor affecting the transcription pattern of BMMSCs (7). In this study, the subjects of BMMSCs consisted of a 67-year-old postmenopausal female with osteoporosis and an 85-year-old male with osteoarthritis. The osteoblasts were collected from the femur head of one 31-year-old male patient with osteoarthritis and osteopenia. Although there were certain limitations, we attempted to reveal a continuum of the dynamic gene expression pattern of BMMSCs to osteoblasts, and our dataset and analysis will serve as a resource for future studies investigating osteogenesis differentiation.
In summary, we have sorted out the development trajectory from BMMSCs to mature osteoblasts in vivo and delineated key transcription factors. At the single-cell level, we verified the known BMMSCs and osteoblasts subtypes (BMMSC1, BMMSC2, PreOB1, ImmatOB and MatOB), and identified a novel osteoblast subtype PreOB3 which highly expressed ATF3, CCL2, CXCL2 and IRF1. We suggested that WIF1 and sFRP4 expressed in osteoblasts inhibited the binding of FZD1 to Wnt ligand in BMMSCs, thereby further inhibiting osteogenic differentiation.

Notes

Ethics Approval and Consent to Participate

The study was approved by the Medical Ethics Committee of Xiangya Hospital of Central South University, and the IRB approval number is No. 201912315.

Potential Conflict of Interest

All authors have no conflicts of interest to declare.

Author Contributions

HWD and LJT conceived the study and designed the experiments. YG provided technical support. XHL, HXZ, CZ, YC and YL performed most of the experiments. YL and YC analyzed the data, wrote the manuscript and designed the figures. LJT, HS, HMX and HWD corrected the language, managed editing of the manuscript, supervised writing and approved the final draft. All authors have read and agreed to the published version of the manuscript.

Data Availability

The scRNA-seq datasets of human BMMSCs and human osteoblasts can be accessed from Gene Expression Omnibus (GEO) database under the accession numbers of GSE147287 and GSE147390, respectively.

Supplementary Materials

Supplementary data including one table and four figures can be found with this article online at https://doi.org/10.15283/ijsc22101.

References

1. Martin TJ, Seeman E. 2008; Bone remodelling: its local regulation and the emergence of bone fragility. Best Pract Res Clin Endocrinol Metab. 22:701–722. DOI: 10.1016/j.beem.2008.07.006. PMID: 19028353.
crossref
2. Muruganandan S, Sinal CJ. 2014; The impact of bone marrow adipocytes on osteoblast and osteoclast differentiation. IUBMB Life. 66:147–155. DOI: 10.1002/iub.1254. PMID: 24638917.
crossref
3. Chen Q, Shou P, Zheng C, Jiang M, Cao G, Yang Q, Cao J, Xie N, Velletri T, Zhang X, Xu C, Zhang L, Yang H, Hou J, Wang Y, Shi Y. 2016; Fate decision of mesenchymal stem cells: adipocytes or osteoblasts? Cell Death Differ. 23:1128–1139. DOI: 10.1038/cdd.2015.168. PMID: 26868907. PMCID: PMC4946886.
crossref
4. Zieba JT, Chen YT, Lee BH, Bae Y. 2020; Notch signaling in skeletal development, homeostasis and pathogenesis. Bio-molecules. 10:332. DOI: 10.3390/biom10020332. PMID: 32092942. PMCID: PMC7072615.
crossref
5. Maeda K, Kobayashi Y, Koide M, Uehara S, Okamoto M, Ishihara A, Kayama T, Saito M, Marumo K. 2019; The regulation of bone metabolism and disorders by Wnt signaling. Int J Mol Sci. 20:5525. DOI: 10.3390/ijms20225525. PMID: 31698687. PMCID: PMC6888566.
crossref
6. Liu S, Stroncek DF, Zhao Y, Chen V, Shi R, Chen J, Ren J, Liu H, Bae HJ, Highfill SL, Jin P. 2019; Single cell sequencing reveals gene expression signatures associated with bone marrow stromal cell subpopulations and time in culture. J Transl Med. 17:23. DOI: 10.1186/s12967-018-1766-2. PMID: 30635013. PMCID: PMC6330466.
crossref
7. Wang Z, Li X, Yang J, Gong Y, Zhang H, Qiu X, Liu Y, Zhou C, Chen Y, Greenbaum J, Cheng L, Hu Y, Xie J, Yang X, Li Y, Schiller MR, Chen Y, Tan L, Tang SY, Shen H, Xiao HM, Deng HW. 2021; Single-cell RNA sequencing deconvolutes the in vivo heterogeneity of human bone marrow-derived mesenchymal stem cells. Int J Biol Sci. 17:4192–4206. DOI: 10.7150/ijbs.61950. PMID: 34803492. PMCID: PMC8579438.
crossref
8. Gong Y, Yang J, Li X, Zhou C, Chen Y, Wang Z, Qiu X, Liu Y, Zhang H, Greenbaum J, Cheng L, Hu Y, Xie J, Yang X, Li Y, Bai Y, Wang YP, Chen Y, Tan LJ, Shen H, Xiao HM, Deng HW. 2021; A systematic dissection of human primary osteoblasts in vivo at single-cell resolution. Aging (Albany NY). 13:20629–20650. DOI: 10.18632/aging.203452. PMID: 34428745. PMCID: PMC8436943.
crossref
9. Fujita K, Roforth MM, Atkinson EJ, Peterson JM, Drake MT, McCready LK, Farr JN, Monroe DG, Khosla S. 2014; Isolation and characterization of human osteoblasts from needle biopsies without in vitro culture. Osteoporos Int. 25:887–895. DOI: 10.1007/s00198-013-2529-9. PMID: 24114401. PMCID: PMC4216562.
crossref
10. Quirici N, Soligo D, Bossolasco P, Servida F, Lumini C, Deliliers GL. 2002; Isolation of bone marrow mesenchymal stem cells by anti-nerve growth factor receptor antibodies. Exp Hematol. 30:783–791. DOI: 10.1016/S0301-472X(02)00812-3. PMID: 12135677.
crossref
11. Poloni A, Maurizi G, Rosini V, Mondini E, Mancini S, Discepoli G, Biasio S, Battaglini G, Felicetti S, Berardinelli E, Serrani F, Leoni P. 2009; Selection of CD271(+) cells and human AB serum allows a large expansion of mesenchymal stromal cells from human bone marrow. Cytotherapy. 11:153–162. DOI: 10.1080/14653240802582125. PMID: 19301169.
crossref
12. Butler A, Hoffman P, Smibert P, Papalexi E, Satija R. 2018; Integrating single-cell transcriptomic data across different conditions, technologies, and species. Nat Biotechnol. 36:411–420. DOI: 10.1038/nbt.4096. PMID: 29608179. PMCID: PMC6700744.
crossref
13. Brun J, Lutz KA, Neumayer KM, Klein G, Seeger T, Uynuk-Ool T, Wörgötter K, Schmid S, Kraushaar U, Guenther E, Rolauffs B, Aicher WK, Hart ML. 2015; Smooth muscle-like cells generated from human mesenchymal stromal cells display marker gene expression and electrophysiological competence comparable to bladder smooth muscle cells. PLoS One. 10:e0145153. DOI: 10.1371/journal.pone.0145153. PMID: 26673782. PMCID: PMC4684225.
crossref
14. Angerer P, Haghverdi L, Büttner M, Theis FJ, Marr C, Buettner F. 2016; destiny: diffusion maps for large-scale single-cell data in R. Bioinformatics. 32:1241–1243. DOI: 10.1093/bioinformatics/btv715. PMID: 26668002.
15. Wang Y, Wang R, Zhang S, Song S, Jiang C, Han G, Wang M, Ajani J, Futreal A, Wang L. 2019; iTALK: an R package to characterize and illustrate intercellular communication. bioRxiv. doi:10.1101/507871. DOI: 10.1101/507871.
crossref
16. Shannon P, Markiel A, Ozier O, Baliga NS, Wang JT, Ramage D, Amin N, Schwikowski B, Ideker T. 2003; Cytoscape: a software environment for integrated models of biomo-lecular interaction networks. Genome Res. 13:2498–2504. DOI: 10.1101/gr.1239303. PMID: 14597658. PMCID: PMC403769.
crossref
17. Chin CH, Chen SH, Wu HH, Ho CW, Ko MT, Lin CY. 2014; cytoHubba: identifying hub objects and sub-networks from complex interactome. BMC Syst Biol. 8(Suppl 4):S11. DOI: 10.1186/1752-0509-8-S4-S11. PMID: 25521941. PMCID: PMC4290687.
crossref
18. Becht E, McInnes L, Healy J, Dutertre CA, Kwok IWH, Ng LG, Ginhoux F, Newell EW. 2018; Dimensionality reduction for visualizing single-cell data using UMAP. Nat Biote-chnol. doi: 10.1038/nbt.4314 [Epub ahead of print]. DOI: 10.1038/nbt.4314. PMID: 30531897.
crossref
19. Rutkovskiy A, Stensløkken KO, Vaage IJ. 2016; Osteoblast differentiation at a glance. Med Sci Monit Basic Res. 22:95–106. DOI: 10.12659/MSMBR.901142. PMID: 27667570. PMCID: PMC5040224.
crossref
20. Zhao Z, Wen LY, Jin M, Deng ZH, Jin Y. 2006; ADAM28 participates in the regulation of tooth development. Arch Oral Biol. 51:996–1005. DOI: 10.1016/j.archoralbio.2006.05.010. PMID: 16836973.
crossref
21. Zhao Z, Tang L, Deng Z, Wen L, Jin Y. 2008; Essential role of ADAM28 in regulating the proliferation and differentiation of human dental papilla mesenchymal cells (hDPMCs). Histochem Cell Biol. 130:1015–1025. DOI: 10.1007/s00418-008-0467-y. PMID: 18690470.
crossref
22. Zhang J, Ma Z, Yan K, Wang Y, Yang Y, Wu X. 2019; Matrix Gla protein promotes the bone formation by up-regulating Wnt/β-catenin signaling pathway. Front Endocrinol (Lausanne). 10:891. DOI: 10.3389/fendo.2019.00891. PMID: 31920993. PMCID: PMC6933527.
crossref
23. Li H, Yu S, Hao F, Sun X, Zhao J, Xu Q, Duan D. 2018; Insulin-like growth factor binding protein 4 inhibits proliferation of bone marrow mesenchymal stem cells and enhances growth of neurospheres derived from the stem cells. Cell Biochem Funct. 36:331–341. DOI: 10.1002/cbf.3353. PMID: 30028031.
crossref
24. Wu J, Wang C, Miao X, Wu Y, Yuan J, Ding M, Li J, Shi Z. 2017; Age-related insulin-like growth factor binding protein-4 overexpression inhibits osteogenic differentiation of rat mesenchymal stem cells. Cell Physiol Biochem. 42:640–650. DOI: 10.1159/000477873. PMID: 28595186.
crossref
25. Li X, Wei W, Huynh H, Zuo H, Wang X, Wan Y. 2015; Nur77 prevents excessive osteoclastogenesis by inducing ubiquitin ligase Cbl-b to mediate NFATc1 self-limitation. Elife. 4:e07217. DOI: 10.7554/eLife.07217. PMID: 26173181. PMCID: PMC4518709.
crossref
26. Lee MK, Choi H, Gil M, Nikodem VM. 2006; Regulation of osteoblast differentiation by Nurr1 in MC3T3-E1 cell line and mouse calvarial osteoblasts. J Cell Biochem. 99:986–994. DOI: 10.1002/jcb.20990. PMID: 16741951.
crossref
27. Salem S, Gao C, Li A, Wang H, Nguyen-Yamamoto L, Goltzman D, Henderson JE, Gros P. 2014; A novel role for interferon regulatory factor 1 (IRF1) in regulation of bone metabolism. J Cell Mol Med. 18:1588–1598. DOI: 10.1111/jcmm.12327. PMID: 24954358. PMCID: PMC4152406.
crossref
28. Park JK, Jang H, Hwang S, Kim EJ, Kim DE, Oh KB, Kwon DJ, Koh JT, Kimura K, Inoue H, Jang WG, Lee JW. 2014; ER stress-inducible ATF3 suppresses BMP2-induced ALP expression and activation in MC3T3-E1 cells. Biochem Biophys Res Commun. 443:333–338. DOI: 10.1016/j.bbrc.2013.11.121. PMID: 24315873.
crossref
29. Siddiqui JA, Partridge NC. 2017; CCL2/monocyte chemoattra-ctant protein 1 and parathyroid hormone action on bone. Front Endocrinol (Lausanne). 8:49. DOI: 10.3389/fendo.2017.00049. PMID: 28424660. PMCID: PMC5372820.
crossref
30. Yang Y, Zhou X, Li Y, Chen A, Liang W, Liang G, Huang B, Li Q, Jin D. 2019; CXCL2 attenuates osteoblast differentiation by inhibiting the ERK1/2 signaling pathway. J Cell Sci. 132:jcs230490. DOI: 10.1242/jcs.230490. PMID: 31292171.
31. Ha J, Lee Y, Kim HH. 2011; CXCL2 mediates lipopolysaccharide-induced osteoclastogenesis in RANKL-primed precursors. Cytokine. 55:48–55. DOI: 10.1016/j.cyto.2011.03.026. PMID: 21507677.
crossref
32. Arlt A, Schäfer H. 2011; Role of the immediate early response 3 (IER3) gene in cellular stress response, inflammation and tumorigenesis. Eur J Cell Biol. 90:545–552. DOI: 10.1016/j.ejcb.2010.10.002. PMID: 21112119.
crossref
33. Semler O, Garbes L, Keupp K, Swan D, Zimmermann K, Becker J, Iden S, Wirth B, Eysel P, Koerber F, Schoenau E, Bohlander SK, Wollnik B, Netzer C. 2012; A mutation in the 5'-UTR of IFITM5 creates an in-frame start codon and causes autosomal-dominant osteogenesis imperfecta type V with hyperplastic callus. Am J Hum Genet. 91:349–357. DOI: 10.1016/j.ajhg.2012.06.011. PMID: 22863195. PMCID: PMC3415541.
crossref
34. Inoue T, Hagiyama M, Enoki E, Sakurai MA, Tan A, Wakayama T, Iseki S, Murakami Y, Fukuda K, Hamanishi C, Ito A. 2013; Cell adhesion molecule 1 is a new osteoblastic cell adhesion molecule and a diagnostic marker for osteosarcoma. Life Sci. 92:91–99. DOI: 10.1016/j.lfs.2012.10.021. PMID: 23142238.
crossref
35. Pulford K, Jones M, Banham AH, Haralambieva E, Mason DY. 1999; Lymphocyte-specific protein 1: a specific marker of human leucocytes. Immunology. 96:262–271. DOI: 10.1046/j.1365-2567.1999.00677.x. PMID: 10233704. PMCID: PMC2326732.
crossref
36. Liu L, Cara DC, Kaur J, Raharjo E, Mullaly SC, Jongstra-Bilen J, Jongstra J, Kubes P. 2005; LSP1 is an endothelial gatekeeper of leukocyte transendothelial migration. J Exp Med. 201:409–418. DOI: 10.1084/jem.20040830. PMID: 15684321. PMCID: PMC2213033.
crossref
37. Campbell ID, Humphries MJ. 2011; Integrin structure, activation, and interactions. Cold Spring Harb Perspect Biol. 3:a004994. DOI: 10.1101/cshperspect.a004994. PMID: 21421922. PMCID: PMC3039929.
crossref
38. Marie PJ. 2013; Targeting integrins to promote bone formation and repair. Nat Rev Endocrinol. 9:288–295. DOI: 10.1038/nrendo.2013.4. PMID: 23358353.
crossref
39. Chen Q, Shou P, Zhang L, Xu C, Zheng C, Han Y, Li W, Huang Y, Zhang X, Shao C, Roberts AI, Rabson AB, Ren G, Zhang Y, Wang Y, Denhardt DT, Shi Y. 2014; An osteopontin-integrin interaction plays a critical role in directing adipogenesis and osteogenesis by mesenchymal stem cells. Stem Cells. 32:327–337. DOI: 10.1002/stem.1567. PMID: 24123709. PMCID: PMC3961005.
crossref
40. Reyes CD, García AJ. 2004; Alpha2beta1 integrin-specific collagen-mimetic surfaces supporting osteoblastic differen-tiation. J Biomed Mater Res A. 69:591–600. DOI: 10.1002/jbm.a.30034. PMID: 15162400.
41. Gronthos S, Simmons PJ, Graves SE, Robey PG. 2001; Integrin-mediated interactions between human bone marrow stromal precursor cells and the extracellular matrix. Bone. 28:174–181. DOI: 10.1016/S8756-3282(00)00424-5. PMID: 11182375.
crossref
42. Florencio-Silva R, Sasso GR, Sasso-Cerri E, Simões MJ, Cerri PS. 2015; Biology of bone tissue: structure, function, and factors that influence bone cells. Biomed Res Int. 2015:421746. DOI: 10.1155/2015/421746. PMID: 26247020. PMCID: PMC4515490.
crossref
43. Fu HL, Valiathan RR, Arkwright R, Sohail A, Mihai C, Kumarasiri M, Mahasenan KV, Mobashery S, Huang P, Agarwal G, Fridman R. 2013; Discoidin domain receptors: unique receptor tyrosine kinases in collagen-mediated signaling. J Biol Chem. 288:7430–7437. DOI: 10.1074/jbc.R112.444158. PMID: 23335507. PMCID: PMC3597784.
crossref
44. Yang H, Sun L, Cai W, Gu J, Xu D, Deb A, Duan J. 2020; DDR2, a discoidin domain receptor, is a marker of periosteal osteoblast and osteoblast progenitors. J Bone Miner Metab. 38:670–677. DOI: 10.1007/s00774-020-01108-y. PMID: 32415375. PMCID: PMC7581459.
crossref
45. Ruiz PA, Jarai G. 2011; Collagen I induces discoidin domain receptor (DDR) 1 expression through DDR2 and a JAK2-ERK1/2-mediated mechanism in primary human lung fibroblasts. J Biol Chem. 286:12912–12923. DOI: 10.1074/jbc.M110.143693. PMID: 21335558. PMCID: PMC3075638.
crossref
46. Yu S, Yerges-Armstrong LM, Chu Y, Zmuda JM, Zhang Y. 2015; AP2 suppresses osteoblast differentiation and mineralization through down-regulation of Frizzled-1. Biochem J. 465:395–404. DOI: 10.1042/BJ20140668. PMID: 25369469.
crossref
47. Yu S, Yerges-Armstrong LM, Chu Y, Zmuda JM, Zhang Y. 2013; E2F1 effects on osteoblast differentiation and mineralization are mediated through up-regulation of frizzled-1. Bone. 56:234–241. DOI: 10.1016/j.bone.2013.06.019. PMID: 23806799. PMCID: PMC3758927.
crossref
48. Katoh Y, Katoh M. 2005; Comparative genomics on Dkk1 orthologs. Int J Oncol. 27:275–279. DOI: 10.3892/ijo.27.1.275. PMID: 15942669.
crossref
49. Pez F, Lopez A, Kim M, Wands JR, Caron de Fromentel C, Merle P. 2013; Wnt signaling and hepatocarcinogenesis: molecular targets for the development of innovative anticancer drugs. J Hepatol. 59:1107–1117. DOI: 10.1016/j.jhep.2013.07.001. PMID: 23835194.
crossref
50. Nakanishi R, Shimizu M, Mori M, Akiyama H, Okudaira S, Otsuki B, Hashimoto M, Higuchi K, Hosokawa M, Tsuboyama T, Nakamura T. 2006; Secreted frizzled-related protein 4 is a negative regulator of peak BMD in SAMP6 mice. J Bone Miner Res. 21:1713–1721. DOI: 10.1359/jbmr.060719. PMID: 17002585.
crossref
51. Nakanishi R, Akiyama H, Kimura H, Otsuki B, Shimizu M, Tsuboyama T, Nakamura T. 2008; Osteoblast-targeted expression of Sfrp4 in mice results in low bone mass. J Bone Miner Res. 23:271–277. DOI: 10.1359/jbmr.071007. PMID: 17907918.
crossref
52. Yamada A, Iwata T, Yamato M, Okano T, Izumi Y. 2013; Diverse functions of secreted frizzled-related proteins in the osteoblastogenesis of human multipotent mesenchymal stromal cells. Biomaterials. 34:3270–3278. DOI: 10.1016/j.biomaterials.2013.01.066. PMID: 23384792.
crossref
53. Baker EK, Taylor S, Gupte A, Chalk AM, Bhattacharya S, Green AC, Martin TJ, Strbenac D, Robinson MD, Purton LE, Walkley CR. 2015; Wnt inhibitory factor 1 (WIF1) is a marker of osteoblastic differentiation stage and is not silenced by DNA methylation in osteosarcoma. Bone. 73:223–232. DOI: 10.1016/j.bone.2014.12.063. PMID: 25571841.
crossref
54. Kansara M, Tsang M, Kodjabachian L, Sims NA, Trivett MK, Ehrich M, Dobrovic A, Slavin J, Choong PF, Simmons PJ, Dawid IB, Thomas DM. 2009; Wnt inhibitory factor 1 is epigenetically silenced in human osteosarcoma, and targeted disruption accelerates osteosarcomagenesis in mice. J Clin Invest. 119:837–851. DOI: 10.1172/JCI37175. PMID: 19307728. PMCID: PMC2662557.
crossref
55. Cho SW, Yang JY, Sun HJ, Jung JY, Her SJ, Cho HY, Choi HJ, Kim SW, Kim SY, Shin CS. 2009; Wnt inhibitory factor (WIF)-1 inhibits osteoblastic differentiation in mouse embryonic mesenchymal cells. Bone. 44:1069–1077. DOI: 10.1016/j.bone.2009.02.012. PMID: 19254785.
56. Yue R, Zhou BO, Shimada IS, Zhao Z, Morrison SJ. 2016; Leptin receptor promotes adipogenesis and reduces osteogenesis by regulating mesenchymal stromal cells in adult bone marrow. Cell Stem Cell. 18:782–796. DOI: 10.1016/j.stem.2016.02.015. PMID: 27053299.
57. Aubin JE. 2001; Regulation of osteoblast formation and function. Rev Endocr Metab Disord. 2:81–94. DOI: 10.1023/A:1010011209064. PMID: 11704982.
58. Komori T. 2006; Regulation of osteoblast differentiation by transcription factors. J Cell Biochem. 99:1233–1239. DOI: 10.1002/jcb.20958. PMID: 16795049.
59. Matic I, Matthews BG, Wang X, Dyment NA, Worthley DL, Rowe DW, Grcevic D, Kalajzic I. 2016; Quiescent bone lining cells are a major source of osteoblasts during adulthood. Stem Cells. 34:2930–2942. DOI: 10.1002/stem.2474. PMID: 27507737. PMCID: PMC5450652.
60. Mikami Y, Yamamoto K, Akiyama Y, Kobayashi M, Watanabe E, Watanabe N, Asano M, Shimizu N, Komiyama K. 2015; Osteogenic gene transcription is regulated via gap junction-mediated cell-cell communication. Stem Cells Dev. 24:214–227. DOI: 10.1089/scd.2014.0060. PMID: 25137151. PMCID: PMC4291207.
61. Yang X, Yang J, Lei P, Wen T. 2019; LncRNA MALAT1 shuttled by bone marrow-derived mesenchymal stem cells-secreted exosomes alleviates osteoporosis through mediating micro-RNA-34c/SATB2 axis. Aging (Albany NY). 11:8777–8791. DOI: 10.18632/aging.102264. PMID: 31659145. PMCID: PMC6834402.
crossref

Fig. 1
Integration of transcriptome data of BMMSCs and osteoblasts. (A) UMAP visualization of the osteogenesis cells (n=8,841 cells) in distinct clusters. Each point was one cell, and colors indicated graph-based cluster assignments. BMMSCs1, BMMSCs2 and Osteoblast on the top right corner represented three different subjects. (B) Correlation of gene expression between two BMMSCs subjects. Each dot represented an individual gene. Axis measure the average gene expression level in the indicated subject (axis is log-scaled). Correlation was tested by Pearson correlation coefficient (R2=0.96, p<0.01). (C) Violin plots showed the log-transformed normalized expression levels of the most significant marker genes in each cluster. (D) Dot plot showed selected biological processes (BPs) in the GO analysis of clusters. X-axis, gene ratio; Y-axis, enriched BP terms in clusters; color (red, high; blue, low), -log10(p-adjusted) of each term.
ijsc-16-3-342-f1.tif
Fig. 2
Reconstruction of the developmental trajectory of BMMSCs and osteoblasts. (A) Cell differentiation pseudotime trajectory of osteogenesis clusters reconstructed with diffusion mapping. The trajectory graph on the upper right showed the direction of pseudotime from deep to shallow. (B) Distribution of each cell subpopulation along the pseudotime. (C) The expression levels (log-normalized) of key specific genes fluctuated with osteogenesis development. The x-axis indicated the pseudotime, while the y-axis represented the log-normalized gene expression levels. The colors corresponded to the six different osteogenesis cell subsets. (D) UMAP plots of osteogenesis cells, colored by expression of the indicated genes with roles in osteogenic differentiation.
ijsc-16-3-342-f2.tif
Fig. 3
GO terms and the expression of marker genes in six clusters. (A) Osteogenic differentiation and bone formation related GO terms enriched in six clusters. The size of dot indicated the gene ratio. The colors indicated the adjusted p-value for enrichment analysis. (B) The expression of several significant genes in each osteogenesis cell cluster.
ijsc-16-3-342-f3.tif
Fig. 4
Construction of cellular communication network. (A) Network plot showed the number of ligand-receptor interactions detected between each two cell clusters and/or within the same cell cluster. (B) The Circos diagram showed the top 30 highly expressed ligand-receptor pairs interactions in the 6 clusters. (C) The violin chart showed the expression of ligand and receptor genes in each cell cluster.
ijsc-16-3-342-f4.tif
Fig. 5
Protein-protein network interaction between mature osteoblasts and BMMSCs. (A) Mature osteoblasts cluster and BMMSC1 cluster were marked in oval and hexagon, respectively. (B) Subnets of FZD1, WIF1 and SFRP4. (C) Violin plots demonstrated the expression of FZD1, WIF1, and sFRP4 in each osteogenesis cluster. ns: not significant, *p-adjusted ≤0.05, ****p-adjusted ≤0.001. (D) Schematic representation of SFRP4 and WIF1 involved in the WNT signaling pathway.
ijsc-16-3-342-f5.tif
TOOLS
Similar articles