INTRODUCTION
METHODS
Materials
Cell cultures
Animal experiments
Real-time polymerase chain reaction
Western blot analysis
Histological analysis
Cell proliferation assay
Wound healing assay
Collagen gel contraction assay
L-lactate colorimetric assay kit
Triglyceride assays
Alanine transaminase activity assays
Glycolytic extracellular acidification rate analysis
Statistical analyses
RESULTS
Phloretin reduced the upregulation in fibrogenic markers expression, inhibited cell proliferation and increased apoptosis expression induced by succinate in HSCs
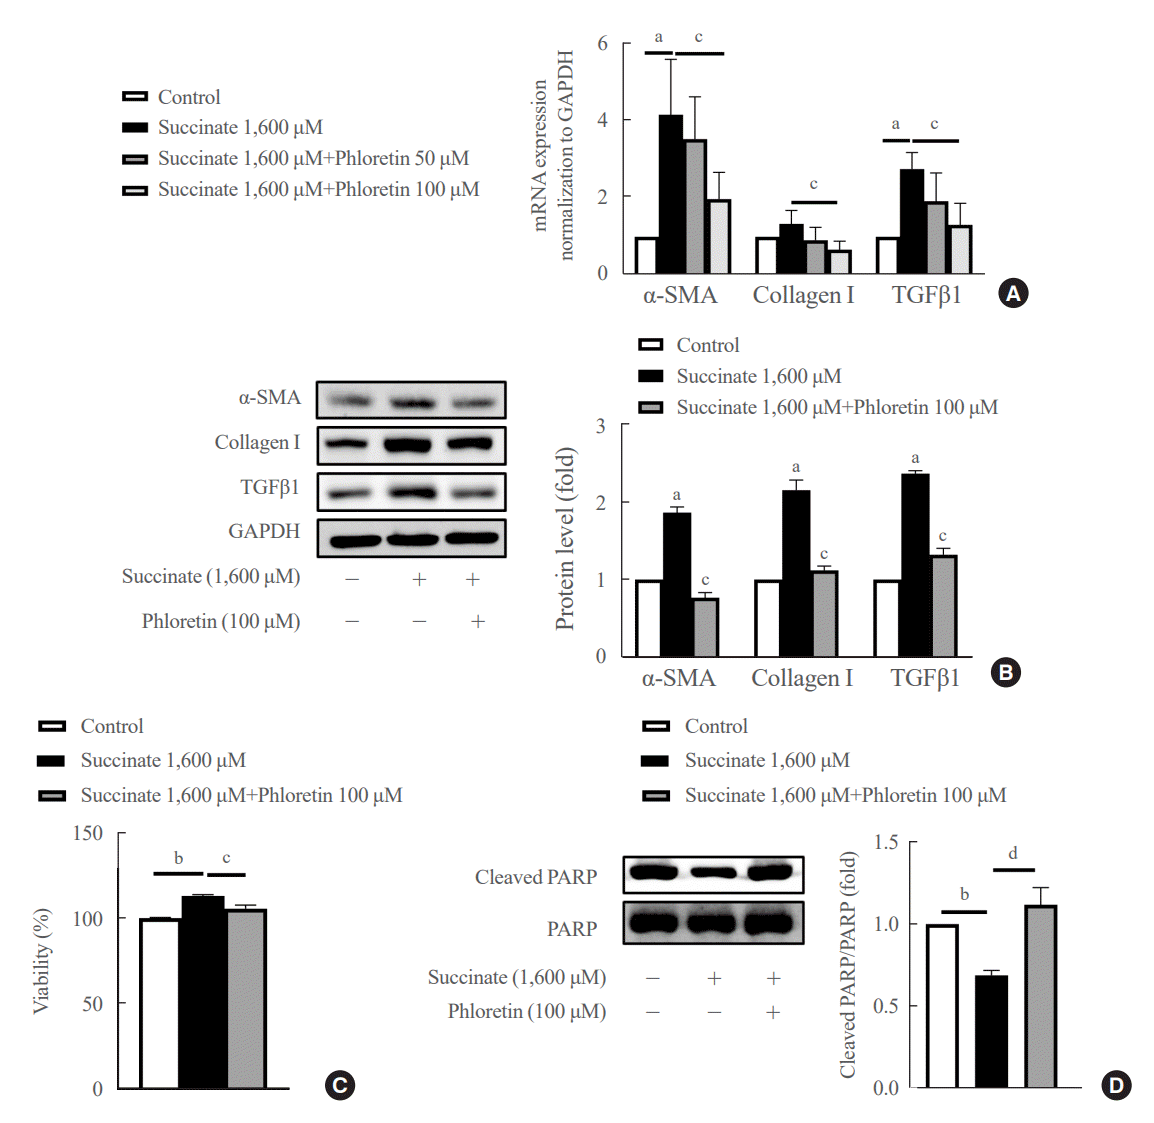 | Fig. 1.Phloretin reduced the upregulation in fibrogenic markers expression, inhibited cell proliferation and increased apoptosis of hepatic stellate cells (HSCs) induced by succinate in HSCs. LX-2 cells were treated with succinate (1,600 μM) and phloretin (50 or 100 μM) for 24 hours. (A) Real-time polymerase chain reaction to check mRNA expression of α-smooth muscle actin (α-SMA), collagen type I, transforming growth factor β1 (TGFβ1). (B) Western blot analysis of α-SMA, collagen type I, TGFβ1 were detected using specific antibodies. (C) Measure cell viability by 3-(4,5-dimethylthiazol-2-yl)-2,5-diphenyltetrazolium bromide (MTT) assessment and (D) Western blot analysis of cleaved poly-adenosine diphosphate-ribose polymerase (PARP), and PARP. Analysis of densitometry was performed and present data as the mean±standard error values of three independent experiments. GAPDH, glyceraldehyde-3-phosphate dehydrogenase. Statistical significance: aP<0.05, bP<0.001 vs. the control group; cP<0.05, dP<0.01 vs. succinate. |
Phloretin inhibited succinate-induced migration and contraction of HSCs
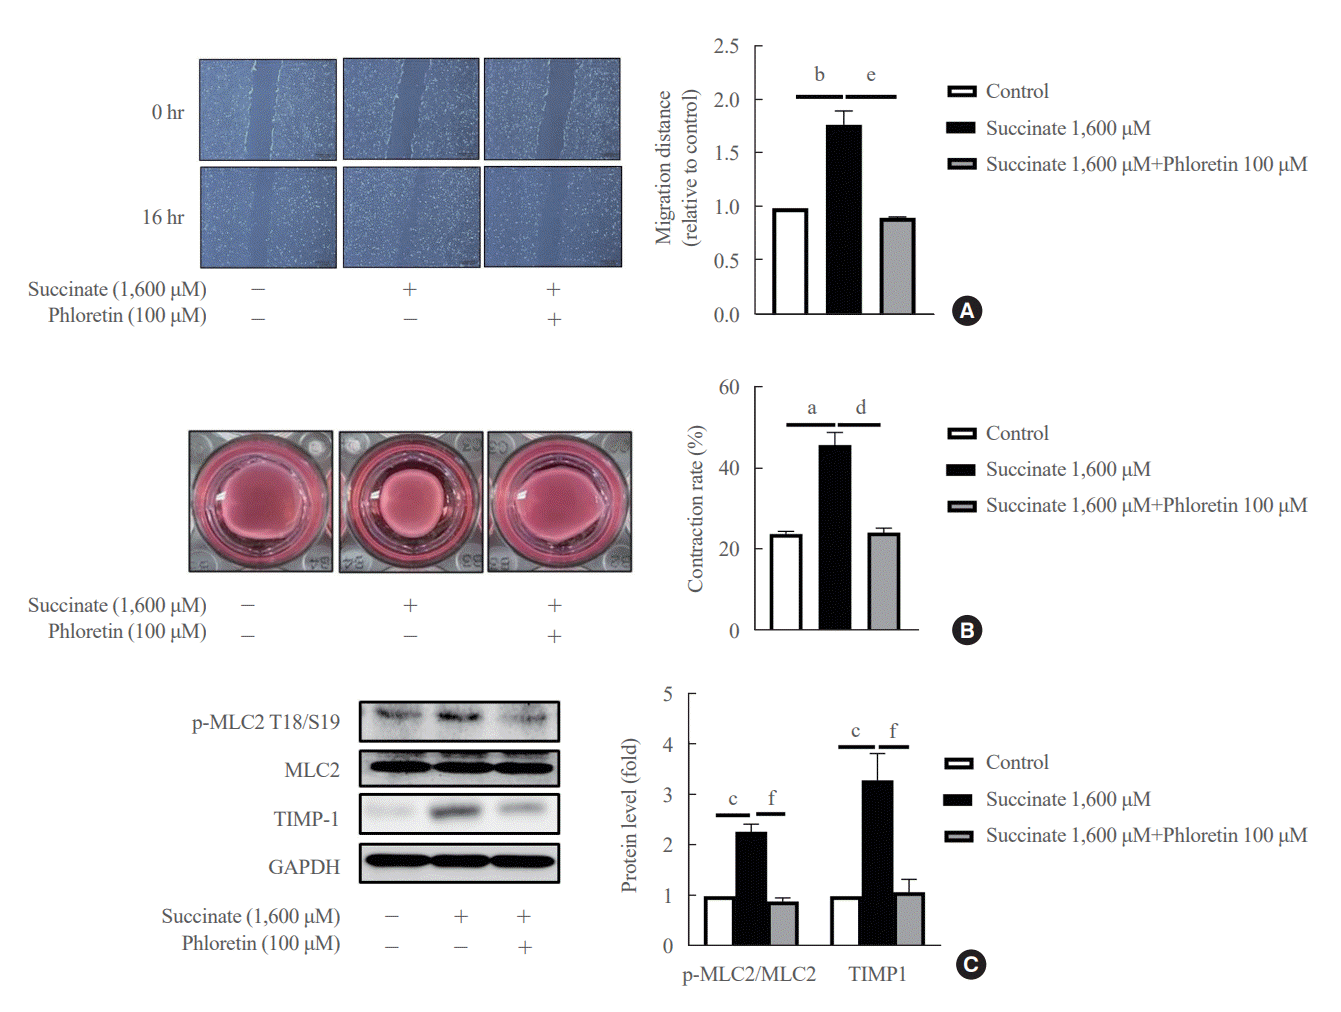 | Fig. 2.Phloretin inhibited succinate-induced migration of hepatic stellate cells (HSCs). LX-2 cells were exposure with succinate (1,600 μM) for 16 hours and phloretin (100 μM) before measure distance of migration by microscopy with 4× of magnification. (A) LX-2 cells were treated with succinate (1,600 μM) and phloretin (100 μM) for 16 hours. (B) LX-2 cells were treated with succinate (1,600 μM) and phloretin (100 μM) for 24 hours and measure collagen gel area. (C) Western blot analysis of tissue inhibitor of metalloproteases 1 (TIMP-1), phosphorylation myosin light chain 2 (p-MLC2), and MLC2 were detected using specific antibodies. Analysis of densitometry was performed and present data as the mean mean±standard error values of three independent experiments. GAPDH, glyceraldehyde-3-phosphate dehydrogenase. Statistical significance: aP<0.05, bP<0.01, and cP<0.001 vs. the control group; dP<0.05, eP<0.01, and fP<0.001 vs. succinate. |
Phloretin reduced succinate-induced aerobic glycolysis in activated HSCs
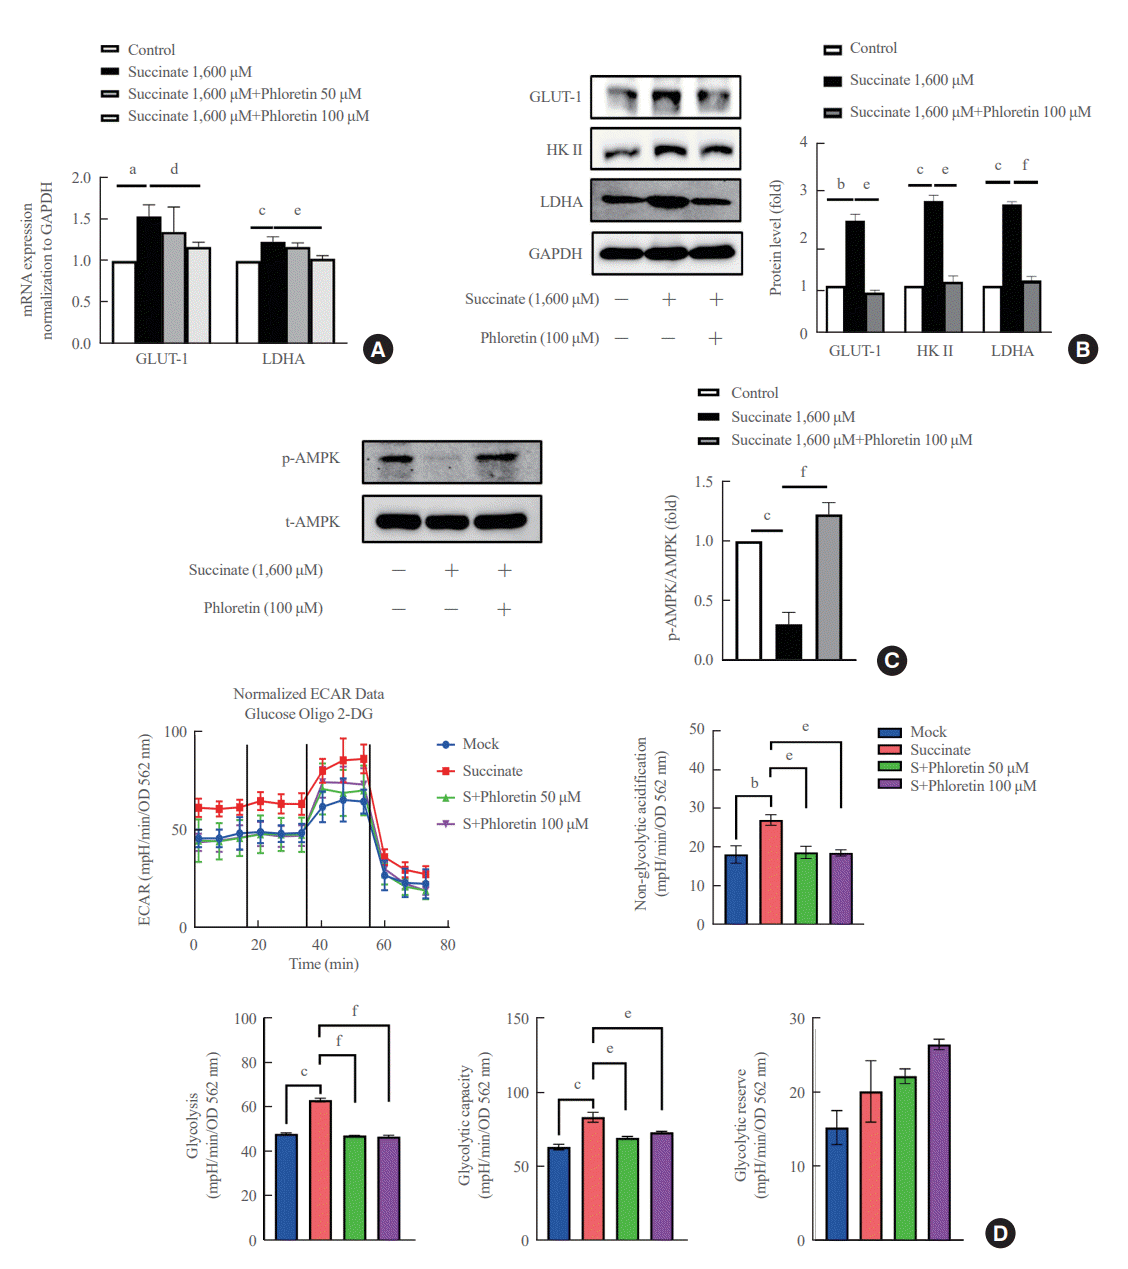 | Fig. 3.Phloretin reduced succinate-induced aerobic glycolysis in activated hepatic stellate cells (HSCs). LX-2 cells were treated with succinate (1,600 μM) and phloretin (50 or 100 μM) for 24 hours. (A) Real-time polymerase chain reaction to check mRNA expression of glucose transporter 1 (GLUT-1) and lactate dehydrogenase (LDH). (B) Western blot analysis of GLUT-1, hexokinase II (HK II), and lactate dehydrogenase A (LDHA) were detected using specific antibodies. (C) Western blot analysis of phosphorylated adenosine monophosphate protein kinase α (p-AMPKα) and AMPKα were detected using specific antibodies. (D) Seahorse analysis of extracellular acidification rate (ECAR), and glycolysis, glycolytic capacity and glycolytic reserve with succinate and phloretin (50 or 100 μM). Analysis of densitometry was performed and present data as the mean±standard error values of three independent experiments. GAPDH, glyceraldehyde-3-phosphate dehydrogenase; OD, optical density; 2-DG, 2-deoxy-D-glucose. Statistical significance: aP<0.05, bP<0.01, and cP<0.001 vs. the control group; dP<0.05, eP<0.01, and fP<0.001 vs. succinate. |
Phloretin administration improved liver fibrosis induced by a sodium succinate diet in mice
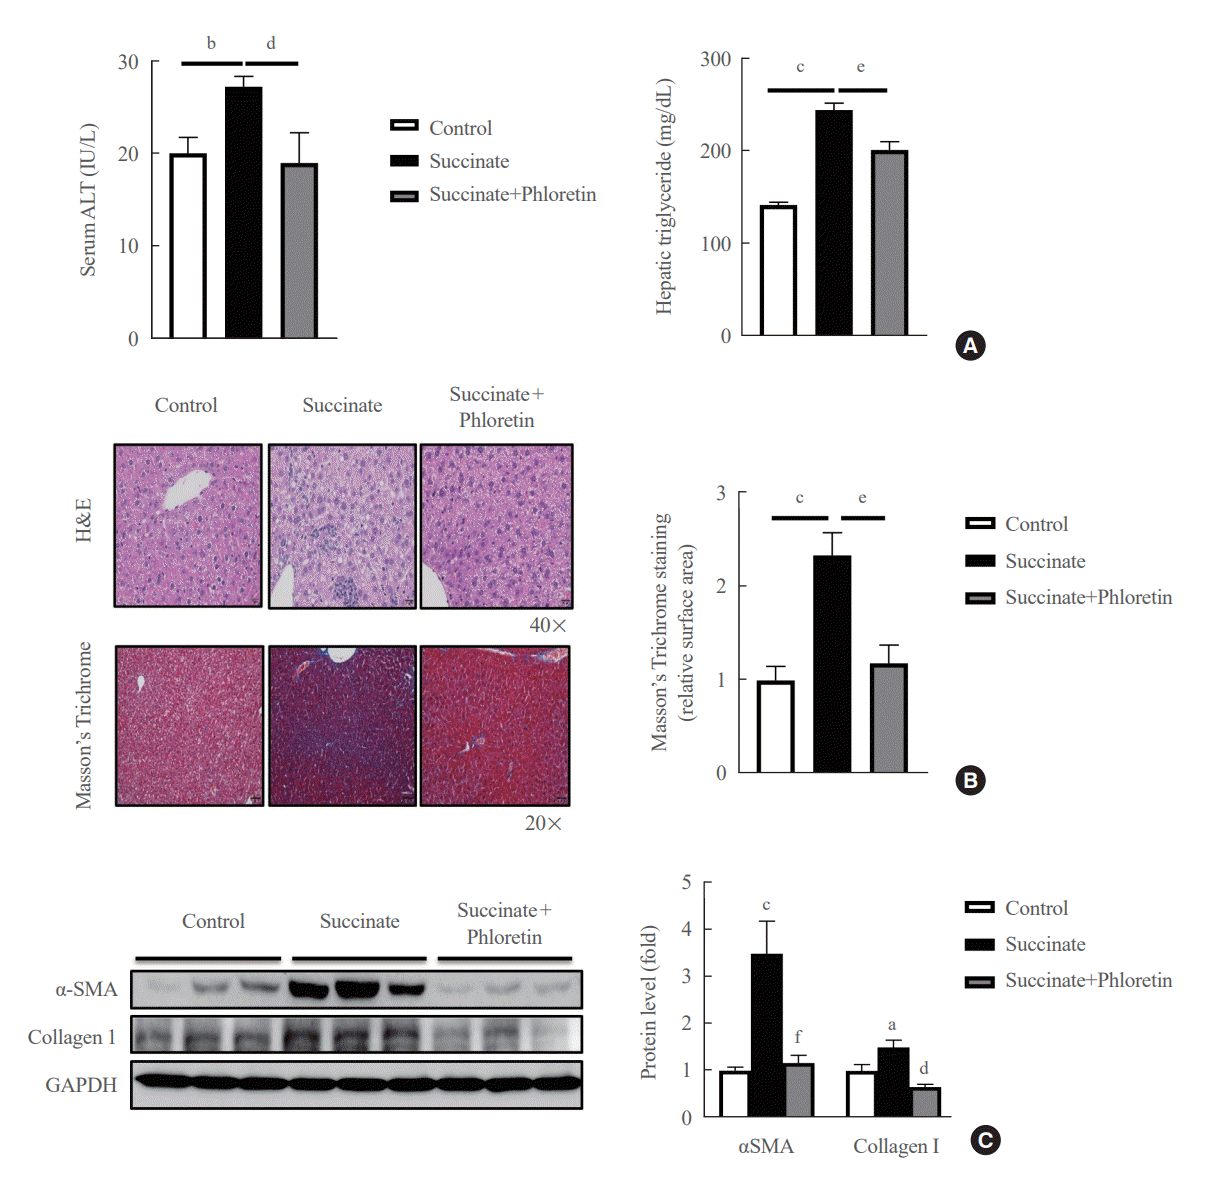 | Fig. 4.Phloretin administration improved liver fibrosis induced by a sodium succinate diet in mice. (A) Serum alanine transaminase (ALT) levels and hepatic triglyceride levels. (B) Hematoxylin and eosin (H&E) stain and Masson’s trichrome stain show the effect of phloretin intraperitoneal (10 mg/kg every other day) on sodium succinate 2% containing diet-induced liver fibrosis in mice. H&E staining 40×, Masson’s Trichrome 20×. (C) Liver from control group, sodium succinate 2% containing diet-feeding mice, and intraperitoneal phloretin group (10 mg/kg every other day) were used to analyze expression of α-smooth muscle actin (α-SMA) by Western blot. Analysis of densitometry was performed and present data as the mean±standard error values of three independent experiments. GAPDH, glyceraldehyde-3-phosphate dehydrogenase. Statistical significance: aP<0.05, bP<0.01, and cP<0.001 vs. the control group; dP<0.05, eP<0.01, and fP<0.001 vs. the succinate group. |
Administration of phloretin decreased expression of glycolytic markers in the livers of mice with sodium succinate diet-induced liver fibrosis
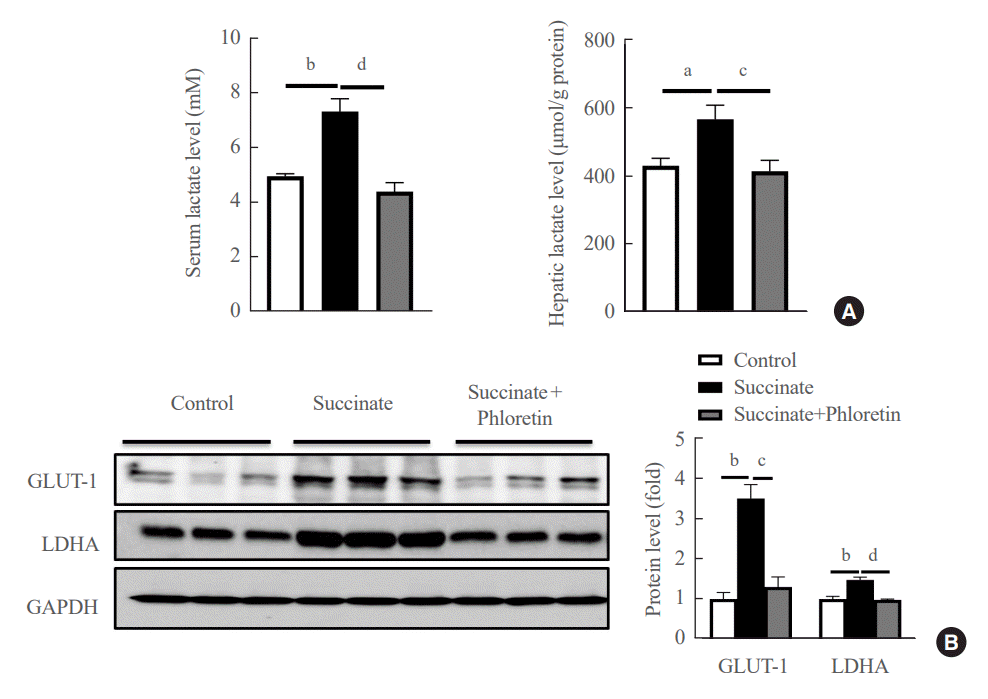 | Fig. 5.Administration of phloretin decreased glycolytic markers in the livers of mice with sodium succinate diet-induced liver fibrosis. (A) Hepatic lactate levels and serum lactate levels. (B) Liver from control group, sodium succinate 2% containing diet-feeding mice, and intraperitoneal phloretin group (10 mg/kg every other day) were used to analyze expression of glucose transporter 1 (GLUT-1), lactate dehydrogenase A (LDHA) by Western blot. Analysis of densitometry was performed and present data as the mean±standard error values of three independent experiments. GAPDH, glyceraldehyde-3-phosphate dehydrogenase. Statistical significance: aP<0.05, bP<0.01 vs. the control group; cP<0.05, dP<0.01 vs. the succinate group. |


 PDF
PDF Citation
 Print
Print


 XML Download