

 PDF
PDF Citation
 Print
Print


INTRODUCTION
Assessment of myocardial ischemia is an essential step in the treatment of coronary artery disease.12 Fractional flow reserve (FFR)-guided coronary revascularization has shown improved clinical outcomes.34 However, calculating using intracoronary pressure measurement, FFR is, by nature, complementary to invasive coronary angiography (ICA).
Recent technological advances have enabled the calculation of FFRs from computed tomography (CT) images (FFRCT).56 FFRCT has shown to improve diagnostic performance in patients with moderate coronary stenosis.789 In addition, the use of FFRCT in clinical practice has shown a reduction in unnecessary ICA, favorable clinical outcomes, and higher cost-effectiveness than usual care.10111213
The main limitation of the currently available FFRCT technology is the requirement for high-performance computational power. CT images need to be sent to the vendor, and the analyses are returned in several hours to days, which hampers the widespread use of FFRCT. Recently, a novel, simpler simulation method for predicting FFR with coronary CT angiography (CCTA) has been developed that can be performed in on-site computers.1415 Potential advantages include reduced clinical decision time, less concern about privacy issues, and lower costs. A retrospective study demonstrated the acceptable diagnostic performance of the algorithm.16
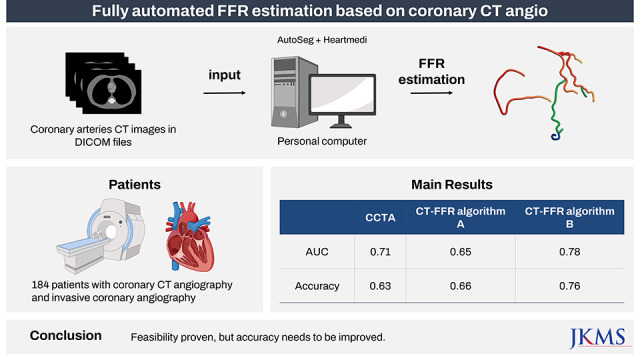
Here, we report the results of a prospective trial designed to validate the diagnostic performance of CT-based FFR (CT-FFR). CT-FFR was compared with anatomical analysis from CCTA to detect functionally significant lesions assessed using invasive FFR.
METHODS
Study purpose and design
This study was a prospective, multicenter, comparative, and confirmatory trial. The primary objective was to assess the diagnostic performance of CT-FFR based on routinely acquired CCTA (HeartMedi 1.0; AiMedic, Seoul, Korea) in patients with coronary artery disease. This study conformed to the protocol and principles established in the latest version of the Declaration of Helsinki (revised version 2013). The study design has been published elsewhere.17
Study population and process
Patients with coronary artery disease who had undergone CCTA within 90 days and non-emergency ICA and invasive FFR were eligible for the trial. Patients who provided informed consent were enrolled in this study. The inclusion and exclusion criteria are listed in Supplementary Table 1. The 12 participating centers and investigators are listed in Supplementary Table 2.
All study images were anonymized and handled by a principal investigator. Blinding was maintained between the CCTA core lab, ICA core lab, and the manufacturer throughout the data transfer process. CCTA images were obtained with ≥ 64 multidetector slices and a row width of ≤ 0.75 mm. The images were sent to an independent CCTA core laboratory (Seoul National University Bundang Hospital), where the lesion severity was quantified by two independent, blinded radiologists. The degree of stenosis was measured according to the guidelines of the Society of Cardiovascular Computed Tomography.18
ICA and invasive FFR procedures were performed in accordance with the American College of Cardiology/American Heart Association guidelines for coronary angiography and intervention.19 Invasive FFR was measured using a sensor-tipped 0.014-inch guidewire (PressureWire; St. Jude Medical, St. Paul, MN or Verrata wire; Philips, Eindhoven, the Netherlands). Coronary pressure wire was located distal to the lesion, and hyperemia was induced by intravenous infusion of adenosine at a dose of 140 μg/kg/min. The anonymized ICA images and FFR raw data were sent to the core laboratory (Seoul National University Hospital). Quantitative angiographic analysis was performed by an experienced technician. The FFR measurements were validated, confirming the absence of potential bias, such as the achievement of maximum hyperemia or pressure drift.
Segmented and reconstructed CCTA images were built using the CCTA core lab. The location of the invasive FFR measurement was indicated on the reconstructed CCTA by the ICA core lab. Next, the image was transferred to the manufacturer (AiMedic) by the central study coordinator while blinding the invasive FFR value. CT-FFR was calculated using HeartMedi software, according to the manufacturer’s instructions.
Study hypothesis and sample size calculation
The primary measure of performance was the area under the receiver operating characteristic curve (AUC) for detecting hemodynamically significant stenosis. The gold standard for significant stenosis was defined as an invasive FFR ≤ 0.80. We hypothesized that CT-FFR would show a higher AUC than CCTA. The AUC of CT-FFR and CCTA were assumed to be 0.90 and 0.81, respectively, with reference to previous studies.71620 The assumptions included a 31.5% prevalence of hemodynamically significant stenosis, a correlation coefficient of 0.6, and an attrition rate of 15%.7212223 To ensure a statistical power of 80% and a one-sided significance level of 0.025, a sample size of 184 was required.
Statistical analysis
The independent statistical core laboratory performed statistical analysis after trial completion. For the primary efficacy measure, the AUC of CT-FFR was compared with that of the percentage of stenosis from CCTA. Delong’s test was used to compare the two correlated AUCs.24 A Bland–Altman plot was used to visualize the agreement between CT-FFR and invasive FFR.25 Secondary efficacy measures included diagnostic accuracy, sensitivity, specificity, positive predictive value (PPV), negative predictive value (NPV), and the correlation coefficient. The cutoff for significant obstruction on CCTA was defined as stenosis diameter ≥ 50%. The cutoff values for CT-FFR and invasive FFR were ≤ 0.8. Correlation was assessed using Pearson’s correlation coefficient (r) and P value.
The initial algorithm (algorithm A) analysis was completed in July 2021. As shown below, the results did not meet the predefined superiority criteria. After the initial results were disclosed to the sponsor, the researchers and sponsor agreed to perform an additional exploratory analysis using an improved version of the algorithm for future hypothesis generation (algorithm B). The difference between these two algorithms is due to the fully automatic segmentation method (further described in the discussion section). The analysis of algorithm B was completed in August 2021. In this article, we presented both the results of the initially planned analysis of algorithm A and the unplanned exploratory analysis of algorithm B.
Ethics statement
The study protocol was approved by the ethics committee of each participating center, and informed consent was obtained from all enrolled patients. The trial was registered with the Clinical Research Information Service (ID: KCT0002725) (Korea Centers for Disease Control and Prevention, Ministry of Health and Welfare, Osong, Chungcheongbuk-do, Republic of Korea).
RESULTS
Study flow and baseline characteristics
Of the 184 patients who agreed to participate in this study, 33 patients were excluded because of unqualified FFR (n = 9), protocol violation (n = 8), poor CCTA quality (n = 2), and other unexpected causes (n = 14). Finally, 151 participants were included in the analysis.
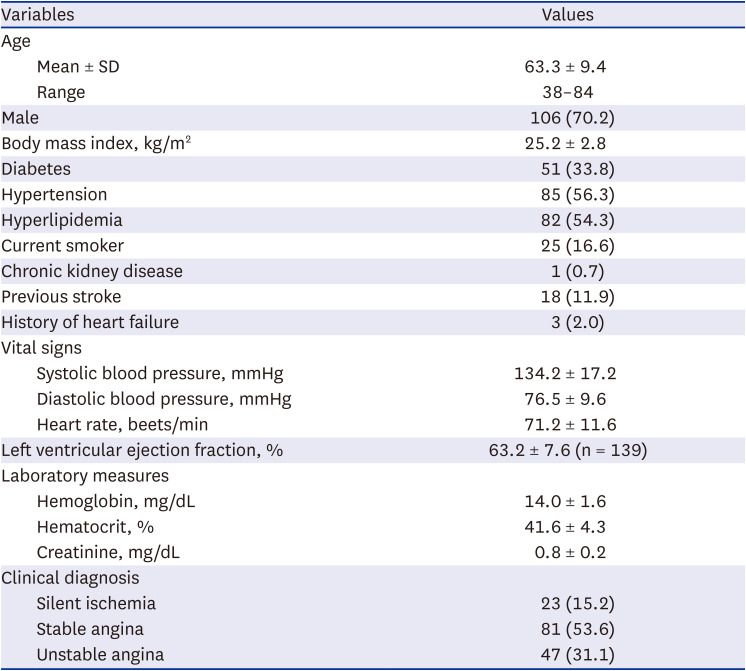
The mean age was 63.3 years, and 70% were men (Table 1). The prevalence rates of hypertension, diabetes and cigarette smoking were 56%, 34%, and 17%, respectively. Although acute myocardial infarction was excluded from the study protocol, 69% of the study participants had silent ischemia or stable coronary disease.
Table 1
Baseline characteristics of enrolled patients
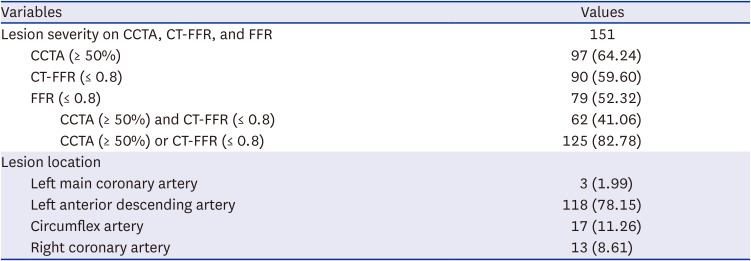
All participants had CCTA images taken within 90 days, and the average stenosis diameter of the target lesions was estimated to be 55.9% (Table 2). ICA revealed that the average diameter of the stenosis was 61%. The target lesion locations were as follows: the left anterior descending artery (78.2%), the circumflex artery (11.3%), the right coronary artery (8.6%), and the left main coronary artery (2%) (Table 3). The mean invasive FFR was 0.79, and 79 (52.3%) patients had a hemodynamically significant lesion. The mean estimated CT-FFR was 0.81. The distributions of invasive FFR, CT-FFR and CCTA diameter stenosis are shown in Supplementary Fig. 1.
Table 2
Details of CCTA, coronary angiography, and FFR
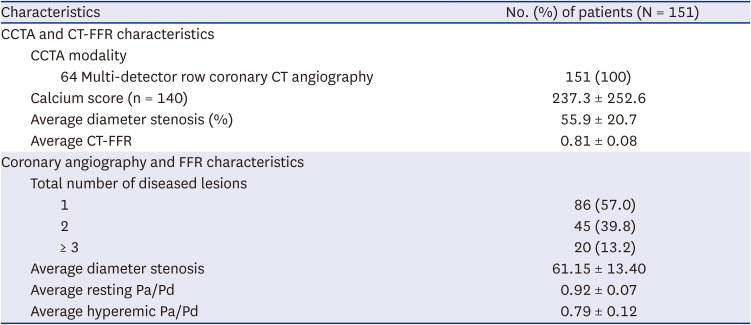
Table 3
Lesion characteristics of per-patient analysis
Results for study endpoints: algorithm A
For the main per-patient analysis, one index lesion was chosen for each patient, and 151 lesions were included in the analysis. The invasive FFR was ≤ 0.80 in 79 lesions (52.3%), CCTA diameter stenosis was ≥ 50% in 97 lesions (64.2%), and CT-FFR was ≤ 0.80 in 90 lesions (59.6%).
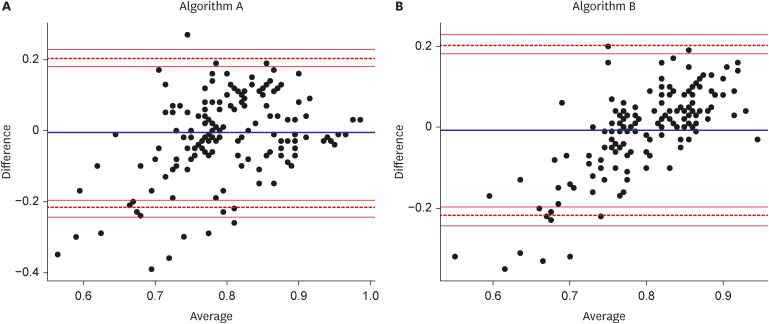
The AUC to detect hemodynamically significant stenosis, defined as invasive FFR ≤ 0.80, was 0.71 (95% confidence intervals [CIs], 0.63–0.80) for CCTA and 0.65 (95% CI, 0.56–0.74) for CT-FFR, respectively (Fig. 1A). These results did not meet the primary efficacy hypothesis that CT-FFR is superior to CCTA (P = 0.866). The diagnostic accuracy, sensitivity, specificity, PPV, and NPV for CCTA and CT-FFR are presented in Table 4. Combining two values of CCTA ≥ 50% and CT-FFR ≤ 0.8 did not remarkably improve accuracy. The scatter plots of CCTA and CT-FFR versus invasive FFR are presented in Supplementary Fig. 2 (R = 0.365, P < 0.001 for CCTA and FFR; R = 0.285, P < 0.001 for CT-FFR and FFR). Bland–Altman plots for the difference between the estimated CT-FFR and the observed invasive FFR are shown in Fig. 2A.
Fig. 1
AUC of CT-FFR and CCTA. AUC of CT-FFR (red) and CCTA stenosis diameter (blue) for detecting hemodynamically significant lesion defined by invasive FFR ≤ 0.80. (A) Algorithm A, (B) Algorithm B.
AUC = area under the receiver operating characteristic curve, CT-FFR = computed tomography-based fractional flow reserve, CCTA = coronary computed tomography angiography, FFR = fractional flow reserve.
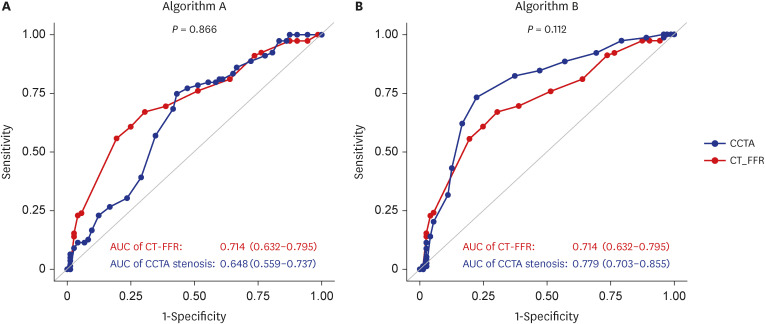
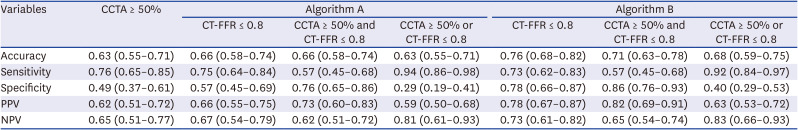
Table 4
Diagnostic performance of CCTA and CT-FFR
Results for algorithm B
After the initial analysis, we allowed the algorithm to be improved while maintaining blinding to the invasive FFR results. The manufacturer made amendments for more accurate segmentation and hemodynamic bifurcation calculations. The analysis was performed with the same statistical frame using the CT-FFR results from algorithm B. This set of analyses is unplanned and should be considered exploratory for future hypotheses generation.
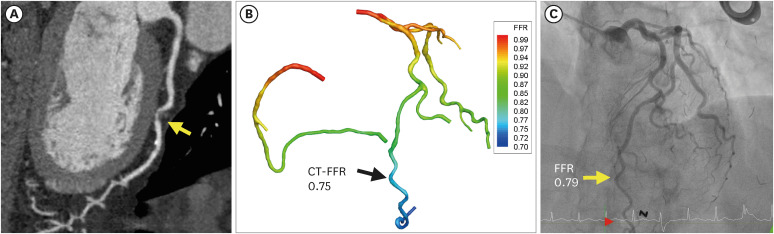
The AUC for detecting hemodynamically significant stenosis, defined as invasive FFR ≤ 0.80, was 0.78 (95% CI, 0.70–0.86) for CT-FFR (Fig. 1B). This was numerically higher than that for CCTA; however, the difference was not statistically significant (P = 0.112). The diagnostic accuracy also increased to 76%, largely due to the improved specificity (Table 4). The Pearson’s correlation coefficient between the invasive FFR and CT-FFR was 0.402 (P < 0.001). The Bland–Altman plot showed that CT-FFR tended to underestimate hemodynamic significance for severe lesions (lower CT-FFR compared to invasive FFR) (Fig. 2B). A representative case is shown in Fig. 3.
DISCUSSION
This study demonstrated the feasibility of fully automated on-site CT-FFR estimation. While the results from Algorithm A were disappointing, the improved version of Algorithm B showed promising results. The receiver operating characteristic curve suggested superior discrimination of CT-FFR over CCTA. The diagnostic accuracy of CT-FFR was higher than that of CCTA.
FFR-guided coronary revascularization is currently considered the standard of care.12 FFRCT enables noninvasive functional assessment based on the anatomical analysis of CCTA. Current guidelines suggest that FFRCT can be useful for the diagnosis of vessel-specific ischemia and guide decision-making regarding the use of coronary revascularization.12 The currently available FFRCT simulates computational fluid dynamics of the aorta and coronary arteries using lumped parameter models. The prospective multicenter Diagnosis of Ischemia-causing Stenoses Obtained Via Noninvasive Fractional flow Reserve (DISCOVER-FLOW) study was the first investigation to show that noninvasive FFR derived from CCTA shows high diagnostic performance for the detection and exclusion of coronary lesions that cause ischemia.8 FFRCT of 158 vessels from 103 patients showed a per-vessel sensitivity of 87.9%, a specificity of 82.2%, and an accuracy of 84.3% compared to invasive FFR. The Determination of Fractional Flow Reserve by Anatomic CT Angiography (DeFACTO) trial was the second multicenter investigation that included a larger patient population consisting of 252 patients with 407 vessels from 17 centers.9 The trial demonstrated that use of noninvasive FFRCT plus CCTA improved diagnostic accuracy and discrimination compared to CCTA alone for the diagnosis of hemodynamically significant coronary disease. The Analysis of Coronary Blood Flow Using CT Angiography: Next Steps (NXT) trial paid special attention to acquisition of high-quality CT images.7 In addition, technical refinements of the FFRCT algorithm were adopted. The NXT trial showed high diagnostic performance: AUC for FFRCT was 0.90 compared to 0.81 for CCTA. However, this calculation requires high-throughput computational power, which is not readily available at clinical sites. The need for data transfer, delay in the analysis, and high cost, all lead to the low penetration of this technology into clinical practice.
This study proposes the feasibility of an on-site CT-FFR. The analysis can be run on consumer-grade workstations, which takes approximately an hour. The beauty lies in the automated segmentation and simulation processes. Human intervention was not required throughout this process. However, this study also demonstrated that higher diagnostic performance should be achieved for the algorithm to be implemented in clinical practice. The AUC of CT-FFR algorithm B was numerically higher than that of CCTA; however, the difference was smaller than expected and failed to reject the null hypothesis. The observed AUCs (0.71 and 0.78 for CCTA and CT-FFR, respectively) were lower than the study assumptions (0.81 and 0.90, respectively). However, in the DeFACTO trial, where the AUCs were comparable to ours (0.68 and 0.81 for CCTA and FFRCT, respectively), the difference was statistically significant.9
Current technology aims at automated on-site CT-FFR calculations with minimal human intervention. The key to achieving this goal is full automation of vessel segmentation and computational fluid dynamics calculations. The automated segmentation method in algorithm A generated unrealistic vascular length in some minor branches when CT image quality was not good. To overcome this limitation, algorithm B used a common standard length for minor branches. Algorithm B, which intentionally added resistance at the small-vessel bifurcation, was shown to have higher accuracy than algorithm A. We speculate that further advances in machine learning techniques and hemodynamic calculations would enable a fully automated on-site CT-FFR.
The values observed in this study differed from the study’s assumptions. The dropout rate of 18% was higher than the expected rate of 15%. However, the final sample size of 151 was comparable to that of previous studies.78 In addition, the prevalence of FFR ≤ 0.8 was higher than expected (52.3% and 31.5%, respectively). The accuracy of CT-derived FFR algorithm should depend on CCTA image quality. However, CCTA acquisition protocol was not controlled in this study, which may have had a deleterious effect on the algorithm’s accuracy. Finally, CT-FFR was calculated by the manufacturer, whereas the product was developed for on-site use cases. This was intended to minimize bias by blinding investigators who performed reference measurements (invasive FFR) to the study values (CT-FFR). Future studies should consider these factors.
We investigated the diagnostic performance of a novel CT-FFR algorithm in identifying ischemia-causing lesions. Its diagnostic accuracy was numerically greater than that of CCTA alone but did not meet the priori hypothesis. This study suggests the feasibility of automated on-site CT-FFR, which can be performed within hours. The algorithm needs to be improved for clinical use, and future studies are required to confirm its performance.
 XML Download