

 PDF
PDF Citation
 Print
Print


INTRODUCTION
Catecholamines consisting of epinephrine (EP), norepinephrine (NE), and dopamine (DA) are known as a class of chemical neurotransmitters and hormones essential for regulation of physiological processes including stress responses.1 Most of catecholamine studies are focused on temperature-related deaths since they are difficult to diagnose and closely related to agonal constant stress response. Hirvonen2 has reported that EP and NE are elevated in urine and blood samples in hypothermia fatalities. Subsequent studies have revealed consistent results of elevated catecholamines in urine but not in blood.3456789 According to those previous research results, EP is regarded as a more useful marker than NE, with an increase of urine EP/NE being the most reliable marker for the diagnosis of hypothermia.
In terms of agony time, Berg and Bonte10 have classified agonal stage into missing agony, short agony, and protracted agony and reported that blood catecholamine levels are increased over agonal period. Several studies about postmortem changes of catecholamine levels according to agonal time have been published, showing similar results.1112 However, Tormey et al.13 and Wilke et al.14 have shown no relationship between agony time and catecholamine level.
Not many studies have been published on the connection between catecholamine level and various causes of death. Berg1516 has proven obvious relations between blood EP levels and certain causes of death. However, other studies could not verify such relationships.1417 In the 2000’s, a series of study by Japanese researchers reported changes of postmortem catecholamine levels in sera, pericardial fluids, cerebrospinal fluids, and urine samples according to the cause of death.181920 They found that catecholamine fractions in sera and pericardial & cerebrospinal fluids were increased in those with certain causes of death and that urine catecholamine profiles might be useful for differentiating temperature-related death from some particular causes of death.
On this wise, a considerable number of studies have been performed to investigate relationships of postmortem catecholamine levels with agony time and underlying cause of death. However, they produced conflicting results. Up to date, there is no systematic research on postmortem catecholamine levels in Korea. Thus, the purpose of this study was to determine distribution characteristics of postmortem catecholamine levels with various influencing factors and to investigate relationships of postmortem catecholamine levels with agony time and cause of death.
Go to : 
METHODS
Subjects
All data were collected from 114 forensic autopsy cases performed from November 2020 to October 2021. Catecholamines are mainly synthesized in sympathetic nerve endings and adrenal medulla. After synthesis, they are secreted into the blood, metabolized in the kidneys, and excreted through urine. Blood distribution of catecholamines can show a marked difference between peripheral and cardiac blood according to previous studies.1418 Therefore, samples were collected from femoral vein, heart, and urine. Analyses of EP, NE, and DA levels in femoral venous blood, heart blood, and urine samples were performed with EP/NE ratio calculated for each sample. For sex variable, male or female was defined by biological features. One male-to-female transgender was classified as a male. To determine differences among young-aged, middle-aged, and old-aged groups, cases were divided into three age groups: ≤ 30 years, 30–70 years, and > 70 years. Postmortem interval (PMI) defined as the time elapsed since death until the point of sample collection was estimated primarily based on results of postmortem inspection at the scene or medical record, which was marked with a median value of estimated period. According to PMI, cases were divided into three groups: ≤ 24 hours, 24–48 hours, and > 48 hours. Regarding agony time, the specific period of time until death was estimated preferentially based on the investigation record including witness testimony, video materials, and other circumferential evidences. For unclear cases, the agony time was estimated referring to the investigation record, results of autopsy and cause or mode of death. A short agony group was defined as a death within a few seconds to a few minutes, including a fall from height, traffic accident, acute myocardial infarction, aortic dissection, and aneurysmal rupture. A long agony group was defined as a death within a few minutes to hours, e.g., head injury, drug intoxication, hanging, fire death, and sudden cardiac death. Medical records were reviewed in order to confirm medical treatments related to cardiopulmonary resuscitation (CPR) and EP injection.
Classification of the manner of death and the cause of death
According to the manner of death, cases were divided into suicidal and non-suicidal groups to verify the hypothesis that catecholamine levels might be elevated in the suicidal group due to increased agonal stress. According to the cause of death, cases were classified into six major categories: natural death, injury, intoxication, asphyxia, drowning, and fire death. Natural death was subclassified into five minor categories: acute myocardial infarction, ischemic heart disease, sudden cardiac death, cerebrovascular disease, and miscellaneous group which included pulmonary thromboembolism, aortic dissection, and gastrointestinal bleeding. Injury was subclassified into two minor categories: head injury and non-head injury. Intoxication was subclassified into four minor categories: drug intoxication, narcotics intoxication, acute alcoholic intoxication, and chronic alcoholic intoxication. Asphyxia was subclassified into three minor categories: strangulation by ligature, suffocation, and choking. There was only one case of hypothermia, which was excluded to have an accurate statistical analysis.
Sample analysis procedure
Levels of catecholamines (EP, NE, and DA) in blood plasma and urine samples were measured using high performance liquid chromatography (HPLC). For obtaining blood plasma, about 10 mL of femoral venous blood and heart blood samples were collected into ethylenediaminetetraacetic acid tubes and centrifuged for 10 minutes at 4,000 rpm. More than 10 mL of urine was collected from the incised bladder and stored in urine tube treated with hydrochloric acid as a preservative. For measuring urine creatinine, about 1 mL of urine was collected separately in a preservative-free urine tube. All samples were sent to the laboratory in a few hours after storage in a refrigerator of the autopsy room. Since blood catecholamine levels in most samples exceeded the detection limit of the assay (20–2,000 pg/mL), blood samples were diluted 100-fold before measurement.
Interpretation of catecholamine levels in postmortem urine samples is a complex problem because of potential confusing factors in catecholamine secretion relevant to diurnal rhythm, period of stress, and influence factors of urinary dilution. Sadler and Pounder21 have reported that daily urinary excretion can be predicted by relating urine catecholamine to concomitant creatinine excretion since normal daily excretion of creatinine remains constant in human body. This method was applied in the present study. All values of urine catecholamine were corrected with urine creatinine. Urine creatinine was determined by a colorimetric assay.
Statistical analysis
A nonparametric analysis was used since most data showed a non-normal distribution. For descriptive statistics, both mean ± standard deviation (SD) and median and range were used. Correlations of urine catecholamine levels with blood catecholamine levels and correlations of catecholamine levels with age or PMI were calculated using Spearman’s rank correlation coefficient. A simple linear regression analysis was used for detecting correlations of catecholamine levels with age and PMI, which were continuous variables. For comparison among groups, Wilcoxon rank sum test and Kruskal-Wallis test were used. To determine any differences among catecholamine levels of major and minor categories in the cause of death, a multiple comparison analysis with Bonferroni correction was used. A Wilcoxon signed rank test was used to compare between EP/NE ratio and 1. P value < 0.05 was considered significant. All statistical analyses were performed using SAS software version 9.4 (SAS Institute, Cary, NC, USA).
Ethics statement
The present study protocol was reviewed and approved by the Institutional Review Board (IRB) of College of Medicine, The Catholic University of Korea (approval No. MC20TISI0100). The requirement for informed consent was waived by the IRB.
Go to :
RESULTS
Demographic and clinical characteristics
There were a total of 114 subjects, including 89 (78.1%) males and 25 (21.9%) females. The median age was 54.50 years (range, 15 to 94 years). The median PMI was 40.5 hours (range, 17.75 to 131 hours). The short agony group had 34 (29.8%) subjects and the long agony group had 80 (70.2%) subjects. Sixty-four (56.1%) subjects underwent CPR. Thirty-eight (33.3%) subjects were administered EP in a hospital. Twenty-one (18.4%) subjects were considered to be suicidal death. General characteristics of subjects are summarized in Table 1.
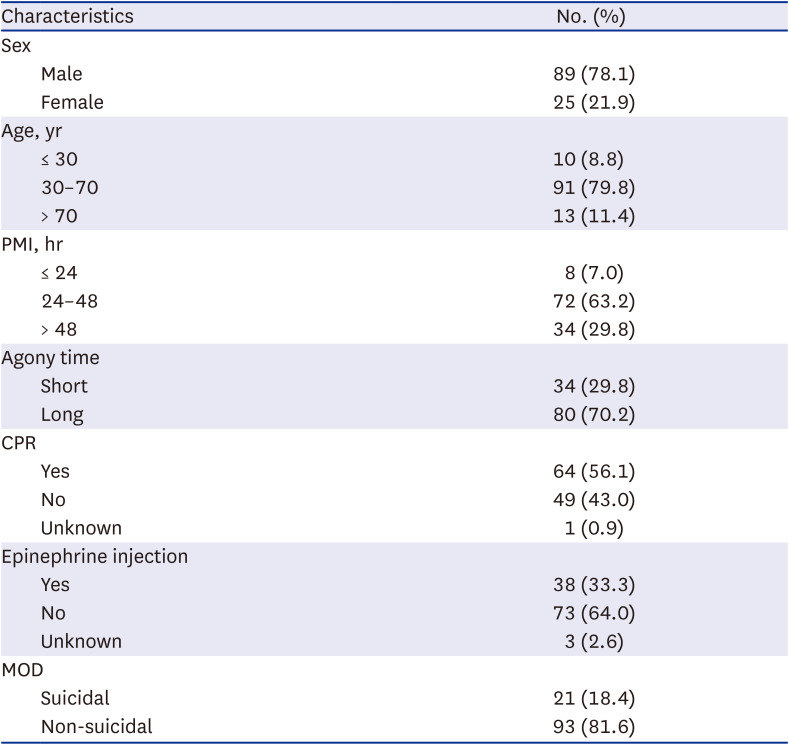
Table 1
Demographic and clinical characteristics of 114 subjects
![]()
Distribution of catecholamine levels and mutual correlations
Overall values of femoral and heart blood catecholamine levels showed wide fluctuations. Femoral blood catecholamine levels (EP, 130,548.00 [1,348.00–476,325.00] pg/mL [median and range]; NE, 98,155.00 [6,590.00–347,606.00] pg/mL; DA, 7,055.00 [900.00–257,354.00] pg/mL) and heart blood catecholamine levels (EP, 153,194.00 [2,140.00–537,119.00] pg/mL; NE, 185,415.00 [3,450.00–386,810.00] pg/mL; DA, 9,370.00 [1,512.00–349,969.00] pg/mL) were significantly higher than clinical references (EP, < 90 pg/mL; NE, < 700 pg/mL; DA, < 87 pg/mL). In addition, they showed marked differences from data of previously published article.14 Urine catecholamine (EP, 21.13 [2.61–802.74] µg/g creatinine; NE, 226.91 [28.50–2,713.86] µg/g creatinine; DA, 151.73 [27.60–439.59] µg/g creatinine) showed relatively stable levels, although they were not comparable with clinical references because of the absence of a reference for random urine. Distributions of catecholamine levels at each sample site are displayed in box plots as shown in Fig. 1.
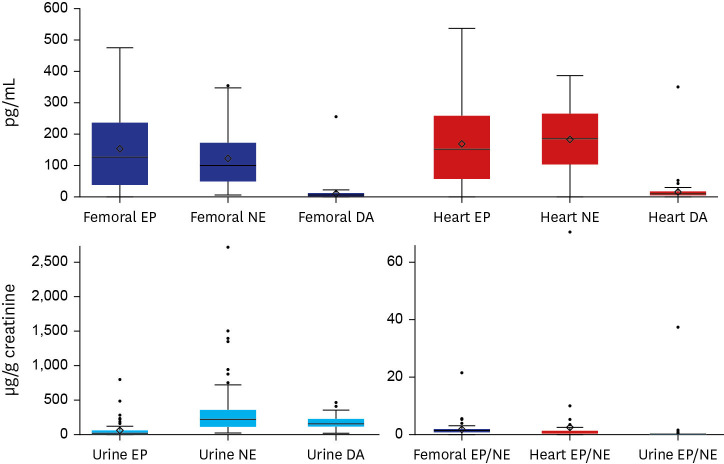
In correlation analysis, femoral and heart blood catecholamine levels showed close relationships. However, no correlation was noted between urine and blood catecholamine levels. Femoral EP showed moderate correlations with femoral NE (r = 0.792, P < 0.001), femoral DA (r = 0.521, P < 0.001), and heart EP (r = 0.597, P < 0.001) and a weak correlation with heart NE (r = 0.329, P = 0.017). Femoral NE showed moderate correlations with femoral DA (r = 0.565, P < 0.001), heart EP (r = 0.512, P < 0.001), and heart NE (r = 0.513, P < 0.001), and a weak correlation with heart DA (r = 0.237, P = 0.028). Femoral DA showed weak correlations with heart EP (r = 0.365, P = 0.003) and heart NE (r = 0.290, P = 0.016) and a moderate correlation with heart DA (r = 0.573, P < 0.001). There were weak correlations between heart EP and heart NE (r = 0.391, P = 0.004) and between heart NE and heart DA (r = 0.392, P < 0.001). Urine EP showed a moderate correlation with urine NE (r = 0.625, P < 0.001) and a weak correlation with urine DA (r = 0.287, P = 0.008). Urine EP/NE ratios were all below 1 (P < 0.001). Femoral EP/NE ratios were greater than 1 (P < 0.001). However, heart EP/NE ratios did not show a significant difference compared to 1.
Relationships of catecholamine levels with sex, age, and the manner of death
There were no significant differences in catecholamine levels between male and female groups or among age groups. In correlation analysis, there was a weak negative correlation of femoral DA (r = −0.232, P = 0.027) with advancing age. However, age and catecholamine levels showed no significant associations in simple linear regression analysis. There were no significant differences in catecholamine levels between suicidal and non-suicidal groups either. Catecholamine levels in different samples and results of comparison analysis according to sex, age, and manner of death are presented in Table 2.
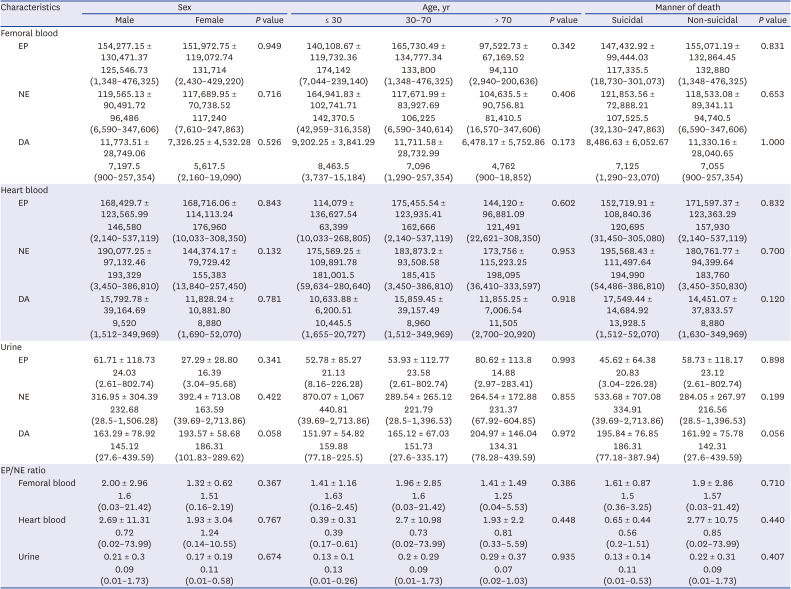
Table 2
Catecholamine values of femoral vein blood, heart blood, and urine in 114 cases according to sex, age, and the manner of death
Data in the top line of each column are presented as mean ± standard deviation. Data in the bottom line of each column are presented as median and range. Blood catecholamine levels are expressed in pg/mL. Urine catecholamine levels are expressed in µg/g creatinine.
EP = epinephrine, NE = norepinephrine, DA = dopamine.
![]()
Influences of medical treatments
Heart EP (P = 0.005) and heart EP/NE ratio (P = 0.004) were significantly higher in subjects who underwent CPR. Femoral DA (P = 0.013), heart EP (P < 0.001), heart NE (P = 0.043), heart DA (P = 0.025), and urine DA (P = 0.012) were significantly increased in the group with EP injection. On the contrary, heart EP/NE ratio showed a significant decrease (P = 0.006) in the group with EP injection. Table 3 shows catecholamine levels in different samples according to CPR and EP injection status and results of comparison analysis.
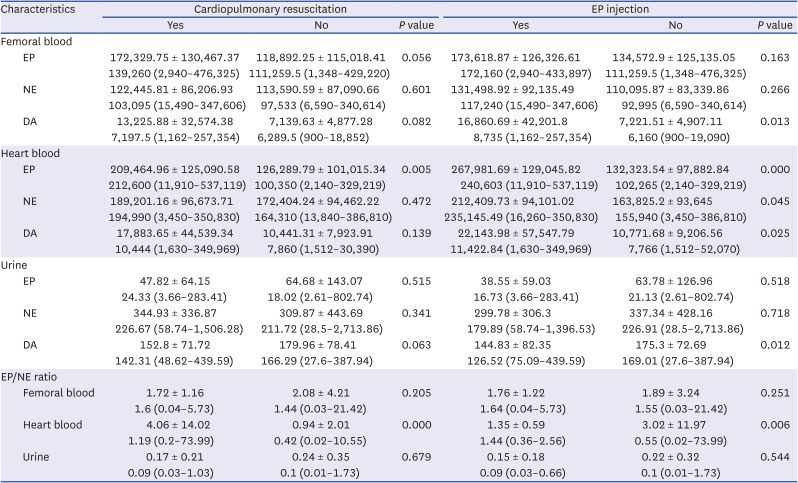
Table 3
Catecholamine values of femoral vein blood, heart blood, and urine in 114 cases according to medical treatment
Data in the top line of each column are presented as mean ± standard deviation. Data in the bottom line of each column are presented as median and range. Blood catecholamine levels are expressed in pg/mL. Urine catecholamine levels are expressed in µg/g creatinine.
EP = epinephrine, NE = norepinephrine, DA = dopamine.
![]()
Relationships of catecholamine levels with PMI and agony time
There were no significant differences in blood catecholamine levels among PMI groups. Urine NE (P = 0.024) and urine DA (P = 0.047) showed significant differences between PMI groups, with both showed an increasing tendency with increasing PMI. In correlation analysis, femoral DA (r = 0.276, P = 0.008) and urine NE (r = 0.280, P = 0.014) displayed weak correlations with PMI. In simple linear regression analysis, urine NE showed a slight tendency of increase with increasing PMI (β = 3.96, R2 = 0.063, P = 0.021). In comparison between agony groups, femoral DA (P = 0.040) and heart DA (P = 0.021) were significantly increased in the long agony group compared to those in the short agony group. Catecholamine levels in different samples and results of comparison analysis according to PMI and length of agony are shown in Table 4.
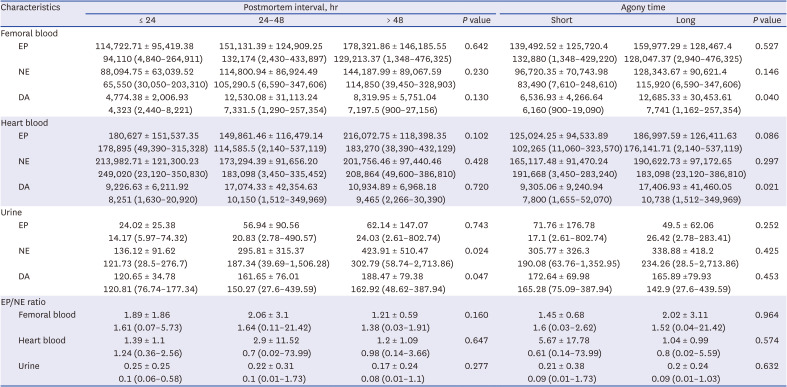
Table 4
Catecholamine values of femoral vein blood, heart blood, and urine in 114 cases according to postmortem interval and agony time
Data in the top line of each column are presented as mean ± standard deviation. Data in the bottom line of each column are presented as median and range. Blood catecholamine levels are expressed in pg/mL. Urine catecholamine levels are expressed in µg/g creatinine.
EP = epinephrine, NE = norepinephrine, DA = dopamine.
![]()
Relationships of catecholamine levels with cause of death
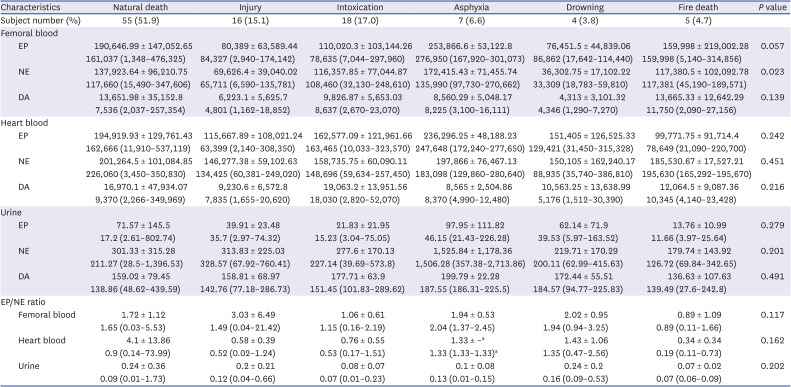
Causes of death were determined clearly for 105 subjects. Table 5 shows catecholamine levels in each sample according to the cause of death and results of comparison analysis. Both mean ± SD and median and range are presented to have a detailed description of numerical distribution. In comparison of six major categories, significant difference among groups was noted for femoral NE (P = 0.023). Multiple comparison analysis showed a significant higher femoral NE in asphyxia than in injury (P = 0.044) (Fig. 2). For 11 minor categories, the natural death group consisted of 22 (21.0%) cases of acute myocardial infarction, 8 (7.6%) cases of ischemic heart disease, 9 (8.6%) cases of sudden cardiac death, 9 (8.6%) cases of cerebrovascular disease, and 7 (6.7%) cases of miscellaneous group; the injury group consisted of 12 (11.4%) cases of head injury and 4 (3.8%) cases of non-head injury. The intoxication group consisted of 12 (11.4%) cases of drug intoxication, 3 (2.9%) cases of narcotics intoxication, 2 (1.9%) cases of acute alcoholic intoxication, and 1 (1.0%) case of chronic alcoholic intoxication; and the asphyxia group consisted of 5 (4.8%) cases of strangulation by ligature, 1 (1.0%) case of choking, and 1 (1.0%) case of suffocation. In comparison of minor categories, significant differences among groups were noted in femoral EP (P = 0.022), femoral NE (P = 0.005), and urine EP/NE ratio (P = 0.029). However, catecholamine levels showed no significant differences among minor categories in multiple comparison analysis. These results of minor categories are difficult to interpret because of large numbers of categories and small subject numbers in each category.
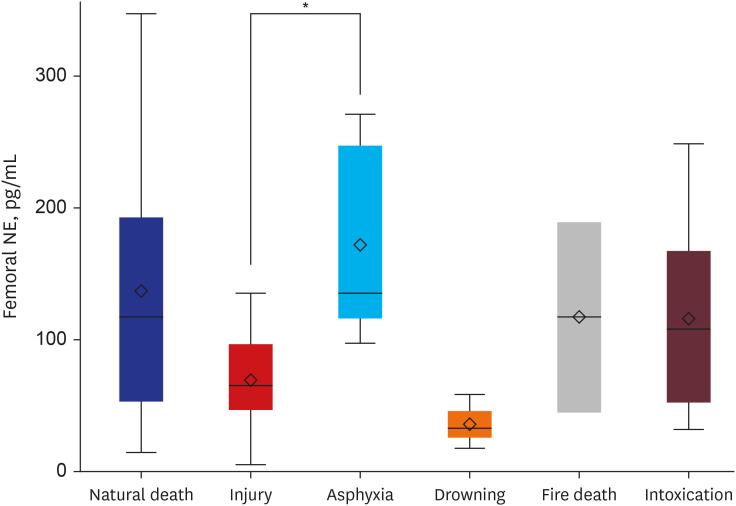 | Fig. 2Multiple comparison analysis among six major categories of the cause of death in femoral NE.NE = norepinephrine.
*P < 0.05.
|
Table 5
Catecholamine values of femoral vein blood, heart blood, and urine in 105 cases according to cause of death
Data in the top line of each column are presented as mean ± standard deviation. Data in the bottom line of each column are presented as median and range. Blood catecholamine levels are expressed in pg/mL. Urine catecholamine levels are expressed in µg/g creatinine.
EP = epinephrine, NE = norepinephrine, DA = dopamine.
aThere was only one case in the asphyxia group with heart blood EP/NE ratio available.
![]()
Subgroup analysis for the group without EP injection
Since the group with EP injection showed significantly elevated levels of femoral DA, heart EP, heart NE, heart DA, and urine DA, an additional subgroup analysis was only performed for the group without EP injection. Of a total of 67 cases, 48 (71.6%) were men and 19 (28.4%) were women. There were eight (11.9%) cases in the age group of ≤ 30 years, 52 (77.6%) cases in the age group of 30–70 years, and 7 (10.5%) cases in the age group of > 70 years. There were three (4.5%) cases in the group of PMI ≤ 24, 43 (64.2%) cases in the group of PMI = 24–48, and 21 (31.3%) cases in the group of PMI > 48. The short agony group had 22 (32.8%) subjects and the long agony group had 45 (67.2%) subjects. Twenty-three (34.3%) subjects underwent CPR. Seventeen (25.4%) subjects were considered to be suicidal deaths.
For all subjects, causes of deaths were clearly defined. There were 31 (46.3%) cases of natural death, 10 (14.9%) cases of injury, 15 (22.4%) cases of intoxication, 5 (7.5%) cases of asphyxia, 3 (4.5%) cases of drowning, and 3 (4.5%) cases of fire death. For minor categories, the natural death group included 11 (16.4%) cases of acute myocardial infarction, 3 (4.5%) cases of ischemic heart disease, 5 (7.5%) cases of sudden cardiac death, 8 (11.9%) cases of cerebrovascular disease, and 4 (6.0%) cases of miscellaneous group. The injury group included 8 (11.9%) cases of head injury and 2 (3.0%) cases of non-head injury. The intoxication group included 10 (14.9%) cases of drug intoxication, 3 (4.5%) cases of narcotics intoxication, 1 (1.5%) case of acute alcoholic intoxication, and 1 (1.5%) case of chronic alcoholic intoxication. The asphyxia group included 4 (6.0%) cases of strangulation by ligature and 1 (1.5%) case of suffocation.
In statistical analyses, there was no significant difference in catecholamine level according to sex, age, manner of death, or CPR status. Femoral NE (P = 0.048), femoral DA (P = 0.039), and heart EP (P = 0.021) showed significant differences between PMI groups. They showed an increasing tendency with increasing PMI. No statistical significance in catecholamine level was identified in comparison between agony groups.
In comparison of major categories for cause of death, significant difference in heart EP (P = 0.034) among groups was noted. However, there was no significant difference in heart EP in multiple comparison analysis. In comparison of minor categories, significant differences in urine EP (P = 0.027) and femoral EP/NE ratio (P = 0.031) among groups were noted. However, they showed no significant differences in multiple comparison analysis.
Go to :
DISCUSSION
This study was performed to investigate influencing factors of postmortem catecholamine levels and to assess relationships of postmortem catecholamine levels with agony time and cause of death. The present study demonstrated some meaningful findings on the distribution of postmortem catecholamine levels and their mutual relationships.
According to an earlier report, postmortem blood catecholamine levels are several times higher than blood catecholamine levels in living people.14 In the present study, serum catecholamine levels were elevated as many as thousands of times when compared to clinical references, similar to results of a previous study.18 In their study, blood samples were diluted 10 to 1,000-fold before measurement. This process was inevitable to obtain satisfactory results for analysis in our study. However, absolute figures in each study showed obvious differences, which might be caused by different detection limit of assay.
Urine catecholamine levels were quite constant in contrast to those of serum, which corresponds well with those found in an earlier experimental study.20 Femoral and heart blood catecholamine levels showed a close mutual relationship in correlation analysis, while there was no correlation between urine and blood catecholamine levels. These findings are consistent with results of previous studies.1820
Results of this study showed no significant differences in statistical analyses of sex, age, or manner of death groups except that there was a weak negative correlation of femoral DA with advancing age. Similarly, Zhu et al.18 have studied 542 autopsy cases and observed that serum catecholamines show no gender-related differences with right heart blood EP showing a slightly decreasing tendency with age. Ishikawa et al.20 reported that urine catecholamine levels were independent of age or gender, supporting results of the present study. With regard to the manner of death, Mancini and Brown22 have documented that urine NE levels are increased in patients attempting suicide. However, further discussion is required because this is the only article related to this issue. In the present study, various kinds of catecholamines were elevated according to medical care in the hospital. The group that underwent CPR showed increased heart EP & EP/NE ratio. The group with EP injection displayed elevated levels of femoral DA, heart EP, heart NE, heart DA, and urine DA. These results are partially consistent with those of a previous study, which demonstrated a mild increase of left heart EP in critical medical care group.18 However, the finding regarding urine DA is in contrast to results of Ishikawa et al.20 who reported no differences in urine catecholamines between those with medical care and those without medical care.
A number of experiments have been performed to investigate stabilities of blood and urine catecholamines. Berg and Bonte10 have proven that blood EP and NE do not show significant changes up to 60 hours. However, Hirvonen and Huttunen23 have observed postmortem increases of serum EP and NE as catecholamines diffuse from sympathetic nerve ending and adrenal gland. In a postmortem declining trial by Wilke et al.,14 femoral EP and NE were increased until 24 hours. They then showed a gradual decrease until 96 hours. In the study of Zhu et al.,18 a stability test revealed no significant changes of blood catecholamines over two days except that heart DA showed a mild tendency toward postmortem increase in cases without critical medical care. In terms of urine catecholamines, a considerable number of studies have reported no relationship of urine catecholamines with PMI for up to three days.52024 Given these findings, urinary catecholamines are considered to be relatively stable with respect to PMI whereas blood catecholamines are not. No correlations of blood catecholamine levels with PMI were observed in the present study, which coincided with earlier reports. However, different from previous studies, there were significant changes of urine NE and DA levels according to PMI. Linear regression analysis showed a slight tendency of increase in urine NE with increasing PMI, although the linear regression equation derived was considered to be insufficient for practical PMI estimation.
Conventional studies on alteration of catecholamines according to agony time were mostly focused on hypothermia, a typical cause of death with a long agonal period. Hirvonen2 reported that EP and NE in urine and blood were elevated in hypothermia fatalities. Subsequent studies revealed similar results only in urine.3456789 According to results of those research, EP is regarded as a more useful marker than NE, with an increase of urine EP/NE being the most reliable marker for the diagnosis of hypothermia. Regarding EP/NE ratios, urine EP/NE ratios did not show any difference between agony groups in this study. These ratios were below 1 in all cases but three. Heart EP/NE ratios showed no significant difference compared to 1. All these findings are generally in accordance with a previous study.14 In their study, femoral EP/NE ratios were lower than 1 in asphyxia, hanging, short agony, and long agony groups. However, femoral EP/NE ratios were mostly greater than 1 (P < 0.001) in the present study. Although catecholamine levels in the hypothermia group were not analyzed in the present study, the availability of urine EP/NE ratio as an indicator of long agonal period appears to be controversial. Apart from hypothermia, not many studies have evaluated catecholamines depending on agony time. In addition, previous studies related to this issue have revealed contrasting outcomes. Hausdörfer et al.11 have asserted that length of agony is clearly correlated to serum levels of catecholamines. Tormey et al.13 have reported no differences in urine catecholamine levels according to length of agony or cause of death. In the study by Kernbach-Wighton et al.,12 heart EP/NE was 16.99 in short agony, 8.47 in medium agony, and 0.10 in hypothermia. Wilke et al.14 found that EP/NE in femoral blood was higher in the long agony group than in the short agony group, although no differences in EP and NE levels of various postmortem specimens were observed according to agony time.
Findings of the present study showed increases of femoral and heart DA in the long agony group. In review of related literature, any particular result on the relationship between agonal period and DA has not been reported yet. According to Zhu et al.,18 heart DA was increased in blunt injury, hyperthermia, fatal methamphetamine abuse, and other poisoning. In addition, external iliac DA was increased in hyperthermia, fatal methamphetamine abuse, other poisoning, and cerebrovascular disease. Ishikawa et al.20 reported that right heart DA was high in sharp instrument injuries and intoxication, but was low in drowning and hypothermia. The authors suggested that advanced deterioration of sympathetic nerve ending might be the reason for higher peripheral DA in certain causes of death. The elevation of blood DA level in extended agonal period provides new viewpoint on the role of DA in agonal stress response, the mechanism of which needs further investigation.
According to our data, significantly higher femoral NE was observed in asphyxia than in injury. With regard to the cause of death, only a few studies have been reported with contradictory results. Early in the 1960’s, Berg1516 asserted that there were obvious relations between blood EP and certain causes of death. Kauert17 reported that blood EP and NE showed no correlations with certain causes of death. Hirvonen et al.25 found that blood NE levels in strangled rats were two times higher than those in the control group. Wilke et al.14 analyzed catecholamine levels in 98 corpses among short agony, long agony, post-CPR status, hanging, and asphyxiation groups and found no conclusive results.
There is only one series of study in the literature dealing with changes in postmortem catecholamine levels according to broad specific causes of death.181920 Zhu et al.18 reported that external iliac NE levels were higher in cases of asphyxia, hyperthermia, poisoning and cerebrovascular disease, but lower in hypothermia. The authors suggested that the elevation of peripheral catecholamines in asphyxia was caused by EP and NE released from sympathetic nerve terminals in extremities mainly influenced by hypoxia and subsequent acidosis. They quoted two research papers in identifying the physiological mechanism of asphyxia, one reported elevation of NE resulting from sympathetic nerve ending release in rats exposed to CO2, and the other showed increase of plasma catecholamine in cats induced by sympathetic vertebral nerve activity in asphyxia.2627 In the same article by Zhu et al.,18 all catecholamine levels were higher in cardiac blood than in the peripheral blood of the injury group. Such a tendency was also observed in the present study (Table 2). The authors inferred that reduced circulatory blood volume and/or brain damage might contribute to elevation of cardiac catecholamine in injury cases. Plus, the injury group in our study included both head and non-head injury subgroups, which brought problems related to various lengths of agony. However, there were no differences in catecholamine levels between the two groups in the same study. These findings partly explained the reason for the difference in catecholamine levels between injury and asphyxia groups in our study. However, catecholamines showed no elevation in fire death or drowning, which had similar causes of death with extended agonal period. Furthermore, catecholamine levels were elevated in femoral blood, although they were expected to be increased in urine in case of long agony since excretion of catecholamine continued during the agonal period. Therefore, comprehensive demonstration of catecholamine level as stress index was not possible in the present study. Attention should be paid to the application of results from this study to differential diagnosis of the cause of death.
In this article, subgroup analysis for the group without EP injection was performed for the sake of excluding the influence of EP injection. The analysis revealed significant results for the relationship with PMI without notable outcomes for analyses of sex, age, manner of death, CPR status, length of agony, or cause of death. When analyzing a total of 114 subjects, urine NE and DA showed an increasing tendency with increasing PMI. In contrast, blood catecholamines including femoral NE, femoral DA, and heart EP were increased in the subgroup analysis, partly consistent with results of previous article.141823 Among articles related to EP injection, there is no study performing a separate analysis only for the group without EP injection.1418 Zhu et al.18 have reported that heart DA shows a mild tendency toward postmortem increase in cases without critical medical care, which is in line with results of our study. However, the critical medical care group seems to mean the group after CPR. Thus, the group with EP injection may or may not be included. Therefore, simple comparison of results of the present study to those of the previous study is not indicative of a meaningful discussion. Further investigation on this issue is needed to demonstrate not only the relationship of postmortem catecholamine level with EP injection, but also the significance of results from the subgroup analysis.
This study has several limitations. First, there might be a possibility of sample bias due to missing data. Although blood samples were diluted to address the detection limit of the assay, a substantial number of blood samples exceeded the detection limit with outliers treated as missing data, which might have led to underestimation of values. Second, analysis of the minor cause of death was incomplete because of a large number of categories and a small number of subjects in each category. A further large-scale study is needed to verify results of this study on a wide range of specific causes of death.
To the authors’ knowledge, this is the first research performing systematic analysis of catecholamines in medicolegal autopsy in Korea. Here we demonstrated overall distribution of catecholamine levels and their correlations, determined demographic and clinical factors influencing postmortem catecholamine levels, and analyzed relationships of catecholamine levels with length of agony and various causes of death. Whether postmortem catecholamine level could be a useful indicator reflecting agonal mental stress is still a debatable issue. However, findings of this study provide valuable reference data for a future study. The assessment of postmortem catecholamine levels is able to be used as a supportive tool in differential diagnosis of the cause of death in particular cases, although further investigation with a larger and broader range of samples is necessary.
Go to :
 XML Download