

 PDF
PDF Citation
 Print
Print


INTRODUCTION
Aura is a completely reversible array of neurological symptoms that occurs mainly with migraine attacks.1 Visual aura (VA), the most common form of typical aura, occurs in 98% of migraine with aura (MA) patients, followed by sensory symptoms, and then speech disturbances.2 VA can occur alone or in combination with other forms of auras.3 Clinical studies have shown that VA varies and is often complex, but common symptoms include foggy vision, blind spots, flashing of bright light, and zigzag lines.4 A recent study revealed that severity of migraine and probable migraine (PM) were more severe when accompanied by VA.
Although aura has also been reported in non-migraine headaches, it has been mostly described in association with migraine. Some case studies have reported aura in non-migraine headaches, including cluster headache, hemicrania continua, chronic paroxysmal hemicrania, and tension-type headache (TTH).567
It has been proposed that aura symptoms may occur independently of the headache.8 Genetic studies suggest that aura symptoms are associated with a specific gene or a set of genes, whereas headache is associated with different genes.9 According to those reports, aura can occur in any forms of headache. Nevertheless, there is currently no reports on the impact and prevalence of VA in non-migraine headache in epidemiologic settings. For the diagnosis of VA, the VA rating scale (VARS) was used, which is a five-item questionnaire with high sensitivity and specificity.10 The self-report form of the VARS has enabled an accurate evaluation of VA in clinical and epidemiological studies.11 The purpose of the study was to assess the prevalence and impact of VA in non-migraine headache in a nationwide population-based samples.
Go to : 
METHODS
Study design
This study used the data of the Circannual Change in Headache and Sleep (CHASE) study, which is a nationwide population-based survey regarding yearly chronobiological changes in headache and sleep. A comprehensive description of the study design and methodology has already been provided.12 In brief, the CHASE study adopted a two-stage clustered random sampling data collection technique based on the Korean population census data of 2015 to obtain a sample proportional to the distribution of the population in Korea.13 With assistance from Hankook Research, we performed an internet-based survey of aged 20–59 adults. We set the target sample size to 3,000 and the calculated sampling error was ± 1.8%.
We used an internet-based headache diagnosis questionnaire to diagnose headache during the CHASE study. We also used various modules to assess the quality of sleep, and comorbidities such as anxiety, depression, insomnia, obstructive sleep apnea, fibromyalgia, and the level of stress. In addition, headache intensity, headache-related disability, and other factors were investigated. Longitudinal assessments were conducted every 3 months for 1 year.
Diagnosis of migraine headache
Migraine headache was defined as migraine and PM. We diagnosed migraine without aura (MO) according to the International Classification of Headache Disorders, 3rd edition (ICHD-3) criteria (code 1.1).14 Diagnostic validation was assessed by contrasting the questionnaire-based diagnoses with the clinicians’ diagnoses by telephone interviews.
PM was diagnosed according to ICHD-3, as a migraine only fulfilling one of the five criteria for migraine (code 1.5).14 Headache that fulfills criteria for both PM and TTH was coded as TTH by the general rule of hierarchy in the ICHD-3.15
In the present study, MA (code 1.2) was defined as a headache that met the diagnostic criteria for both MA and MO. Therefore, migraine referred to both MA and MO. Likewise, PM was defined to include both PM with aura (code 1.5.2) and without aura (code 1.5.1). The estimated sensitivity and specificity of our diagnostic questionnaire for migraine were 92.6% and 94.8%, respectively, and those for PM were 85.0% and 92.9%, respectively.16
Diagnosis of non-migraine headache
We defined non-migraine headache as a headache without a migraine headache during the previous year. Non-migraine headache was divided into TTH or non-migraine non-tension-type (NMNT) headache. TTH was diagnosed based on ICHD-3 criteria (code 2.1) regardless of the frequency as follows: (A) at least ten episodes fulfilling criteria B–D; (B) lasting from 30 minutes to 7 days; (C) at least two of the following four characteristics: (1) bilateral location, (2) non-pulsating quality, (3) mild or moderate pain intensity, and (4) not aggravated by routine physical activity such as walking or climbing stairs; (D) both of the following during the headache: (1) no nausea or vomiting; (2) no more than one of photophobia or phonophobia; and (E) not better accounted for by another ICHD-3 diagnoses.14 The sensitivity and specificity of our diagnostic questionnaire for TTH were 78.4% and 98.4%, respectively.16 If a participant had non-migraine headache but not TTH, the participant was grouped as having NMNT headache.
STTH (Strict tension-type headache) was diagnosed according to the “strict-criteria” of TTH in a previous study.17 STTH was diagnosed when all four typical headache characteristics of TTH (non-pulsating pain, bilateral location, mild or moderate severity, and not aggravated by routine physical activity) were present but without nausea, vomiting, photophobia, and phonophobia. If a participant had TTH but not STTH, the participant was grouped as having TTH not fulfilling STTH (N-STTH).
Diagnosis of VA
We used a self-reporting VARS questionnaire to diagnose VA.1011 The VARS consists of the following five items on visual symptoms, each rated on a scale of 1–3 points: 1) duration of the symptom of 5–60 min (3 points); 2) symptom develops gradually ≥ 5 minutes (2 points); 3) scotoma (2 points); 4) zig-zag line (2 points), and 5) unilateral (1 point). VA was diagnosed with a total VARS score ≥ 3. The specificity and sensitivity of the self-reporting VARS questionnaire were 79.5% and 96.4%, respectively, with reference to the ICHD-3-based physician diagnosis.
Subjects with migraine headache with VA and without VA were subclassified into “migraine headache with VA” and “migraine headache without VA,” respectively. Likewise, non-migraine headache patients were also subclassified into “non-migraine headache with VA” and “non-migraine headache without VA,” respectively.
Assessment of headache-related disability
We assessed headache-related disabilities using the Migraine Disability Assessment (MIDAS) questionnaire. MIDAS consists of five questions to evaluate the impact of migraine on daily life.18 The MIDAS score is calculated by summing the number of days the headache interfered with work, school, household chores, or social activities. The version for Korean language of the MIDAS has been previously validated.19
Assessment of fibromyalgia and cutaneous allodynia (CA)
It is well known that fibromyalgia and CA are common comorbidities of migraine. Fibromyalgia was diagnosed with 1) a Widespread Pain Index (WPI) score ≥ 7 and symptom severity scale (SSS) score ≥ 5, or 2) a WPI score between 3–6 and SSS score ≥ 9 based on the 2016 American College of Rheumatology criteria.20 Meanwhile, CA was assessed using the 12-item Allodynia Symptom Checklist (ASC-12).2122 The ASC-12 evaluated thermal, mechanical, static, and interictal CA in the previous month. CA was diagnosed with an ASC-12 score ≥ 3.
Assessment of depression, anxiety, and stress symptoms
Since depression and anxiety are common comorbidities in patients with migraine, we assessed them.23242526 We evaluated depressive symptoms using the Patient Health Questionnaire-9 (PHQ-9).27 Depression was diagnosed with the PHQ-9 score ≥ 10. We measured anxiety symptoms using the Generalized Anxiety Disorder-7 (GAD-7) scale.28 Anxiety was diagnosed with a GAD-7 score ≥ 10. Furthermore, the level of stress was evaluated because stress frequently presents with migraine. We used the Korean-translated Brief Encounter Psychosocial Instrument (BEPSI-K), and a score ≥ 17 indicates moderate or severe stress.29 The Korean versions of the PHQ-9, GAD-7, and BEPSI-K have been previously validated.303132
Statistical analyses
The 1-year prevalence of migraine headache, non-migraine headache, and VA with headache was expressed as the number of cases per 100 individuals. We performed the normality test of the continuous variables using the Kolmogorov-Smirnov test. Normally distributed variables were analyzed using one-way analysis of variance (ANOVA) or Student’s t-tests. Meanwhile, non-normally distributed continuous variables were analyzed using non-parametric tests, such as the Mann–Whitney U test or Kruskal–Wallis test, as appropriate. Sociodemographic distribution that was expressed by categorial variables were compared by chi-squared test. To compare age- and sex-adjusted clinical characteristics of each group, categorial variables were analyzed by logistic regression analysis. On the other hand, continuous variables were analyzed by analysis of covariance (ANCOVA), even if the model did not fulfill the parametric assumptions because it was robust when the assumptions were violated.33
The presence of a trend in the association between a variable with two categories and an ordinal variable with multiple categories was assessed with the Cochran-Armitage trend test. Given that our internet-based survey required a response to all items, there was no missing data in this study. Statistical Package for Social Sciences (version 25.0; IBM, Armonk, NY, USA) was used for statistical analysis. Two-sided P values of less than 0.05 were considered statistically significant.
Ethics statement
The present study was approved by the Institutional Review Board of the Severance Hospital, Yonsei University (approval no. 2022-2189-003). This study was conducted by the Declaration of Helsinki, and all participants provided written informed consent for participation.
Go to :
RESULTS
Participant characteristics
A total of 3,030 subjects were enrolled. Of which, 1,938 (63.7%) reported at least one headache attack in the past year. Among the 1,938 participants with headache, 507 (26.2%) had migraine (n = 170) or PM (n = 337), and they were classified with migraine headache. Consequently, the remaining 1,431 (73.8%) participants were classified with non-migraine headache. Fig. 1 shows the flow of participants through this study, and the participation rate was 28.3% (3,030/10,699). The distribution of sociodemographic features between survey participants and the general population of Korea was not statistically different (Table 1).
 | Fig. 1Participant selection flowchart.PM = probable migraine, STTH = strict tension-type headache, TTH = tension-type headache.
|
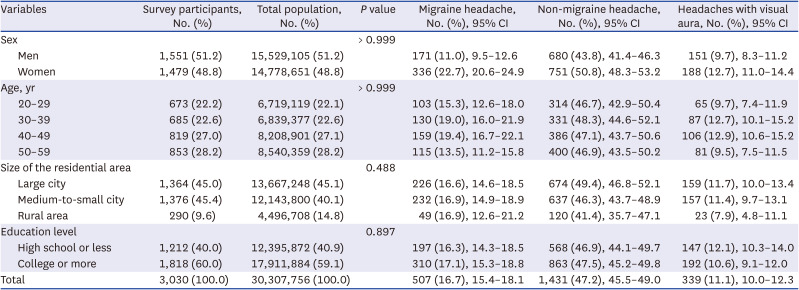
Table 1
Sociodemographic distribution of survey participants of the total Korean population and of participants diagnosed with migraine headache, non-migraine headache, and headaches with visual aura
![]()
Among the 1,431 individuals with non-migraine headache, 954 (66.7%) and 477 (33.3%) had TTH and NMNT headache, respectively. Among the 954 participants with TTH, 84 (8.8%) were classified as having STTH. The clinicodemographic features of the participants with non-migraine headache, TTH, and NMNT headache, are summarized in Table 2.
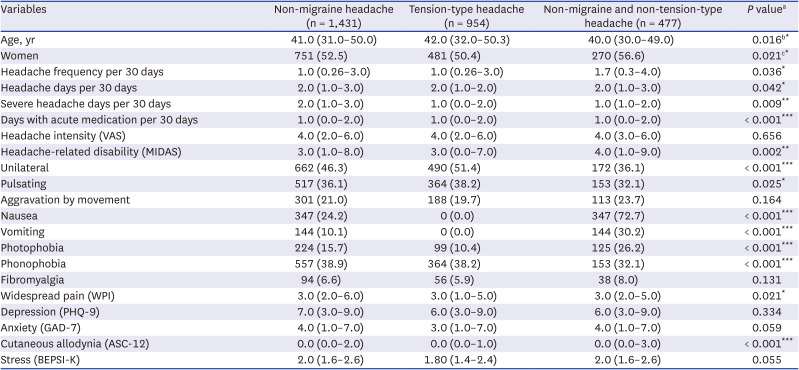
Table 2
Demographic and clinical characteristics of participants with non-migraine headache, tension-type headache, and non-migraine and non-tension-type headache
Data are expressed as number (%) or median (25th–75th percentiles).
VAS = Visual Analogue Scale, MIDAS = Migraine Disability Assessment, WPI = Widespread Pain Index, PHQ-9 = Patient Health Questionnaire-9, GAD-7 = Generalized Anxiety Disorder-7, ASC-12 = 12-item Allodynia Symptom Checklist, BEPSI-K = Korean-translated Brief Encounter Psychosocial Instrument.
aCompared between TTH and NMNT headache. All statistical analyses were performed after adjusting for age and sex, except in age and sex; bAge was compared after adjusting for sex; cSex was compared after adjusting for age.
*P < 0.05, **P < 0.01, ***P < 0.001.
![]()
Prevalence of VA with migraine headache and non-migraine headache
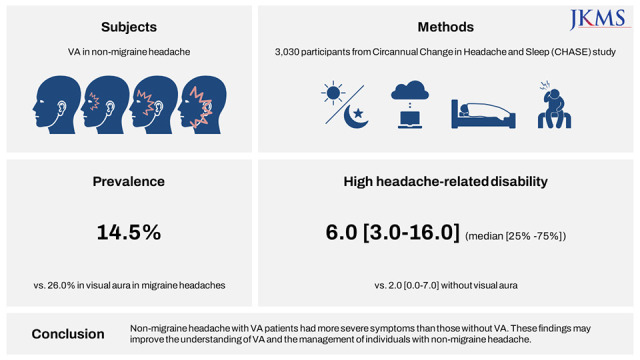
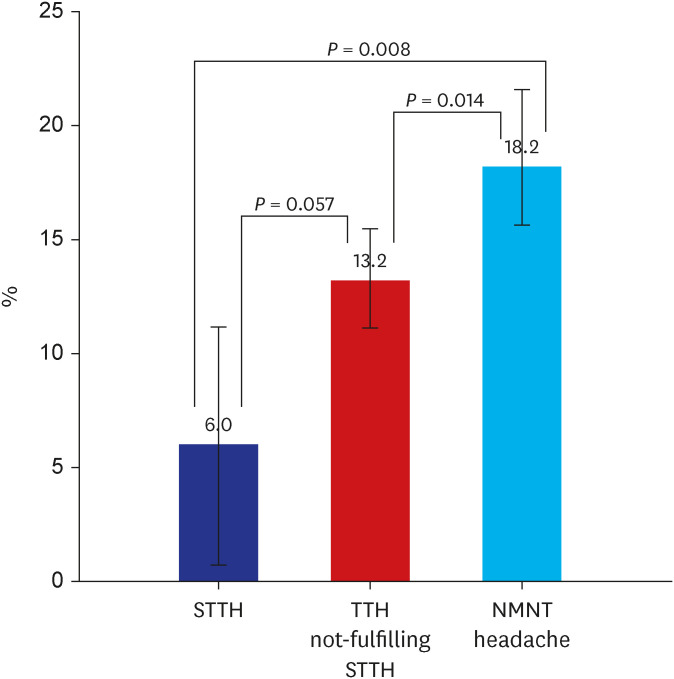
Among the 1,938 participants with headaches, the prevalence of VA was 17.5% (339/1938) and was considerably higher in participants with migraine headache than with non-migraine headache (26.0% [132/507] vs. 14.5% [207/1431], P < 0.001). Among the 1,431 participants with non-migraine headache, the prevalence of VA was significantly lower in participants with TTH than in participants with NMNT headache (12.6% [120/954] vs. 18.2% [87/477], P = 0.005). Meanwhile, the prevalence of VA with STTH (6.0% [5/84]) did not considerably differ from that in participants with N-STTH (13.2% [115/870], P = 0.057), but was significantly lower than that in participants with NMNT headache (18.2% [87/477], P = 0.008. The Cochran–Armitage trend test revealed a significant trend of a higher prevalence of VA in the order of STTH, N-STTH, and NMNT headache (P = 0.008) (Fig. 2).
Age- and sex-specific prevalence of VA in non-migraine headache
Among the 1,431 participants with non-migraine headache, 207 (14.5%) were diagnosed with VA. There was no difference in the prevalence of VA between men and women (14.3% [97/680] vs 14.6% [110/751], P = 0.812) and between age groups (P = 0.540). Furthermore, there was no difference in the prevalence of VA between the different age groups, even after separating women (P = 0.519) and men (P = 0.783) (Fig. 3).

Frequency of VA in participants with migraine headache and non-migraine headache
The frequency of VA across all headache attacks in participants with migraine and non-migraine headache is described in Table 3. In both migraine and non-migraine headache groups, the most common frequencies of VA were 10–24% and < 10% of all headache attacks, respectively. When the frequency of VA was divided into < 51% and ≥ 51%, the frequency of VA ≥ 51% was considerably higher in the migraine headache group than in the non-migraine headache group (21.2% [28/132] vs. 13.0% [27/207], P = 0.034).
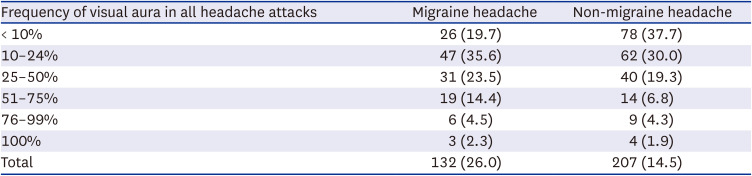
Table 3
Frequency of visual aura in participants with migraine headache and non-migraine headache
![]()
Demographic and clinical characteristics according to the presence of VA in migraine headache and non-migraine headache
Table 4 summarizes the clinicodemographic characteristics of migraine and non-migraine patients by VA comorbidity. The proportion of women with migraine headache with VA was lower than that without VA (59.1% [78/132] vs. 68.8% [258/375], P = 0.029). In contrast, the proportion of women with non-migraine headache with VA and without VA did not differ statistically (53.1% [100/207] vs. 52.4% [641/1224], P = 0.812).
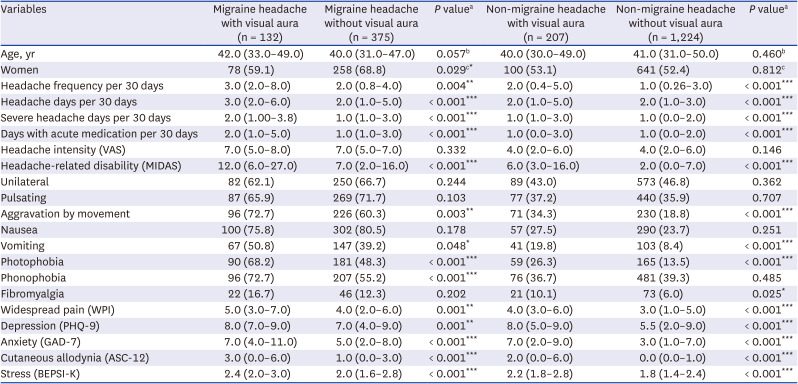
Table 4
Demographic and clinical characteristics of participants according to the presence of visual aura in migraine headache and non-migraine headache
Data are expressed as number (%) or median (25th–75th percentiles).
VAS = Visual Analogue Scale, MIDAS = Migraine Disability Assessment, WPI = Widespread Pain Index, PHQ-9 = Patient Health Questionnaire-9, GAD-7 = Generalized Anxiety Disorder-7, ASC-12 = 12-item Allodynia Symptom Checklist.
aAll statistical analyses were performed after adjusting for age and sex, except in age and sex; bAge was compared after adjusting for sex; cSex was compared after adjusting for age.
*P < 0.05, **P < 0.01, ***P < 0.001.
![]()
The number of headache days per 30 days, severe headache days per 30 days, days with acute medications per 30 days, the prevalence of fibromyalgia, and the scores of headache-related disability (MIDAS), widespread pain (WPI), depression (PHQ-9), anxiety (GAD-7), CA (ASC-12), and stress symptoms (BEPSI-K) were significantly higher with VA than without VA in both migraine headache and non-migraine headache groups. Nevertheless, the pain intensity of migraine headache and non-migraine headache was not statistically different with or without VA.
Comparison of demographic and clinical characteristics between participants with migraine headache with VA and participants with non-migraine headache with VA
The number of severe headache days per 30 days and days with acute medication per 30 days, and the headache intensity scores (Visual Analogue Scale, VAS), headache-related disability (MIDAS), depression (PHQ-9), anxiety (GAD-7), and stress (BEPSI-K) were markedly higher in migraine headache with VA than non-migraine headache with VA. Meanwhile, headache days per 30 days, the prevalence of fibromyalgia, widespread pain (WPI), and CA (ASC-12) did not differ between the two groups (Table 5).
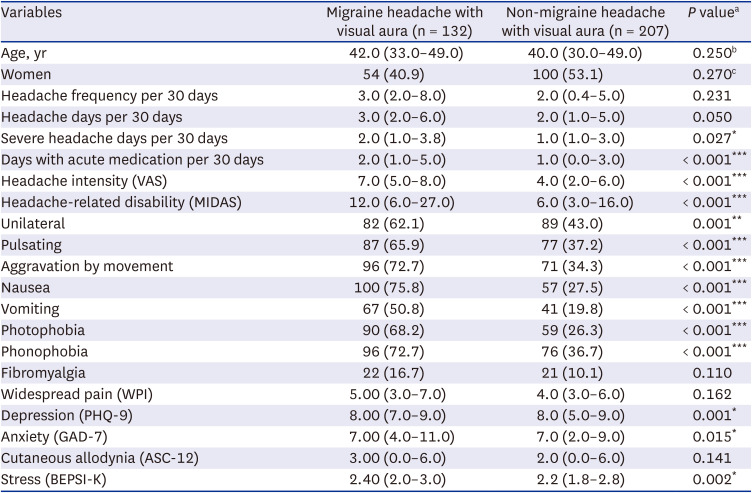
Table 5
Comparison of demographic and clinical characteristics between migraine headache with visual aura and non-migraine headache with visual aura
Data are expressed as number (%) or median (25th–75th percentiles).
VAS = Visual Analogue Scale, MIDAS = Migraine Disability Assessment, WPI = Widespread Pain Index, PHQ-9 = Patient Health Questionnaire-9, GAD-7 = Generalized Anxiety Disorder-7, ASC-12 = 12-item Allodynia Symptom Checklist, BEPSI-K = Korean-translated Brief Encounter Psychosocial Instrument.
aAll statistical analyses were performed after adjusting for age and sex, except in age and sex; bAge was compared after adjusting for sex; cSex was compared after adjusting for age.
*P < 0.05, **P < 0.01, ***P < 0.001.
![]()
Go to :
DISCUSSION
The main findings of this study are as follows. First, 14.5% of non-migraine headache patients experienced VA. VA was less prevalent in non-migraine headache than in migraine headache. Second, the prevalence of VA in non-migraine headache patients did not statistically differ according to age and sex. Finally, the participants with non-migraine headache with VA had more severe symptoms than those without VA.
Our study also revealed that the prevalence of VA increased in the following order: STTH, N-STTH, and NMNT headache. STTH was diagnosed by meeting all four typical headache characteristics of TTH, not permitting typical accompanying symptoms of migraine. Therefore, unlike N-STTH, STTH had none of the typical features of migraine. Considering that participants with NMNT headache had more migraine features including nausea, vomiting, and photophobia than STTH, and STTH did not have migraine features, the occurrence of VA may be positively correlated with these features of migraine.
Cortical spreading depression (CSD) has been regarded as an electrophysiological substrate of VA.343536 However, most studies on CSD have focused on the pathogenesis of MA, and the role of CSD in non-migraine headache has been rarely reported.37 The current study revealed that a substantial proportion of non-migraine headache subjects experienced VA. Our findings propose that CSD may present in non-migraine headache and can play a principal role in the pathogenesis of non-migraine headache as well as migraine headache. Further preclinical and clinical studies are required to clarify the role of CSD in non-migraine headache.
In the current study, headache severity, headache-related disability, and comorbid conditions of non-migraine headache with VA were more severe than those without VA. These findings suggest that although VA is less prevalent in non-migraine headache than in migraine headache, the presence of VA still needs to be evaluated when managing non-migraine headache.
ICHD-3 defines non-migraine headache disorders in relation to the occurrence of VA as typical aura with headache (code 1.2.1.1). A typical aura with headache is diagnosed when the following criteria are fulfilled: (A) attacks fulfilling the criteria for code 1.2.1 migraine with typical aura and criterion B as follows; (B) headache, with or without migraine characteristics, accompanies or follows the aura within 60 minutes. Therefore, if VA is accompanied by a headache other than migraine, the same diagnosis is assigned, regardless of the presentation of migraine. The second edition of the ICHD (ICHD-2) separately diagnosed non-migraine headache with VA and migraine with VA as typical aura with non-migraine headache (code 1.2.2) and typical aura with migraine headache (code 1.2.1), respectively. The present study compared the clinical features of non-migraine headache with VA and migraine headache with VA and found significant differences in headache severity, headache-related disability, and some comorbidities and others. These findings suggest that the diagnostic criteria for typical aura with headache need to be separated according to the type of accompanying headache, similar to those in the ICHD-2 criteria.
There are several limitations to this study. First, the total participation rate in this study was not high. However, we obtained our sample proportional to the distribution of the population in Korea using a two-stage clustered random sampling data collection technique. Moreover, the sociodemographic distribution of the survey participants and that of the general Korean population were not significantly different. Second, we subclassified non-migraine headache into TTH and NMNT headache. Nevertheless, NMNT headache was not listed in ICHD-3 and could be assigned as “unclassified headache.” Epidemiological studies have revealed that a considerable proportion of individuals with headache were classified as having “unclassified headache” according to ICHD-3 and its earlier editions.383940 A Norwegian community-based cohort study showed that “unclassified headache” emerged in 21.5–30.3% of participants.40 An epidemiological study among elderly Chinese individuals also revealed that 35.2% of individuals with headache were classified as having “unclassified headache.” Such a significant proportion of “unclassified headache” could be attributed to insufficient diagnostic instruments for the diagnosis of headaches in epidemiological studies or the incompleteness of the current diagnostic criteria. Third, our study used data from a large sample with a low sampling error, but some subgroup analyses may not have a sufficient sample size. Therefore, in a few cases, statistical significance might be limited owing to the sample size.
In conclusion, although the prevalence of VA in non-migraine headache was lower than that in migraine headache, a significant proportion of participants reported VA with their headaches. Among them, those with VA had more severe symptoms than those without VA. The findings of the current study may improve our understanding of the pathogenesis of VA, migraine, and non-migraine headache, as well as the management of individuals with non-migraine headache.
Go to :
 XML Download