

 PDF
PDF Citation
 Print
Print


INTRODUCTION
Crohn’s disease is a chronic inflammatory disease that more commonly affects the terminal ileum and colon in children1234 and increasing significantly annually in Korea.5 Pediatric patients undergo endoscopy, magnetic resonance enterography, clinical evaluations such as assessments for the pediatric Crohn’s disease activity index (PCDAI) score, or laboratory evaluations to count white blood cells (WBC), erythrocyte sedimentation rate (ESR), serum C-reactive protein (CRP) and fecal calprotectin for the diagnosis and follow up of Crohn’s disease.6
Conventional endoscopy can provide accurate mucosal information but it is invasive. Magnetic resonance enterography has been widely used to determine the extent of disease, especially at the small bowel loops but requires the patient to take oral contrast media for preparation. Both studies may require sedation depending on patient age.7
Ultrasound (US) is a useful imaging modality for the screening and follow-up of Crohn’s disease. It is non-invasive, low cost and easily available. In addition to gray-scale and Doppler US, contrast-enhanced ultrasonography (CEUS) has emerged as an important tool in bowel imaging. CEUS can improve the diagnostic sensitivity of Doppler US to visualize the bowel wall and mesenteric perfusion in real time.8 It can also be used to evaluate the severity of the disease, response to therapy and complications or disease relapse.91011 Quantitative CEUS with an analysis of time intensity curve can provide measurable information regarding the magnitude and rapidity of perfusion in the bowel wall and objectively evaluate treatment response in people with Crohn’s disease.12 However, most CEUS studies have been performed in adults and there is limited experience with children.1013141516
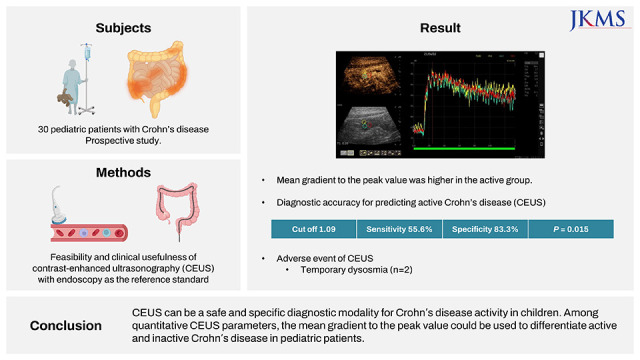
The purpose of our study was to demonstrate the feasibility and clinical usefulness of CEUS for the evaluation of Crohn’s disease activity in children with endoscopy as the reference standard.
METHODS
Study design and patient recruitment
Symptomatic patients with known or suspected Crohn’s disease who were under 18 years old requiring endoscopy were recruited between December 2020 to August 2021. Research was conducted according to the Helsinki Declaration and informed consent was obtained from both parents of each participant when possible. Exclusion criteria were age less than two years old, other bowel disease than Crohn’s disease, history of mass, known right-to-left intracardiac shunts, history of unstable cardiac disease, pulmonary hypertension or systemic hypertension, and end-stage renal or liver disease or septic shock. No patient was excluded from this study even after the exclusion criteria was applied. Albumin, fecal calprotectin and serologic inflammatory markers such as WBC, ESR, serum CRP were collected from these patients. The PCDAI and body mass index (BMI) were calculated.
Endoscopy
Endoscopy was performed by a single pediatric gastroenterologist. All patients underwent endoscopy evaluation for histopathologic confirmation in the initial clinical diagnosis of Crohn’s disease (n = 2), or to assess the activity of Crohn’s disease during treatment (n = 28). All patients fasted overnight and polyethylene glycol was taken to prepare for colonoscopy in two divided doses following the manufacturer’s protocol. The simple endoscopic score for Crohn’s disease (SES-CD) was calculated by the gastroenterologist. Total SES-CD score was used as the reference standard for Crohn’s disease activity in this study.
Contrast-enhanced US examination
Transabdominal US including CEUS was performed by a single pediatric radiologist, on the same day before endoscopy. US examinations were performed using LOGIQ E10 (GE Healthcare, Wauwatosa, WI, USA) with a 2-9 MHz linear array transducer (L2-9-D). The scanning protocol consisted of an initial survey of the four abdominal quadrants using conventional grey-scale US, with bowel loops specifically assessed. CEUS was performed on bowel segments with more than 3 mm of thickened bowel wall on the US with color Doppler imaging. If there were multiple diseased bowel segments, two of the most thickened bowel walls were used. CEUS was performed with a low mechanical index (< 0.8) and a preset dedicated to the linear probe. The second-generation US contrast agent (SonoVue; Bracco, Milan, Italy) was injected in a dose of 0.03 mL/Kg by bolus through an arm vein followed by a 10-mL saline flush. The subsequent enhancement was recorded as a continuous cine loop file for 100 s immediately after injection without breathholding. In cases with more than one diseased bowel segment, a second bolus was administered after at least ten minutes. Patients were monitored for potential adverse reactions to the US contrast agent before, during, and 30 minutes after the CEUS examination. Patient monitoring included observations of the oxygen saturation percentage, respiratory rate, continuous cardiac rate and rhythm monitoring using the extremity pulse oximeter. A 15% change in the heart rate from the baseline, a 15% change in the respiratory rate from the baseline, and a 5% change in oxygen saturation were considered clinically significant. In addition, patients were visually monitored for any evidence of hypersensitivity by the radiologist performing the examination.
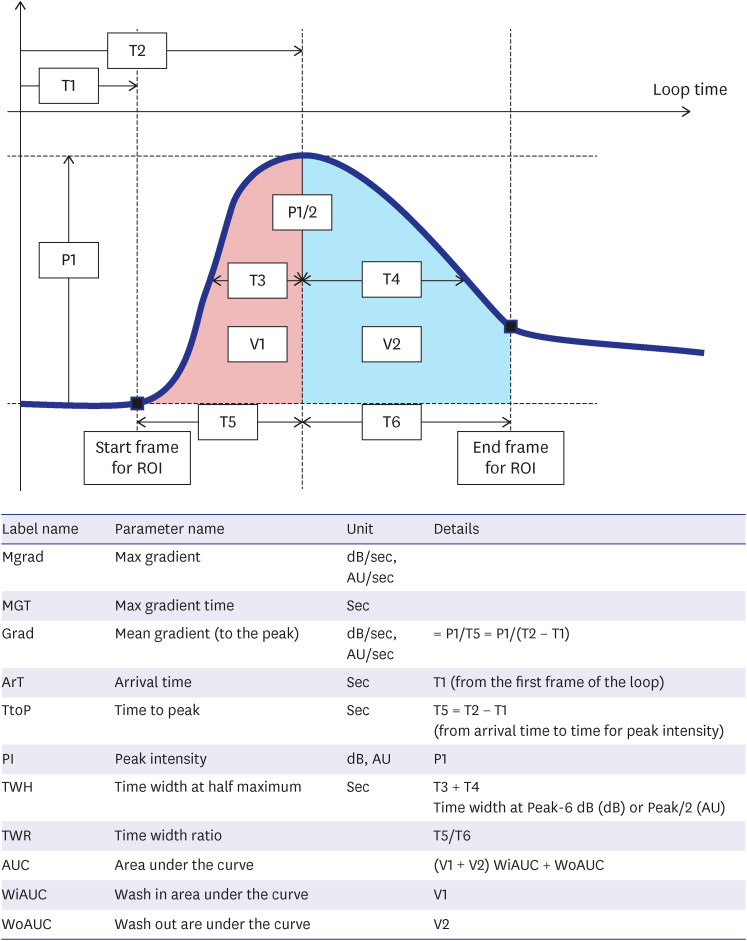
The time intensity curve was calculated from the raw native data with dedicated software in the US scanner (LOGIQ E10). This software reads raw data from the CEUS clip, compensates for the linearity of the signals, calculates mean intensity inside the region of interest (ROI) and draws time-intensity curves. Three non-overlapping ROIs were drawn manually (size approximately 1cm2) at the most enhanced part of the bowel wall excluding the perivisceral tissue (Fig. 1). Multiple parameters related to blood flow and volume were automatically generated by the software when analyzing the time intensity curve: maximum gradient, maximum gradient time, mean gradient to the peak, arrival time, time to peak intensity, peak intensity, time width at half maximum, time width ratio, area under the curve, wash-in area under the curve, and wash-out area under the curve (Fig. 2). Peak enhancement is defined as a maximum value of signal intensity and is reported in arbitrary units for linear values. Time to peak is expressed in seconds and defined as the time from zero to maximum signal intensity. Mean gradient to the peak is a calculated value by dividing peak enhancement by time to peak.
Fig. 1
CEUS of the terminal ileum in a 15-year-old male with Crohn’s disease. There was bowel wall thickening with intense transmural enhancement. A time intensity curve was automatically generated from the region of interest. The X axis represents time (sec) and the y axis represents signal intensity (arbitrary units). This patient was assigned active disease status with the pediatric Crohn’s disease activity index and simple endoscopic score for Crohn’s disease. The mean gradient to the peak was 1.57 AU/sec, suggesting active disease on CEUS.
CEUS = contrast-enhanced ultrasound, AU = arbitrary unit.
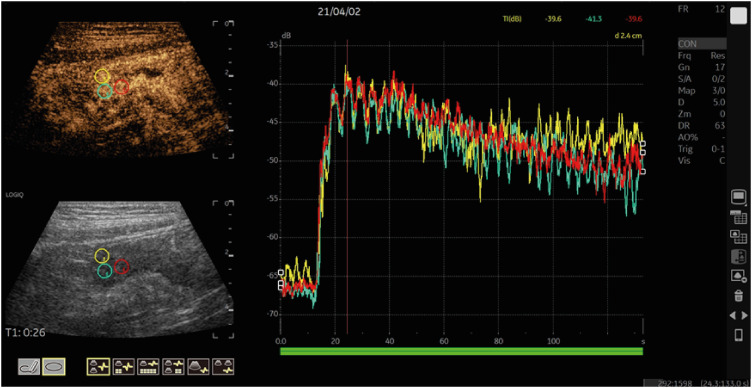
Fig. 2
Contrast-enhanced ultrasound perfusion parameters and time intensity curve.
ROI = region of interest, Mgrad = Max gradient, AU = arbitrary unit, MGT = Max gradient time, Grad = mean gradient to the peak, ArT = arrival time, TtoP = time to peak, PI = peak intensity, TWH = time width at half maximum, TWR = time width ratio, AUC = area under the curve, WiAUC = wash in area under the curve, WoAUC = wash out are under the curve.
Statistical analysis
Quantitative CEUS kinetic parameters were summarized as medians and interquartile ranges due to non-normality. A Pearson correlation analysis was used to assess the strength of relationship between CEUS perfusion parameters, age, BMI, serologic inflammatory markers, albumin, fecal calprotectin, SES-CD and PCDAI. The disease severity for SES-CD score was defined as inactive when SES-CD was 0–2, mild when 3–6; moderate when 7–15, and severe when > 16.17 The differences in parameters between groups were tested with the Mann-Whitney U test. A receiver operating characteristics curve analysis was applied to determine the threshold values of the kinetic parameters. A P value of less than 0.05 was considered statistically significant. All analyses were performed using statistical software (SPSS version 26, IBM, Armonk, NY; and MedCalc version 19.0.6; MedCalc Software Ltd., Ostend, Belgium).
RESULTS
Patient characteristics
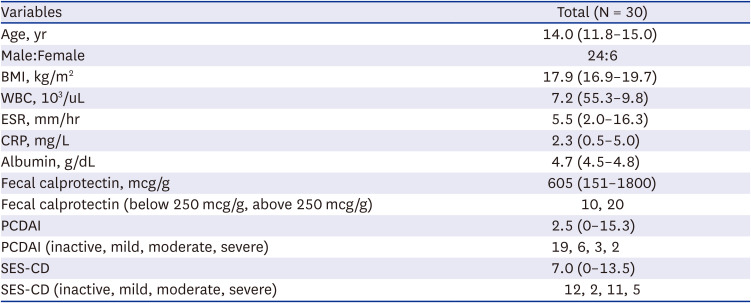
A total of 30 patients were enrolled in this study (Table 1). The median age was 14 years, ranging from 10-18 years. There were 24 boys and 6 girls. None of the patients had a past history of surgery. The median PCDAI score was 2.5, ranging from 0 to 60. The median SES-CD score was 7.0, ranging from 0 to 41. The disease behaviors of 29 patients were B1 (inflammatory) and one patient was B2 (stricturing).
Table 1
Patient characteristics
CEUS was performed successfully in all 30 patients and the involved bowel segments in the small and large bowel loops were identified. Two patients presented with temporary dysosmia that lasted less than one minute during CEUS. No other adverse events occurred during or after the intravenous administration of contrast media. There were no changes in heart rate or rhythm, blood pressure, oxygen saturation or respiratory rate. There were no reports of subjective flushing, nausea, transient headaches or altered taste. Among the scanned bowel segments, one representative bowel segment per patient was included for analysis. A total of 30 bowel segments were analyzed (terminal ileum; n = 28, descending colon; n = 2).
Quantitative CEUS
The Pearson correlation coefficient was calculated between quantitative CEUS parameters and clinical parameters. There was significant correlation between SES-CD and PCDAI (r = 0.734, P < 0.001). ESR, CRP, albumin, and fecal calprotectin showed a positive correlation with PCDAI and SES-CD. However, there was no significant correlation between quantitative CEUS parameters and PCDAI or SES-CD. Positive correlations were noted between the max gradient time and WBC (r = 0.429, P = 0.018), and between the wash in area under the curve and age (r = 0.501, P = 0.005). Negative correlations were noted between peak intensity and BMI (r = −0.602, P < 0.001), between area under curve and albumin (r = −0.384, P = 0.036), and between the washout area under the curve and albumin (r = −0.445, P = 0.014) (Supplementary Table 1).
According to SES-CD, 12 patients had inactive disease and 18 patients had active disease; mild (n = 2), moderate (n = 11), and severe (n = 5). The active Crohn’s disease group defined by SES-CD showed higher ESR (mm/hr) (13.0 vs. 2.0, P = 0.003), CRP (mg/L) (4.7 vs. 0.55, P = 0.018) and fecal calprotectin (mcg/g) (1,503 vs. 237.5, P = 0.005). Among the quantitative CEUS parameters, the mean gradient to the peak value was higher in the active Crohn’s disease group (1.18 vs. 0.93, P = 0.034) (Table 2). Receiver operating characteristic curves for the mean gradient to the peak showed a sensitivity of 55.6% and a specificity of 83.3% with a cut-off of 1.09 (P = 0.015) (Table 3). There was no significant difference in diagnostic performance between ESR, CRP, fecal calprotectin and the mean gradient to the peak (Fig. 3).
Table 2
Comparison of quantitative contrast-enhanced ultrasound kinetic parameters and clinical parameters based on disease activity defined by the simple endoscopic score for Crohn’s disease
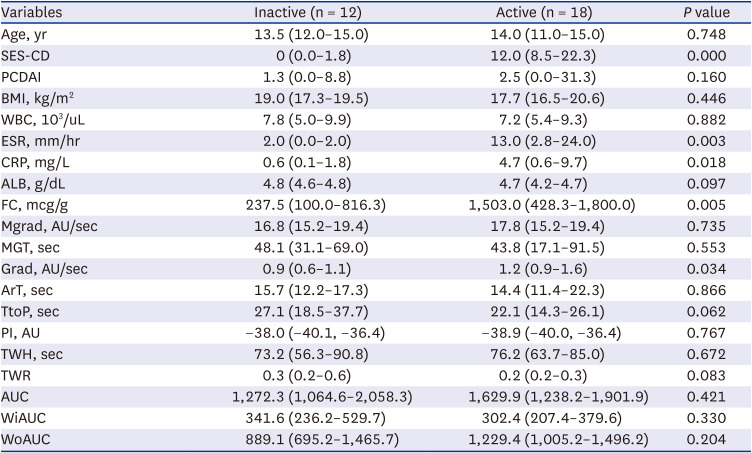
Data are median (interquartile range) values.
SES-CD = simple endoscopic score for Crohn’s disease, PCDAI = pediatric Crohn’s disease activity index, BMI = body mass index, WBC = white blood cell, ESR = erythrocyte sedimentation rate, CRP = C-reactive protein, ALB = albumin, FC = fecal calprotectin, Mgrad = Max gradient, AU = arbitrary unit, MGT = Max gradient time, Grad = mean gradient to the peak, ArT = arrival time, TtoP = time to peak, PI = peak intensity, TWH = time width at half maximum, TWR = time width ratio, AUC = area under the curve, WiAUC = wash in area under the curve, WoAUC = wash out are under the curve.
Table 3
Diagnostic performance of quantitative contrast-enhanced ultrasound kinetic parameter and clinical parameters to differentiate active from inactive Crohn’s disease
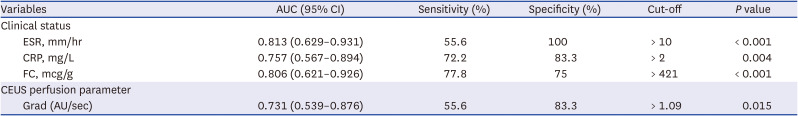
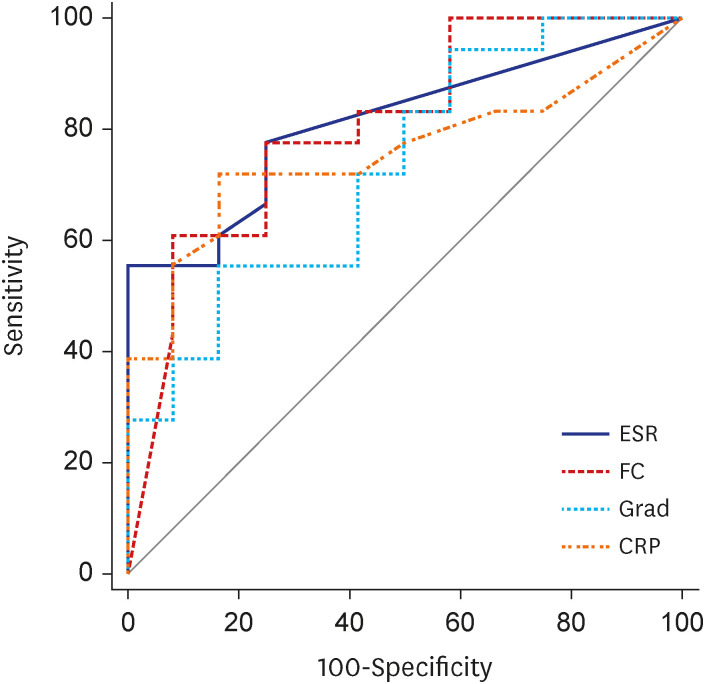
Fig. 3
Comparison of receiver operating characteristics curves for peak enhancement in the prediction of active Crohn’s disease. There was no significant difference in diagnostic performance between the parameters.
ESR = erythrocyte sedimentation rate, FC = fecal calprotectin, Grad = mean gradient to the peak, CRP = C-reactive protein.
Patients with PCDAI score of more than 10, showed higher WBC (103/uL) (9.5 vs. 6.0, P = 0.033), ESR (mm/hr) (16.5 vs. 2.0, P = 0.008), CRP (mg/L) (10.1 vs. 0.65, P = 0.010) and fecal calprotectin (mcg/g) (1,800 vs. 424, P = 0.017). There was no difference in CEUS parameters according to disease activity defined by PCDAI (Supplementary Table 2).
DISCUSSION
Quantitative CEUS has been proposed as a promising tool to assess inflammatory activity in Crohn’s disease patients. Our study showed that quantitative CEUS is a safe diagnostic modality for Crohn’s disease activity in children. Among quantitative CEUS parameters, the mean gradient to the peak showed potential to discriminate between pediatric patients with active and inactive Crohn’s disease. The mean gradient to peak with a cut-off value of 1.09 showed a sensitivity of 55.6%, specificity of 83.3%, and overall diagnostic accuracy of 73.1%.
Intravenous application of the US contrast agent in children is currently off label in Europe and approved only for the evaluation of liver lesions in the United States of America.18 The overall rate of adverse events or intravenous US contrast use in the adult population (0.009) was comparable to the rates seen with the administration of contrast media in MR imaging and considerably lower than the rates seen with iodinated contrast media used in CT imaging.18 In another study, severe anaphylactic reaction was observed in 0.6% (1/137) of the pediatric population.19 Although second-generation US contrast agents are considered potentially safe, all investigators should be prepared for the development of adverse reactions and take precautions ahead of all pediatric intravenous CEUS examinations. In our study, two patients experienced temporary dysosmia that lasted less than 1 minute, which is considered a mild adverse side effect. More multicenter studies are essential to determine an accurate safety profile for each US contrast agent.
CEUS has been suggested as an alternative imaging modality in the follow-up of children with known inflammatory bowel disease to differentiate between active and quiescent disease.18 However, this recommendation was based mainly on adult studies and very few previous reports include a pediatric population.1220212223 A recent dedicated CEUS study on Crohn’s disease patients in the pediatric population included 24 patients with a median age of 14 years with the age range being 3.5–18 years.16 In this study, only one transient adverse event occurred during CEUS, a strong metallic taste that vanished after 10 minutes. Both subjective visual analysis and quantitative perfusion parameters showed good diagnostic performance for evaluating Crohn’s disease activity in children.
In our study, the mean gradient to peak was able to distinguish between active and inactive Crohn’s disease. This is the first study to show the value of the mean gradient to peak for Crohn’s disease activity. This quantification parameter is the ratio between peak enhancement and time to peak and can represent the synergy between the two. This can be useful when no significant difference is observed for peak enhancement or time to peak itself. Even if the two latter indicators are not sufficiently different on their own, the mean gradient to peak may show significant difference if there is an unrevealed tendency between the two according to disease activity. With some of the included patients on treatment, the absolute degree of disease activity might be mild, resulting in the individual indicator itself not being significant. Previously, higher peak enhancement was reported as a parameter that indicated inflammation in Crohn’s disease.24 Similarly, the maximum intensity of the inner bowel wall and entire bowel wall enhancement were also reported as imaging parameters that correlated with the severity of Crohn’s disease on endoscopy.25 Peak or maximum intensity reflects the increased vascularization caused by inflammation-mediated microcirculation activation. In our study, peak intensity correlated with BMI. This may be the reason why peak intensity itself was not a discriminating image parameter. As the mean gradient to peak is a ratio, it might have eliminated the correlation between BMI and peak intensity. The time to peak parameter has been controversial in previous CEUS studies. In the adult population, the time to peak was significantly lower with active Crohn’s disease, indicating that acute inflammatory activity would increase as the time to peak decreased.212627 However, the time to peak was not statistically significant for discriminating active disease in previous studies,1628 a finding similar to what was seen in our study. This might be because unlike endoscopic disease activity degree which only reflects the mucosal surface status, CEUS reflects the entire bowel wall inflammatory status.
In our study, the mean gradient to peak showed relatively low sensitivity in classifying disease activity compared to other studies with adults262930 and a pediatric population,16 at 94% and 72.2% respectively. This might be due to different patient characteristics. In previous studies, some included patients who were not diagnosed with Crohn’s disease26 and some included Crohn’s disease patients who had fibro-stenotic bowel segments requiring surgical resection.30 A previous study with a pediatric population included 40 bowel segments from 24 children with false-negative CEUS results on four bowel segments.16
The treatment goal for Crohn’s disease is now mucosal healing that is achieved endoscopically.31 Performing a routine endoscopy to monitor treatment response can be invasive and may require anesthesia. MR enterography has become the imaging choice for evaluating children, with potential perfusion parameters to monitor disease activity.32 However, patients must drink large amounts of oral contrast and young children may even need anesthesia to undergo the examination. CEUS can be used as an alternative or complementary imaging tool to other cross-sectional modalities to accurately assess the state of the bowel wall and perivisceral tissues. In our study, the mean gradient to peak was comparable to ESR, CRP and fecal calprotectin which are frequently used to evaluate disease activity. However, PCDAI can be subjective and fecal calprotectin can be detected in other intestinal infections that these factors may not be a specific indicator of disease activity. Nowadays, mucosal healing rather than symptom control or histological remission is increasingly recommended as a specific optimal target for Crohn’s disease treatment.31 CEUS imaging parameters can reflect hyperemia and neovascularization in the bowel wall and can be used to follow patients during treatment.12 It is a good evaluation tool because it not only shows the anatomy of the intestine without preprocessing, but also evaluates the degree of clinical inflammation. Conventional US with evaluating bowel wall thickening with color Doppler imaging gives us limited information and can be difficult in detecting active inflammation. When baseline CEUS is performed with endoscopy and histopathologic results, it is possible to estimate the condition of the intestine or the degree of inflammation by following up with CEUS, instead of performing endoscopy every time. It would be a good way to minimize invasive diagnosis in patients, including MR enterography.
Although our sample size was comparable to other adult or pediatric populations investigated for CEUS, the number of enrolled patients and bowel segments were rather small. In particular, the overall disease activity in the study population seems to be low. Future studies with larger number of patients with diverse disease activity should be conducted. Also single pediatric radiologist conducted CEUS. Most of the enrolled patients were under treatment for Crohn’s disease and this might have influenced the US interpretations.
CEUS is a safe and specific diagnostic modality for the evaluation of Crohn’s disease activity in children. Among quantitative CEUS parameters, the mean gradient to the peak value could discriminate between active and inactive Crohn’s disease.
 XML Download