

 PDF
PDF Citation
 Print
Print


INTRODUCTION
Blindness is an important public health issue that can severely influence personal and social well-being. Visual impairment causes an enormous global financial burden and significant annual global productivity losses.12345 According to a report from the World Health Organization (WHO) analyzing surveys from 39 countries since 2000, the estimated number of visually impaired individuals worldwide is 285 million (39 million blind and 246 million with low vision).6
Visual impairment is caused by several ophthalmic diseases. Recent population-based studies have revealed that cataracts, age-related macular degeneration (AMD), glaucoma, myopic degeneration, and diabetic retinopathy are major causes of visual impairment.789101112131415 It is well known that several systemic health problems such as hypertension, diabetes mellitus, and chronic kidney disease affect the development and progression of sight-threatening eye diseases.161718 Conversely, functional end-stage eye diseases can affect general health through lifestyle changes. In particular, blindness can negatively affect mental health and quality of life and experience difficulties in daily activities.19 For the prevention of visual impairment and rehabilitation of visually impaired individuals, accurate assessment of epidemiological features, including the clinical and demographic characteristics of patients with visual impairment, is required.
Previous studies have generally focused on ophthalmic diseases only and have included only hospital-based sample data.78911131415 We used a nationwide cohort dataset of health checkups from 2009 to 2018 in South Korea to investigate the population-based prevalence of blindness and identify the systemic risk factors for blindness in the adult population.
METHODS
National Health Insurance Service (NHIS) database and health checkup program
The NHIS, a single insurer that manages the National Health Insurance Program, has collected medical information from approximately 50 million Koreans (up to 97.0% of the Korean population’s health insurance claims).2021 The NHIS database contains patients’ demographic data, such as region, age, sex, medical utilization/transaction information, claims and deduction data, and insurers’ payment coverage.
The NHIS also manages a biennial health checkup program for all insured Koreans ≥ 40 years of age, and heads of households and employee subscribers who are ≥ 20 years of age are recommended to undergo a NHIS health checkup every year.22 The NHIS health checkup programs include anthropometric measurements, hearing and visual acuity checks, and laboratory tests. Hospitals perform health checkups after being certified by the NHIS, which also regularly qualifies trained examiners.
Study population
We used the NHIS health checkup database from 2009 to 2018 (i.e., a ten-year period). The database was constructed by randomly extracting 1,000,000 people who had undergone health checkups each year, excluding results of those aged under 20 years. Finally, 10,000,000 subjects (5,407,349 males and 4,592,651 females) were included in this study. For a detailed analysis by age group, the data were categorized into seven subgroups (at ten-year-old intervals) as follows: 20–29 years, 30–39 years, 40–49 years, 50–59 years, 60–69 years, 70–79 years, and 80 years and older. Deidentified and anonymized data were used in the analyses.
Definition of blindness
The presenting visual acuity, which was measured using a standard visual acuity chart at a distance of 5 m, was recorded. Presenting visual acuity was defined as visual acuity without correction for those who did not use corrective lenses, or visual acuities with correction for those who wore corrective lenses in daily life.
The definition of blindness was determined by modifying the WHO and United States (US) criteria. The WHO criteria defined blindness as best corrected visual acuity (BCVA) < 20/400 in the better eye, and the US criteria defined blindness as BCVA < 20/200 in the better eye. In the NHIS health checkup database, visual acuity is expressed as 0.1–2.5, and visual acuity less than 0.1 is expressed as 0.1. We defined blindness as visual acuity in the better-seeing eye of ≤ 0.1.
Assessment of systemic health status
A total of 14 systemic health status factors were tested: 1) body mass index (BMI), systemic blood pressure, and diastolic blood pressure; 2) blood tests including fasting glucose, total cholesterol, hemoglobin, creatinine, aspartate aminotransferase (AST), alanine aminotransferase (ALT), and gamma-glutamyl transpeptidase (GGT); 3) urinalysis for proteinuria; 4) hearing; and 5) questionnaire for smoking status and alcohol consumption. Based on the criteria suggested by the NHIS,23 the health checkup results were categorized as follows.
All participants were categorized into four groups based on their BMI, which was calculated by dividing the weight in kilograms by the square of the height in meters: underweight (BMI < 18.5), normal weight (18.5 ≤ BMI < 23), overweight (23 ≤ BMI < 25), and obesity (25 ≤ BMI).
Blood pressure was measured using a sphygmomanometer after resting for at least 5 minutes. If the systolic blood pressure was > 120 mmHg or diastolic blood pressure was > 80 mmHg, re-measurement was carried out after an interval of 2 minutes. Systolic blood pressure ≥ 140 mmHg and diastolic blood pressure ≥ 90 mmHg were defined as abnormal blood pressure.
After confirming the participants’ fasting condition, a blood test was performed. The urine test strip-based proteinuria test was performed and graded from 0 (negative) to 4 in 5 steps. Abnormal results for each variable were determined as follows: fasting glucose (≥ 126 mg/dL), total cholesterol (≥ 240 mg/dL), hemoglobin (male: < 12 g/dL, female: < 10 g/dL), creatinine (> 1.5 mg/dL), AST (≥ 51 IU/L), ALT (≥ 46 IU/L), and GGT (male: ≥ 78 IU/L, female: ≥ 46 IU/L), and proteinuria (≥ 1+).
Hearing was measured by pure-tone audiometry, but if the participant was 66 years or older, it could be measured using the whisper voice test. Cases were defined as having “hearing loss” where the whisper voice test result was less than three out of six numbers or pure-tone audiometry was ≥ 40 dB.
Smoking history was categorized as follows: “Current smoker” is someone who has smoked over five packs (100 cigarettes) in their lifetime and who still smokes currently. “Ex-smoker” is someone who was a previous current smoker but is no longer smoking. “Non-smoker” is someone who has never smoked over five packs (100 cigarettes) in their lifetime. Alcohol consumption was divided into two groups: non-drinkers and drinkers.
Establishment and scope of study subjects and controls
After excluding subjects with missing visual acuity data, the prevalence of blindness was analyzed. To analyze the factors associated with blindness, subjects with missing variables were excluded again and then divided into the blindness and control groups.
Statistical analysis
The prevalence of blindness was analyzed for each year and age group. The long-term trend of blindness was evaluated using Poisson regression analysis. The prevalence of blindness according to age was analyzed using polynomial regression analysis. In this analysis, age was defined as the median age of each age group, and the 85 years and older group was set at 87 years.
The general characteristics of the subjects are expressed as the mean ± standard deviation for continuous variables and percentage for categorical variables. Differences between the blindness and control groups were evaluated using the t-test for continuous variables and the χ2 test for categorical variables. Odds ratios (ORs) were calculated by multiple logistic regression analysis for variables in the blindness group, using the control group as a reference. The quantitative data were descriptively analyzed using the open-source statistical package R version 4.0.3 (R Project for Statistical Computing, Vienna, Austria).
RESULTS
Trends in prevalence of blindness over a decade
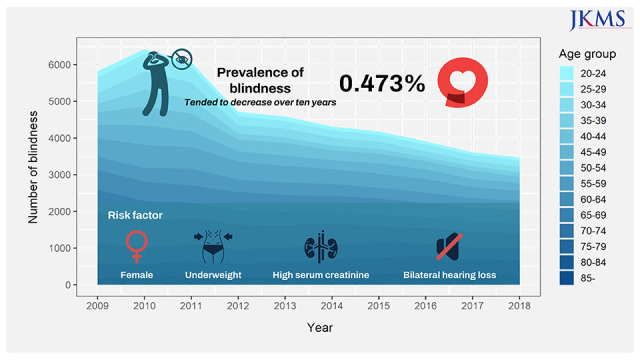
A total of 10,000,000 subjects were analyzed from the national health checkup database between 2009 and 2018. Among them, 49,018 subjects (0.49%) with missing visual acuity data were excluded. Out of 9,950,982 subjects, 47,115 had visual acuity in the better-seeing eyes of ≤ 0.1. The mean prevalence of blindness was 0.473% in the adult population (age ≥ 20 years; Table 1). Table 2 shows the number of people with blindness by age group and year. The prevalence of blindness for each year, 2009, 2010, 2011, 2012, 2013, 2014, 2015, 2016, 2017, and 2018 were 0.586%, 0.647%, 0.611%, 0.474%, 0.461%, 0.434%, 0.420%, 0.393%, 0.363%, and 0.348%, respectively. The prevalence of blindness significantly decreased over ten years in the Poisson regression analysis after adjusting for age (OR, 0.913; 95% confidence interval [CI], 0.910–0.916). Fig. 1 show the number of people with blindness over ten years in the Korean population.
Table 1
Prevalence of blindness in the Korean population
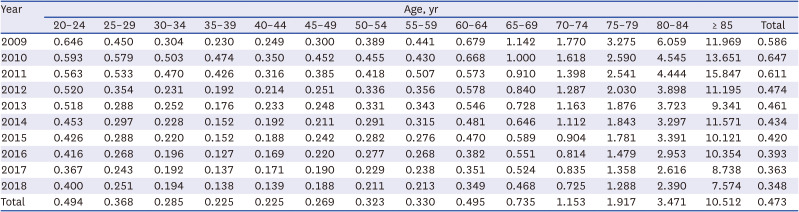
Table 2
Number of participants with blindness among National Health Insurance Service health checkup database of a 1,000,000 Korean population for each year
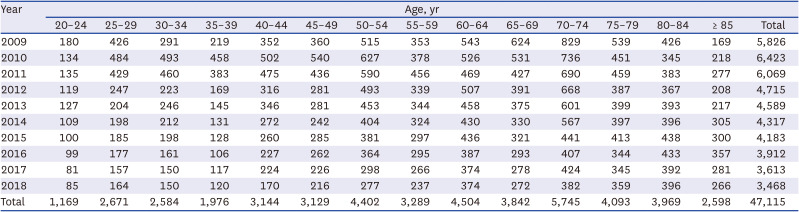
Fig. 1
Number of participants with blindness over ten years among National Health Insurance Service health checkup database of a 1,000,000 Korean population for each year.
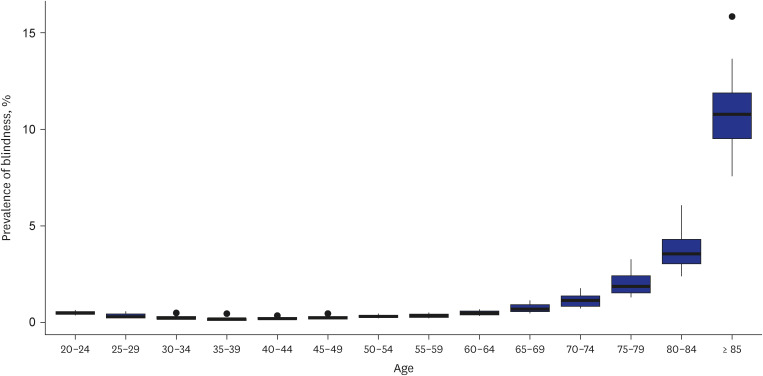
The blindness prevalence for each of the age groups, 20–24, 25–29, 30–34, 35–39, 40–44, 45–49, 50–54, 55–59, 60–64, 65–69, 70–74, 75–79, 80–84, and 85 years and older were 0.494%, 0.368%, 0.285%, 0.225%, 0.225%, 0.269%, 0.323%, 0.330%, 0.495%, 0.735%, 1.153%, 1.917%, 3.471%, and 10.512%, respectively. The prevalence of blindness significantly increased exponentially with age (Prevalence [%] = 238.65 − 0.114 × Year − 0.405 × Age + 0.005 Age2, P < 0.001, R2
= 0.712; Fig. 2).
Demographics and systemic parameters of blindness
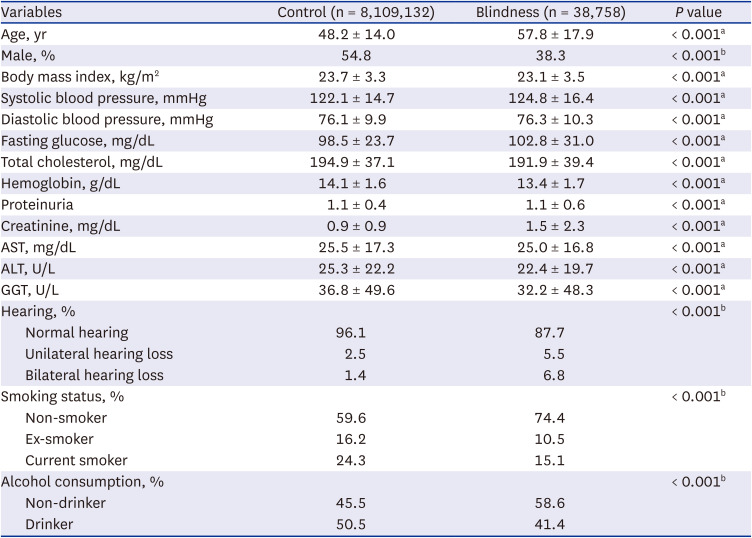
Excluding subjects with missing data in the variables, the characteristics of the blindness group (38,758 subjects) and control group (8,109,132 subjects) are listed in Table 3. All demographic and systemic parameters, including age, sex, and BMI, showed significant differences between the two groups (all P < 0.001; Table 3).
Table 3
Demographics and systemic parameters of the blindness and control groups
Factors associated with blindness (grouped by ten years)
Table 4 shows the results of multiple logistic regression analysis for systemic parameters in the blindness group, using the control group as a reference for each of the seven age groups. In all age groups, males were negatively associated with prevalent blindness (OR, 0.47 [95% CI, 0.43–0.51]–OR, 0.87 [95% CI, 0.81–0.94]). Compared to normal weight, underweight was positively associated with prevalent blindness in all age groups (OR, 1.16, [95% CI, 1.05–1.27]–OR, 1.75 [95% CI, 1.61–1.90]). Overweight in all age groups except for the 40 to 49 years old group, and obesity in all age groups showed a negative association with prevalent blindness (OR, 0.66 [95% CI, 0.61–0.72]–OR, 0.93 [95% CI, 0.87–0.99]; OR, 0.56 [95% CI, 0.51–0.61]–OR, 0.88 [95% CI, 0.82–0.94], respectively). Systolic blood pressure ≥ 140 mmHg was positively associated with prevalent blindness in the 40 to 69 years old group (OR, 1.17 [95% CI, 1.09–1.26]–OR, 1.24 [95% CI, 1.13–1.36]), whereas it was negatively associated in the 80 years and older group (OR, 0.78 [95% CI, 0.72–0.85]). Diastolic blood pressure ≥ 90 mmHg was positively associated with prevalent blindness in the 70 years and older group (OR, 1.17 [95% CI, 1.09–1.26]–OR, 1.23 [95% CI, 1.11–1.35]).
Table 4
Multiple logistic regression analysis for systemic parameters in the blindness group, using the control group as a reference
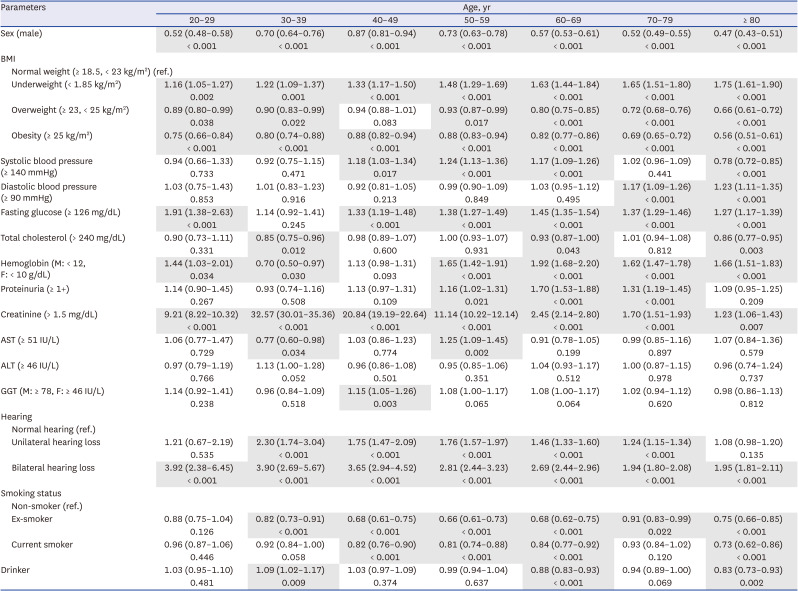
In all age groups except for the 30 to 39 years old group, fasting glucose ≥ 126 mg/dL was positively associated with prevalent blindness (OR, 1.27 [95% CI, 1.17–1.39]–OR, 1.91 [95% CI, 1.38–2.63]). Total cholesterol > 240 mg/dL was negatively associated with prevalent blindness in the 30 to 39 years, 60 to 69 years, and 80 years and older groups (OR, 0.85 [95% CI, 0.75–0.96]–OR, 0.93 [95% CI, 0.87–1.00]). The OR of hemoglobin (male: < 12 g/dL, female: < 10 g/dL) to prevalent blindness was 1.44 (95% CI, 1.03–2.01)–1.92 (95% CI, 1.68–2.20) in the 20 to 29 years group and 50 years and older group, respectively, whereas it was 0.70 (95% CI, 0.50–0.97) in the 30 to 39 years old group. Proteinuria ≥ 1+ was positively associated with prevalent blindness in the 50 to 79 years old group (OR, 1.16 [95% CI, 1.02–1.31]–OR, 1.70 [95% CI, 1.53–1.88]). Creatinine > 1.5 mg/dL was positively associated with prevalent blindness in all age groups (OR, 1.23 [95% CI, 1.06–1.43]– OR, 32.57 [95% CI, 30.01–35.36]).
AST ≥ 51 IU/L showed a negative association with prevalent blindness in the 30 to 39 years old group (OR, 0.77 [95% CI, 0.60–0.98]), whereas it showed a positive association in the 50–59 years old group (OR, 1.25 [95% CI, 1.09–1.45]). ALT ≥ 46 IU/L were not significantly associated with prevalent blindness in all age groups. GGT (male: ≥ 78 IU/L, female: ≥ 46 IU/L) showed a positive correlation in the 40–49 age group (OR, 1.15 [95% CI, 1.05–1.26]).
Unilateral hearing loss was positively associated with prevalent blindness in the 30 to 79 years old group (OR, 1.24 [95% CI, 1.15–1.34]–OR, 2.30 [95% CI, 1.74–3.04]), and bilateral hearing loss was positively associated with all age groups (OR, 1.94 [95% CI, 1.80–2.08]–OR, 3.92 [95% CI, 2.38–6.45]). Ex-smokers showed negative associations in the 30 years and older group (OR, 0.66 [95% CI, 0.61–0.73]–OR, 0.91 [95% CI, 0.83–0.99]), and current smokers showed negative associations in the 40–69 years and 80 years and older groups (OR, 0.73 [95% CI, 0.62–0.86]–OR, 0.84 [95% CI, 0.77–0.92]). Drinkers were positively associated with prevalent blindness in the 30 to 39 years old group (OR, 1.09 [95% CI, 1.02–1.17]), whereas drinking was negatively associated in the 60 to 69 years and 80 years and older groups (OR, 0.83 [95% CI, 0.83–0.93] and OR, 0.88 [95% CI, 0.83–0.93], respectively).
Factors associated with blindness (grouped by 20 years)
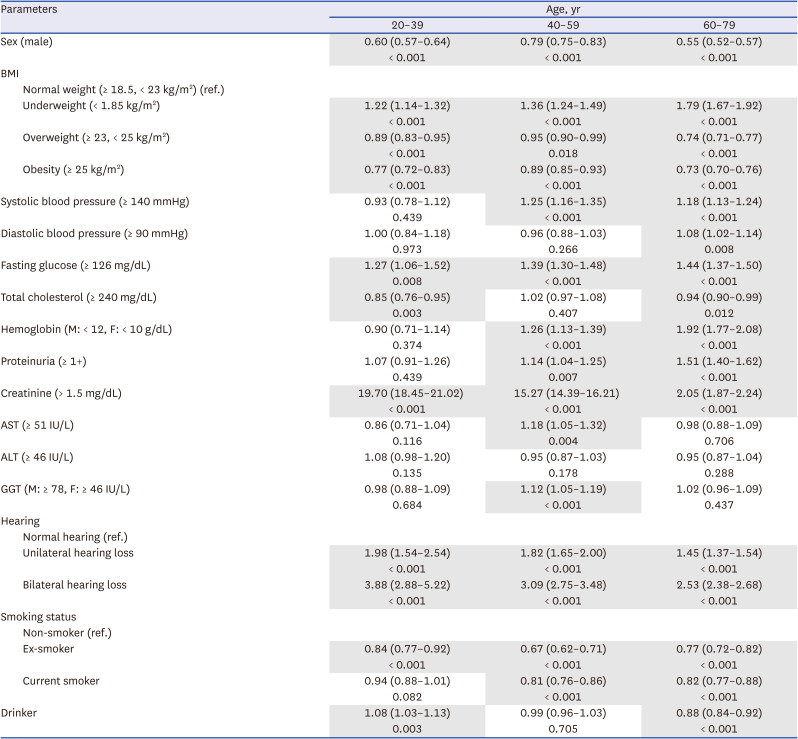
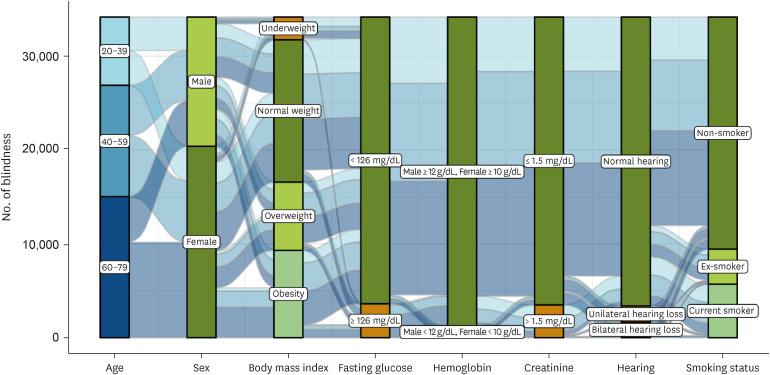
The subjects were categorized into three subgroups (20–39, 40–59 years, and 60–79 years old) and multiple logistic regression analysis was performed (Table 5). The following factors were significantly associated with blindness in all age groups: male sex (OR, 0.55 [95% CI, 0.52–0.57]–OR, 0.79 [95% CI, 0.75–0.83]), underweight (OR, 1.22 [95% CI, 1.14–1.32]–OR, 1.79 [95% CI, 1.67–1.92]), overweight (OR, 0.74 [95% CI, 0.71–0.77]–OR, 0.95 [95% CI, 0.90–0.99]), obesity (OR, 0.73 [95% CI, 0.70–0.76]–OR, 0.89 [95% CI, 0.85–0.93]), fasting glucose (≥ 126 mg/dL; OR, 1.27 [95% CI, 1.06–1.52]–OR, 1.44 [95% CI, 1.37–1.50]), creatinine (> 1.5 mg/dL; OR, 2.05 [95% CI, 1.87–2.24]–OR, 19.70 [95% CI, 18.45–21.02]), unilateral hearing loss (OR, 1.45 [95% CI, 1.37–1.54]–OR, 1.98 [95% CI, 1.54–2.54]), bilateral hearing loss (OR, 2.53 [95% CI, 2.38–2.68]–OR, 3.88 [95% CI, 2.88–5.22]) and ex-smoker (OR, 0.67 [95% CI, 0.62–0.71]–OR, 0.84 [95% CI, 0.77–0.92]). Fig. 3 shows the alluvial diagrams for the overall health status of patients with blindness according to three age groups: sex, BMI, fasting glucose, hemoglobin, creatinine, hearing, and smoking status.
Table 5
Multiple logistic regression analysis for systemic parameters in the blindness group by broad age groups, using the control group as a reference
DISCUSSION
In the NHIS health checkup, the visual acuity is measured and recorded as presenting visual acuity. BCVA has been used in many previous population-based studies,7891122 but it has been pointed out that it does not reflect the effect of uncorrected or under-corrected refractive error, which is the main cause of treatable visual impairment.242526 Therefore, it has recently been recommended that presenting visual acuity should be used in population-based studies.2728
In this nationwide population-based study, the prevalence of blindness, defined as visual acuity in the better-seeing eye of ≤ 0.1, was 0.473% in Korean adults (aged 20 years and older). In previous population-based studies, the prevalence of blindness was reported to be 0.14–1.5%.78911 In the Tajimi Study, the prevalence of blindness (according to the WHO or US criteria) was 0.14% in subjects aged 40 years and older.7 The Taizhou Eye Study reported that the prevalence of blindness was 1.0% using the WHO criteria and 1.5% using the US criteria in subjects aged 45 years and older.11
In the Poisson regression analysis adjusted for age, the prevalence of blindness was found to have gradually decreased over the past decade. Community initiatives and medical advancements (i.e., increased awareness of sight-threatening eye diseases or neurological disorders, improved diagnostic strategies for early detection and diagnosis, and discovery and development of more effective treatments) would have had a significant impact on reducing the prevalence. Analyzing the prevalence of blindness by age group, it was found to increase exponentially from the age of 40 years. Previous studies have also reported that the prevalence of blindness is highly correlated with aging.789 However, in this study, we found that, before the age of 40 years, a higher prevalence of blindness was seen at a younger age. It is presumed that low presenting visual acuity due to uncorrected myopia improved with accurate correction of myopia; this was linked to the need for good eyesight for social activities at that age.
To the best of our knowledge, this is the first time that the association between systemic health status and prevalent blindness has been thoroughly investigated. Seven clinico-demographic factors (sex, BMI, smoking status, fasting glucose, hemoglobin, creatinine, and hearing) associated with prevalent blindness were identified in this study.
In this study, the prevalence of blindness was higher in females than in males (0.65% vs. 0.33%). In the Taizhou Eye Study, the prevalence of blindness was greater in females than in males (1.2% vs. 0.7% for WHO criteria).11 In the Beijing Eye Study, sex was not a statistically significant factor related to blindness.8 In contrast, the Barbados Eye Study reported that the prevalence of blindness was higher in males than in females (2.5% vs. 1.0% for the WHO criteria and 4.2% vs. 2.1% for the US criteria).13 A previous meta-analysis reported that among the causes of blindness, diabetic retinopathy and cataracts were more common in females than in males, and glaucoma and corneal opacity were more common in males than in females.12 It can be inferred that differences in the prevalence of eye diseases in each country may affect the sex ratio of patients with blindness.
Compared to normal weight, overweight and obesity decreased the risk of blindness, while underweight increased the risk of blindness in this study. A previous study on a population with type 2 diabetes reported that visual impairment was associated with lower BMI.29 Furthermore, several studies have shown that a lower BMI is associated with a greater risk of glaucoma. Kim et al.30 reported that participants aged > 40 years with BMI > 25 had a low prevalence of primary open-angle glaucoma compared to those with BMI < 25. However, contradictory results have also been reported.31 Newman-Casey et al.32 reported that obese patients had a higher risk of glaucoma.
The blindness group had lower smoking and alcohol consumption rates than the control group, and smoking was significantly associated with a lower OR for prevalent blindness in this study. These findings may indicate that visual impairment leads to smoking cessation and/or alcohol abstinence, resulting from lower socioeconomic status.3334
Fasting glucose levels were significantly higher in the blindness group than in the control group in almost all age groups. Fasting glucose is an important factor in the diagnosis of diabetes, and its relationship is well known.35 A previous population-based study also reported that higher fasting glucose levels were associated with vision-threatening diabetic retinopathy.18 It is also possible that if physical activity is restricted in patients with blindness and the amount of exercise they perform decreases, their risk of diabetes may increase due to the decrease in exercise.
Hemoglobin is an important protein for the transport of oxygen in the body. In this study, blood hemoglobin concentration was significantly lower in the blindness group. A previous population-based study reported that glaucoma was associated with a low blood hemoglobin concentration.36 Diabetic patients with retinopathy also have lower hemoglobin levels and a higher frequency of anemia.37 Blood hemoglobin concentration is also decreased in patients with decreased renal function.38 Anemia was found to have harmful associations with AMD in a previous epidemiological study in a Korean population.39 These results suggest that low hemoglobin levels may influence the development and progression of ocular diseases, and systemic disease may be involved in this process.
Serum creatinine is a product of muscle metabolism that is released at a constant rate and is an important indicator of renal function. Cheng et al.17 reported that the early AMD was associated with chronic kidney disease and AMD is also well known as an important cause of blindness.7891112 A population-based study reported that low estimated glomerular filtration rate levels were independently associated with primary open-angle glaucoma.40
Hearing loss is common in older adults and impairs activities of daily living.4142 Both unilateral and bilateral hearing loss were significantly associated with blindness in this study. There are various syndromes in which hearing loss and visual impairment appear simultaneously, such as pseudoexfoliation syndrome, oculo-auricular syndrome, Cogan’s syndrome, Vogt-Koyanagi-Harada syndrome, Behçet syndrome, congenital rubella syndrome, retinitis pigmentosa-related genetic syndromes, and Down syndrome.434445 According to an epidemiological study in Korea, the presence of proliferative diabetic retinopathy was significantly associated with hearing loss in the middle-aged group. The potential role of microvascular diseases in the development of hearing loss, especially in middle-aged patients, can be considered.46 The prevalence of concurrent visual and hearing impairment is reported to be 16.6% in adults aged 80 years and older.47 The SHELTER study reported that those with dual sensory impairment had higher rates of clinical problems than those without sensory impairment.48 In addition, this dual impairment has been reported to increase the risk of mortality.4950
This study has several limitations. First, it was not possible to classify the subjects according to the causative eye disease. Depending on the eye disease, the relationship with systemic health status is expected to be different. Second, the NHIS health checkup database was not created using a stratified multistage cluster sampling method. Therefore, the data in this study cannot be considered a perfect representation of the entire Korean population. Third, although this study from a single ethnic group (i.e., Korean) has the advantage of being a population-based design, it is necessary to reconfirm the study findings in various ethnicities. Fourth, since each patient is sampled every year, overlapping samples may occur, which may affect the statistical processing. Fifth, in this study, a visual acuity in the better-seeing eye of ≤ 0.1 was defined as blindness; this may be a broad definition, compared to previous studies which used WHO criteria. The visual acuity data of the NHIS was not subdivided below 0.1, and this is considered to be a limitation of the visual acuity test included in the general health checkup. Nevertheless, considering the US criteria, the definition of blindness as used in our study is thought to be sufficiently reasonable.
In conclusion, over the past decade, the overall prevalence of blindness among Korean adults was 0.473%. While the prevalence of blindness decreased from 2009 to 2018, it was found to increase with age. Several systemic conditions associated with prevalent blindness were confirmed in the present study. Further studies are warranted to determine whether the systemic conditions identified are causative factors or consequences of blindness.
 XML Download