Journal List > Diabetes Metab J > v.47(4) > 1516083410

Lu, Gao, Dong, Jiang, Hu, and Wang: Change Profiles and Functional Targets of MicroRNAs in Type 2 Diabetes Mellitus Patients with Obesity

Abstract

Background

MicroRNAs (miRNAs) exert an essential contribution to obesity and type 2 diabetes mellitus (T2DM). This study aimed to investigate the differences of miRNAs in the presence and absence of T2DM in patients with obesity, as well as before and after bariatric surgery in T2DM patients with obesity. Characterization of the common changes in both was further analyzed.

Methods

We enrolled 15 patients with obesity but without T2DM and 15 patients with both obesity and T2DM. Their preoperative clinical data and serum samples were collected, as well as 1 month after bariatric surgery. The serum samples were analyzed by miRNA sequencing, and the miRNAs profiles and target genes characteristics were compared.

Results

Patients with T2DM had 16 up-regulated and 32 down-regulated miRNAs compared to patients without T2DM. Improvement in metabolic metrics after bariatric surgery of T2DM patients with obesity was correlated with changes in miRNAs, as evidenced by the upregulation of 20 miRNAs and the downregulation of 30 miRNAs. Analysis of the two miRNAs profiles identified seven intersecting miRNAs that showed opposite changes. The target genes of these seven miRNAs were substantially enriched in terms or pathways associated with T2DM.

Conclusion

We determined the expression profiles of miRNAs in the obese population, with and without diabetes, before and after bariatric surgery. The miRNAs that intersected in the two comparisons were discovered. Both the miRNAs discovered and their target genes were closely associated with T2DM, demonstrating that they might be potential targets for the regulation of T2DM.

INTRODUCTION

According to the World Health Organization, obesity is defined as abnormal or excessive fat accumulation that presents a health risk. In recent decades, with changes in diet and reduction in physical activity, obesity has become a global epidemic issue [1,2]. In 2016, an estimated 13% of the global adult population (11% of men and 15% of women) was obese [2]. Obesity is one of the susceptibility factors for type 2 diabetes mellitus (T2DM), and a study showed that patients with obesity are more than seven times more likely to develop T2DM than people with a healthy weight range [3]. Both obesity and T2DM are risk factors for adverse complications such as cardiovascular disease, and the cardiovascular risk increases significantly when both coexist. Therefore, the treatment of obesity and T2DM is a key issue in controlling cardiovascular morbidity and mortality.
Bariatric surgery is considered the most effective and sustainable treatment for obesity and obesity-related complications [4], significantly reducing T2DM and greatly improving the quality of life of patients with obesity. Studies have shown that bariatric surgery could better control blood glucose and improve remission rates for T2DM than medication alone, and the remission is durable [5-7]. The mutual regulatory network between obesity and T2DM, and the regulatory mechanism of bariatric surgery alleviating T2DM have always been the focus of scientists’ attention and the difficulty of research. Patients with obesity and T2DM who undergo bariatric surgery experience rapid improvement in glycemic control in a short period of time [8]. Significant enhancement in T2DM after 21 days of bariatric surgery has been reported before noticeable weight loss in patients with obesity [9]. Therefore, this present study focused on the mechanisms regulating the improvement of T2DM in the early phase (1 month) of bariatric surgery.
MicroRNAs (miRNAs) are a type of single-stranded, endogenous, non-coding RNAs, approximately 18 to 22 nucleotides in length [10]. They act on messenger RNAs by binding to the complementary sequence of the 3’ untranslated region, thereby affecting genes expression. MiRNAs can regulate 30% to 80% of genes expressed in the human genome [11], and each miRNA can target hundreds of genes while multiple miRNAs may only impact on one gene [12]. Thus, miRNAs form a complex genes regulatory network that controls almost every biological process (BP). Recent studies have reported that miRNAs perform a key role in obesity and its associated complications [13-15]. Moreover, miRNAs can regulate the uptake and utilization of glucose, the production and secretion of insulin, the maturation and differentiation of islet cells, and participate in BPs such as insulin resistance, glucose homeostasis and lipid metabolism, which may explain the pathogenesis of T2DM [16-19].
Given the close relationship between obesity and T2DM, the objects of this study were patients with obesity, and the changes of miRNAs in patients without T2DM or with T2DM were firstly compared and analyzed, which could explore the regulatory network of miRNAs in the occurrence and development of T2DM. Furthermore, for the significantly relieving effect of bariatric surgery on T2DM, this study continued to compare and analyze the changes of miRNAs in T2DM patients with obesity before and after bariatric surgery, which would reveal the regulatory network of miRNAs in the process of remission of T2DM. By comprehensively sorting out the above two comparative analyses, it is expected to find the most potential miRNAs regulating T2DM, thereby alleviating T2DM in patients with obesity.

METHODS

Recruitment

All patients from The First Affiliated Hospital of Jinan University (China) with a body mass index (BMI) ≥27.5 kg/m2, aged between 18 and 65 years, of either sex, who met the indications for bariatric surgery were included in this study. Fifteen patients with obesity but without T2DM and 15 patients with both T2DM and obesity were screened for this study, and all 30 patients underwent bariatric surgery, either sleeve gastrectomy (SG) or Roux-en-Y gastric bypass (RYGB). In addition, all patients were followed up for 1 month postoperatively. Of the 15 patients with T2DM, nine had newly discovered diabetes, and another six had varying degrees of diabetes with a mean duration of 5.06 years. These six diabetic patients were on no more than one glucose control medication and did not start any new glucose-lowering medications within 1 month of bariatric surgery. The study was ethically approved by the Institutional Review Board of The First Affiliated Hospital of Jinan University (No.: KY-2021-102). All participants provided informed written consent prior to the study, and the study assessments were conducted in accordance with the 1964 Helsinki declaration.

Serum samples preparation and extraction

All serum samples were obtained by standard venipuncture from patients who had fasted for at least 12 hours. The supernatant was acquired by low temperature centrifugation at 4,000 ×g for 10 minutes and stored at –80°C until use. The TRIzol Reagent (cat. NO. 15596026, Invitrogen, Waltham, MA, USA) was used to extract total RNA from serum samples under the guidance of the instructions. After total RNA quality determination and RNA integrity assessment, quantification was finally performed via Qubit 3.0 with QubitTM RNA Broad Range Assay kit (Q10210, Life Technologies, Carlsbad, CA, USA). KCDigitalTM small RNA Library Prep Kit for Illumina (cat. NO. DR08602, Wuhan Seqhealth Co. Ltd., Wuhan, China) was applied to construct the miRNA libraries. Lastly, the gel-purified cDNA libraries were also isolated, purified and quantified by Qubit 3.0.

Analysis of miRNAs sequencing data

Equimolar amounts of libraries were pooled and sequenced on Hiseq X-10 sequencer (Illumina) with PE150 model. MiRNA sequencing experiment and high throughput sequencing were performed by Seqhealth Technology Co. Ltd. Raw sequencing data were further filtered low quality reads, removed adaptor sequences and eliminated duplications. The clean sequences of each sample were mapped to the reference genome of Homo sapiens GRCh38 using Bowtie (version 1.1.2). Subsequently, sequences alignment was performed using mirdeep2 (version 2.0.0.8) and known miRNAs were detected. The reads were mapped to mature and precursor miRNAs obtained from the miRNAs database miRBase (https://www.mirbase.org/).
The edgeR package (version 3.12.1) was used to normalize the read counts of known miRNAs and to calculate the logarithmic value of counts per million (log CPM) for normalization analysis. The differentially expressed miRNAs (DEMs) between the groups were determined with |log2 fold change (FC)| >1 and P value <0.05. Volcano plots and heat maps of DEMs were done by R software version 4.1.2 (R Foundation for Statistical Computing, Vienna, Austria). The online Venn diagram production tool Venny (https://bioinfogp.cnb.csic.es/tools/venny/) was used to analyze the intersection of different variations of miRNAs across groups.

Analysis of miRNA target genes

Two databases, miRanda (version 3.3a; https://bioweb.pasteur.fr/packages/pack@miRanda@3.3a) and RNAhybrid (version 2.1.1; https://bibiserv.cebitec.uni-bielefeld.de/download/tools/rnahybrid.html), were used to predict the target genes and their intersection was taken as the list of target genes. P value <0.05 was defined as significant in the Gene Ontology (GO) terms and Kyoto Encyclopedia of Genes and Genomes (KEGG) pathway enrichment analysis, both of which were plotted by a free online platform for data analysis and visualization (https://www.bioinformatics.com.cn). The Cytoscape (version 3.8.2; https://cytoscape.org/release_notes_3_8_2.html) tool cytoHubba obtained key target genes by analyzing the results exported from the STRING (version 11.5; https://cytoscape.org/release_notes_3_8_2.html) database.

Data calculation and formula

Homeostasis model assessment of insulin resistance (HOMA-IR), an authoritative index for assessing insulin resistance, is calculated as fasting blood glucose×fasting insulin/22.5. Weight change (weight loss=preoperative weight−postoperative weight), BMI change (∆BMI=preoperative BMI−postoperative BMI), and percentage total weight loss—%TWL=[(pre-operative weight−postoperative weight)/preoperative weight]×100%— are common indicators to assess the efficacy of weight loss before and after bariatric surgery.

Statistical analysis

Statistical analysis was performed utilizing IBM SPSS Statistics version 24 (IBM Co., Armonk, NY, USA) and R software version 4.1.2. In the comparison of patients with and without T2DM, or patients who underwent SG or RYGB preoperatively and postoperatively, we applied two independent samples t-test (two-tailed) for continuous variables and the Fisher’s exact test for categorical variables. Data before and after bariatric surgery were tested with two paired samples t-test. The relationships between continuous variables were analyzed by Pearson correlation. P value less than 0.05 was considered to be statistically significant.

RESULTS

Clinical characteristics

To explore the DEMs caused by whether patients with obesity have T2DM or not, a total of 30 patients with obesity were included in this study, 15 of whom did not have T2DM and 15 of whom had T2DM. As shown in Table 1, except for glycated serum protein (GSP, P=0.008), glycosylated hemoglobin (HbA1c, P=0.000), fasting glucose (GLU, P=0.001), and HOMA-IR (P=0.015), there were no significant differences between the two groups in other indicators such as anthropometric indicators, lipid metabolism-related indicators, and weight loss effectiveness evaluation indicators. GSP and GLU could reflect the short term glycemic control status. To further investigate the DEMs of early remission of T2DM by bariatric surgery, patients were followed up for 1 month after bariatric surgery in this study. We were surprised to find remarkable improvements in weight, BMI, triglycerides (TG), total cholesterol, high density lipoprotein, GSP, HbA1c, GLU, insulin, and HOMA-IR in T2DM patients at only 1 month postoperatively. These two interesting sets of changes set the stage for our next step of DEMs analysis.
In addition to this, 17 of these 30 patients underwent SG, while the other 13 underwent RYGB, and we further compared the clinical characteristics of these patients before and after the SG or RYGB procedures (Supplementary Table 1). Before the surgery, there were significant differences in weight (P=0.039), BMI (P=0.024), and waist to hip ratio (P=0.022) between SG and RYGB. And 1 month after surgery, SG and RYGB displayed significant differences in BMI (P=0.037), weight loss (P=0.007), and change in BMI (∆BMI, P=0.025). Patients who underwent RYGB had higher weight and BMI relative to those who underwent SG, as a result of a joint choice between surgeons and patients. In contrast, the two surgical procedures did not show significant differences in lipid metabolism-related or glucose metabolism-related indicators, either preoperatively or postoperatively.

DEMs in different groups

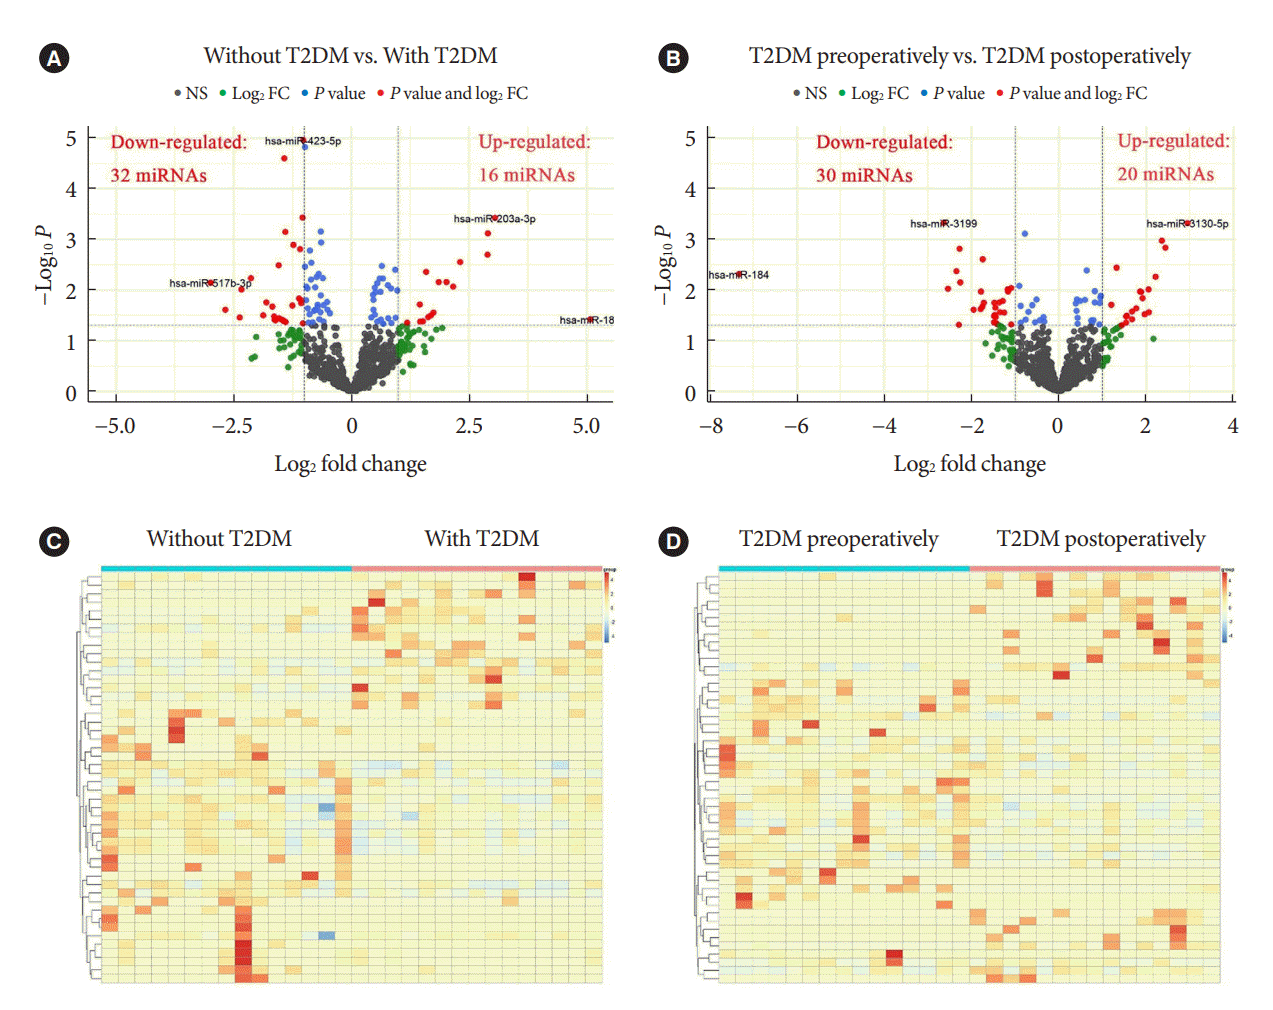
Known miRNAs were identified by mapping with databases such as Bowtie, mirdeep2, miRBase, etc. Intercomparison of different groups was performed after edgeR package normalization process. We define log2 FC >1 and P<0.05 as DEMs with up-regulated expression, while log2 FC <1 and P<0.05 as DEMs with down-regulated expression. When compared to patients with obesity but without T2DM, patients with both T2DM and obesity demonstrated 16 up-regulated DEMs and 32 down-regulated DEMs (red dots in Fig. 1A). In addition, T2DM patients with obesity displayed 20 up-regulated DEMs and 30 down-regulated DEMs postoperatively relative to preoperatively (red dots in Fig. 1B). The volcano maps showed several DEMs with the most significant or largest fold change. Furthermore, cluster comparison by heatmaps found that DEMs of different groups were significantly different (Fig. 1C and D). These data indicated that miRNAs expression profiles were different in patients with obesity, either with and without T2DM, or before and after bariatric surgery.

The intersection of DEMs in different groups

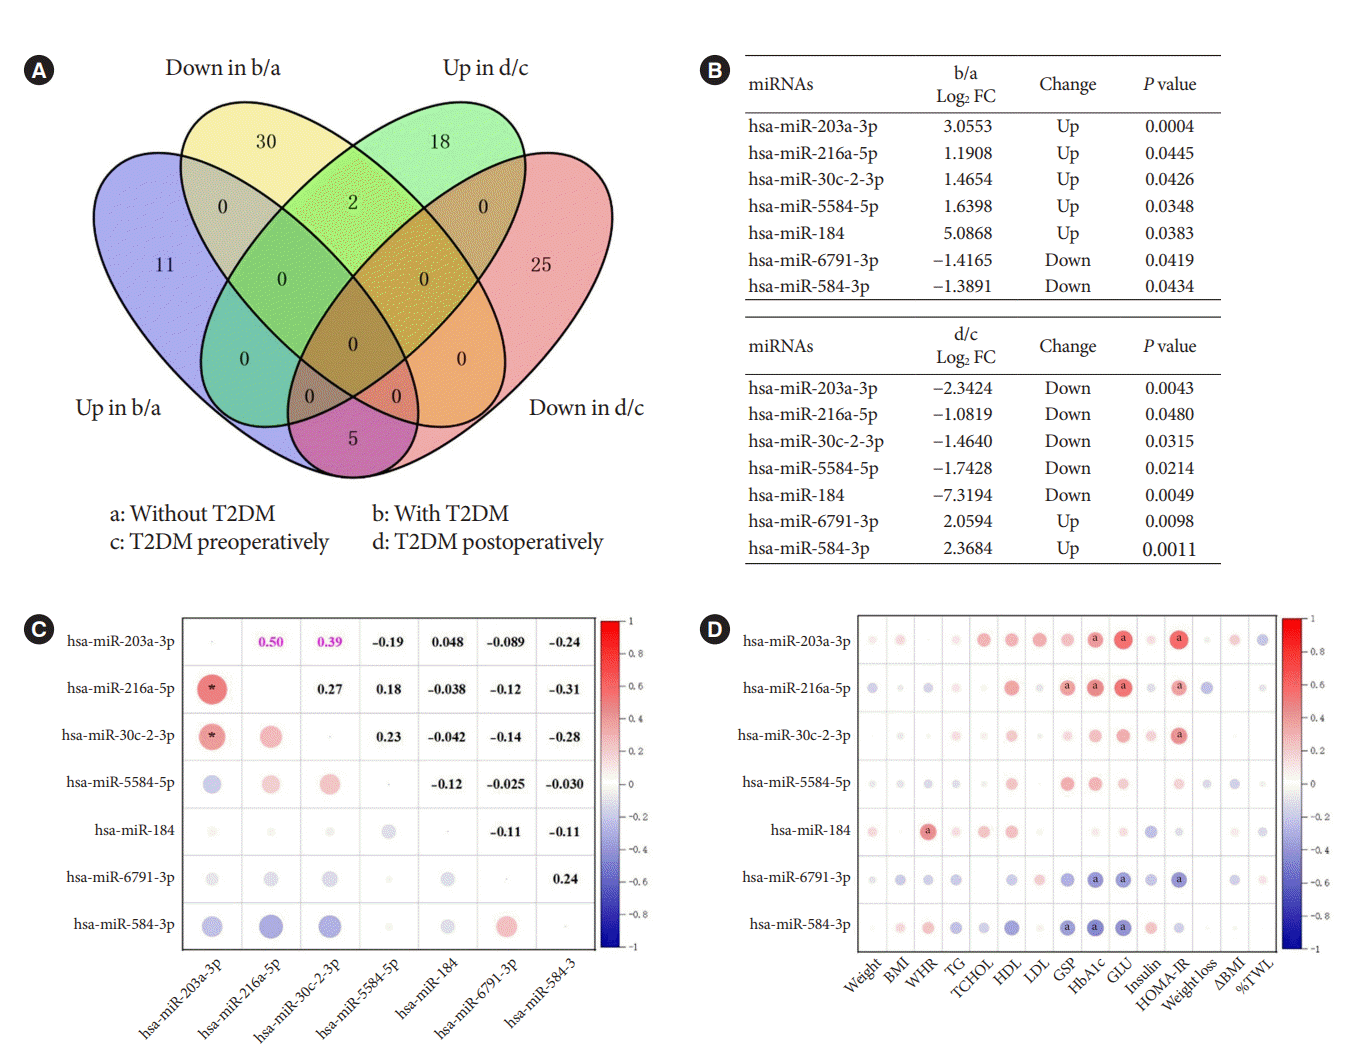
In the previous analysis, we identified DEMs in obesity with and without T2DM, and DEMs in obesity with T2DM before and after bariatric surgery. To investigate the pathogenesis of T2DM in patients with obesity and the possible mechanism of remission after bariatric surgery, we used Venn diagrams to intersect the aforementioned DEMs and find their co-varying DEMs (Fig. 2A). We finally found seven co-variant DEMs (Fig. 2B). While compared to obesity without T2DM, hsa-miR-203a-3p, hsa-miR-216a-5p, hsa-miR-30c-2-3p, hsa-miR-5584-5p, and hsa-miR-184 were up-regulated in obesity with T2DM. However, they were indeed down-regulated in obesity with T2DM 1 month after surgery. This was an interesting finding, demonstrating that the increased expression of these miRNAs might be associated with the onset, and progression of T2DM. In contrast, the opposite results were observed for hsa-miR6791-3p and hsa-miR-584-3p, suggesting that a decrease in their expression correlated with progression of T2DM and an increase in their expression correlated with postoperative remission of T2DM.
As the two most prevailing procedures for bariatric surgery, SG and RYGB might also differ in the expression of miRNAs before and after surgery, denoting different mechanisms. Consequently, we used the surgical procedures as subgroups to profile the changes of these seven miRNAs which are extremely associated with T2DM. As shown in Supplementary Table 2, hsa-miR-216a-5p (P=0.013) was down-regulated after SG surgery, which was consistent with the trend of change in Fig. 2B. However, hsa-miR-203a-3p (P=0.000) and hsa-miR-30c-2-3p (P=0.004) were rising after RYGB surgery, contradicting the trend of Fig. 2B. These differences might be caused by the low or even zero expression of these seven miRNAs in some cases when analyzed by surgical methods as subgroup.
In further, Pearson’s correlation analysis of the seven miRNAs from 30 patients preoperatively revealed a significant positive correlation between hsa-miR-203a-3p and hsa-miR-216a-5p (r=0.50, P<0.05), and hsa-miR-203a-3p and hsa-miR-30c-2-3p (r=0.39, P<0.05) (Fig. 2C). Their trends were also the same in both groups, indicating their mutual synergistic relationship within them. To initially validate the relationship between these miRNAs and T2DM, we further subjected these preoperative miRNAs and clinical characteristics of 30 preoperative patients to Pearson correlation analysis. The expression of preoperative miRNAs was all represented by log CPM. Most of the five miRNAs up-regulated in T2DM patients with obesity were positively correlated with glucose metabolism indicators such as GSP, HbA1c, GLU and HOMA-IR, while the two down-regulated miRNAs were negatively correlated with these indicators (Fig. 2D). These results further characterized the changes of these seven miRNAs in T2DM.
It is worth noting that not all patients with T2DM could be relieved by bariatric surgery. To discriminate the DEMs between the T2DM remission group and the T2DM non-remission group after bariatric surgery, we defined T2DM remission as fasting glucose ≥7.00 mmol/L and T2DM non-remission otherwise. As shown in Supplementary Fig. 1A and B, there were a total of 69 DEMs in the T2DM remission group, while there were a total of 17 DEMs in the T2DM non-remission group. There was little overlap in the miRNAs profiles of the two groups, except for one miRNA. We further analyzed the change characteristics of the above seven miRNAs that are extremely associated with T2DM in both groups. As displayed in Supplementary Fig. 1C and D, we discovered that all these seven miRNAs were significantly changed in the T2DM remission group, which was almost consistent with the results in Fig. 2B. In contrast, in the T2DM non-remission group, these seven miRNAs were not significantly altered before and after surgery. These results further illustrated the crucial regulatory role of these seven miRNAs in T2DM.

GO and KEGG enrichment analysis

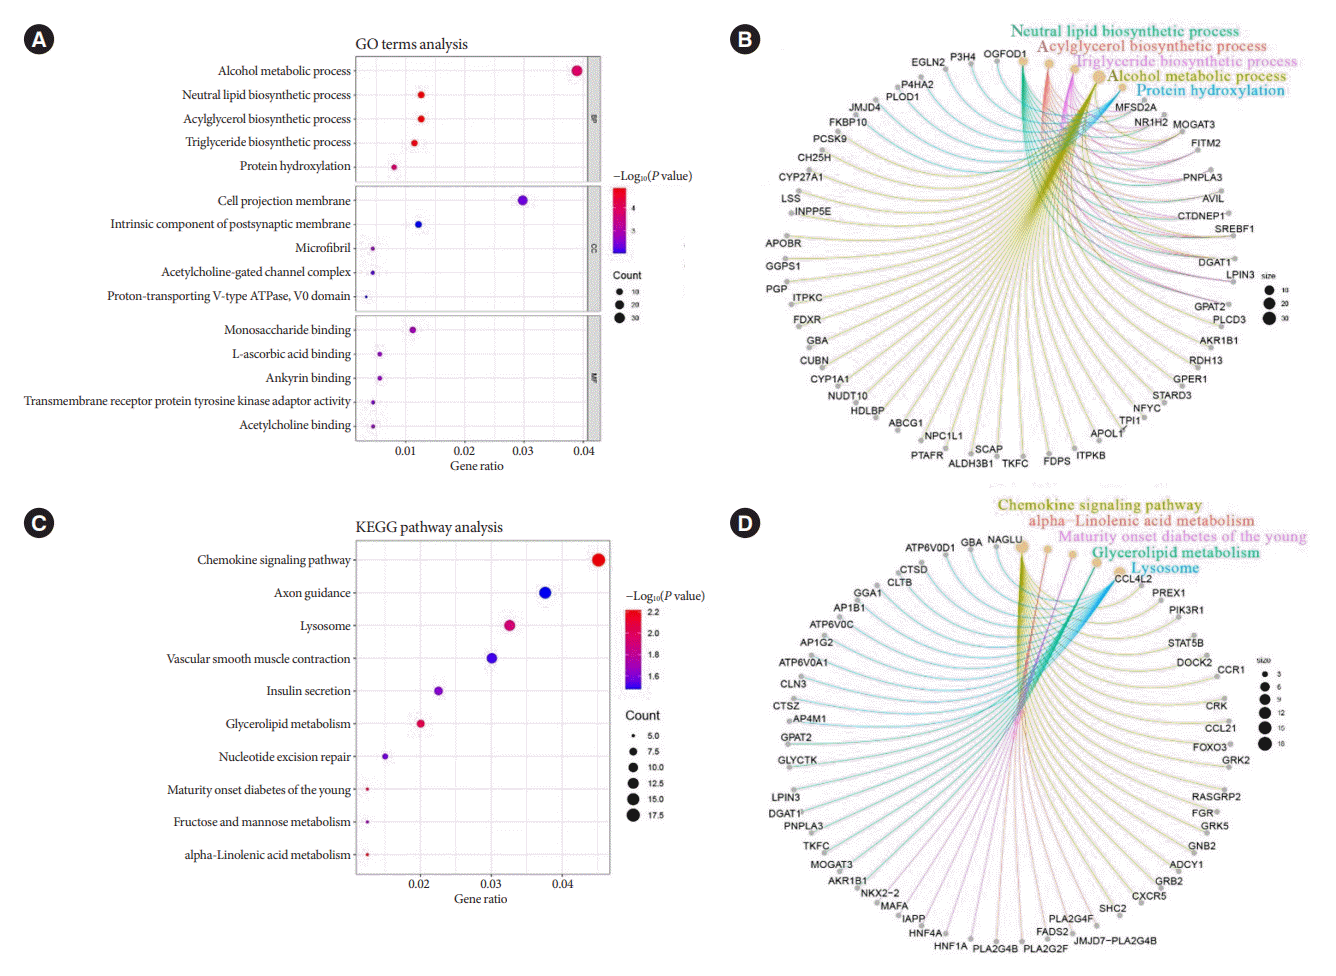
The predicted target genes of the seven miRNAs were identified by taking the intersection of miRanda and RNAhybrid databases for subsequent analysis. Fig. 3A showed the five most significant terms of GO terms in the three major annotation categories of BP, cellular component, and molecular function, respectively. Among all the taxonomic annotations, the five most significant ones were neutral lipid biosynthetic process, acylglycerol biosynthetic process, TG biosynthetic process, alcohol metabolic process, and protein hydroxylation, respectively. The correlation between the taxonomic annotations and the target genes was shown in Fig. 3B. Correspondingly, Fig. 3C and D presented the KEGG pathway analysis and the correlation of the five most significant pathways with the target genes. The five most significant pathways were chemokine signaling pathway, alpha-linolenic acid metabolism, Maturity onset diabetes of the young, glycerolipid metabolism, and lysosome, respectively. Both GO terms analysis and KEGG pathway analysis revealed important links between the target genes of the seven miRNAs and glycolipid metabolism.

Hub gene analysis

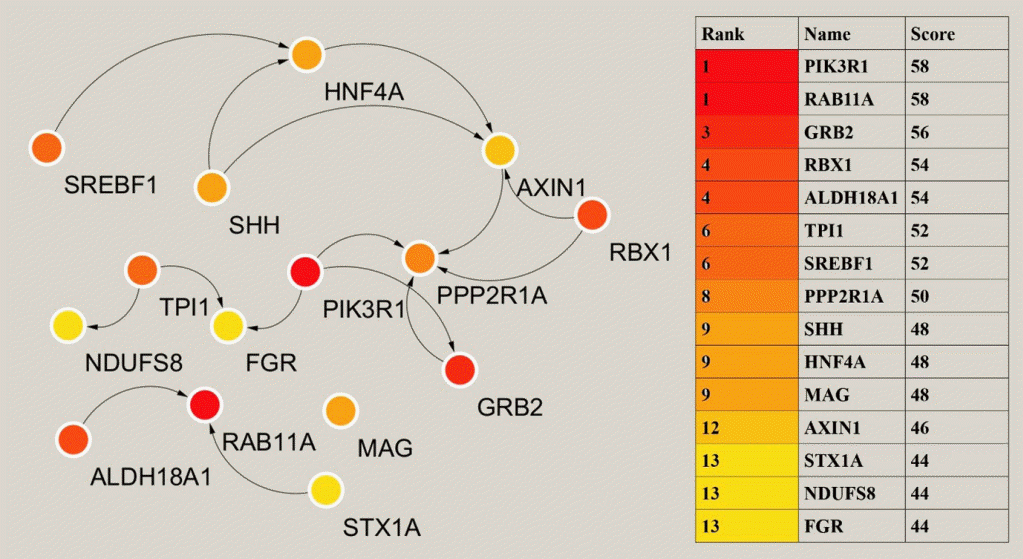
The analysis of key or central genes is beneficial to find the most representative genes in regulating T2DM. To obtain them, we imported the list of target genes into STRING database, and then performed hub genes analysis by Cytoscape’s plugin cytoHubba. CytoHubba provided 11 models for analysis, and we finally chose the degree method to rank the top 15 hub genes. The relationship and specific names between the top 15 hub genes were shown in Fig. 4.

DISCUSSION

MiRNAs are related to multiple aspects of glycolipid metabolism involved in T2DM and may play a role in the pathogenesis of obesity and its associated complications. Zampetaki et al. [20] revealed the characteristics of plasma miRNAs in diabetic patients, while 13 candidate miRNAs were identified. A growing number of studies have demonstrated that miRNAs and insulin resistance [17,21,22], glucose metabolism [15,16,23], lipid metabolism [24,25], and β-cell function [26,27] were closely related, and these altered miRNAs may be potential targets for the prediction and treatment of T2DM. Bariatric surgery is considered the most effective intervention for the treatment of obesity and T2DM, with significant weight loss and remission of T2DM in the short term [28], and this effect is durable. It has been shown that some miRNAs changed significantly after bariatric surgery and that these miRNAs played an important and unique role in improving metabolic indicators rather than acting through weight reduction or body fat factors [29-32], explaining to some extent the mechanisms involved in T2DM remission after bariatric surgery. Atkin et al. [9] analyzed 29 patients with severe obesity and diabetes who underwent RYGB surgery, and they found significant changes in seven miRNAs 21 days after bariatric surgery, which occurred prior to significant weight loss. We strongly approve of the clinical relevance of the study by Atkin et al. [9]. Unfortunately, they did not perform further functional categorization of miRNAs, analysis of the relationship with clinical characteristics, or prediction of relevant target genes. These elements were supplemented in our work.
In the present study, we performed a comparative analysis of serum miRNAs in patients with and without T2DM in obesity to find the DEMs of both. Then, we found significant improvements in metabolic indicators in obesity with T2DM at 1 month after bariatric surgery. Based on this, we further analyzed the characteristics of DEMs before and after surgery. We pooled the above DEMs for analysis to identify co-variant miRNAs and map the miRNAs profiles of T2DM patients with obesity, which might reveal the mechanisms of T2DM progression in obesity and remission in bariatric surgery. We finally found seven co-altered miRNAs that might be key miRNAs in the regulation of T2DM. Relative to obesity without T2DM, obesity with T2DM had five up-regulated miRNAs and two down-regulated miRNAs that changed in opposite ways after bariatric surgery for obesity with T2DM.
Although most studies have found that these seven miRNAs are associated with cancer, some previous studies have reported the possible mechanisms of action of these miRNAs. Zhang et al. [33] found elevated plasma miR-203a-3p levels in a rat hyperlipidemia model and verified that atorvastatin functions as a regulator of lipids by inhibiting the expression of miR203a-3p. MiR-216a-5p might play a role in diabetic nephropathy [34]. In mice fed a high-fat diet, miR-30c-2-3p was found to be significantly up-regulated in brown fat, inducing adipogenesis and inflammatory stress, which in turn affects energy metabolism [35]. These studies demonstrated the important role of the above mentioned miRNAs in glycolipid metabolism. Further Pearson correlation analysis of these miRNAs with clinical characteristics revealed that most of the five previously mentioned miRNAs were positively correlated with glucose metabolic indexes and insulin resistance, suggesting that their increase induces the development of T2DM. The other two miRNAs were negatively correlated with these metabolic indicators, suggesting that their decrease would likewise lead to the development of T2DM. Moreover, the target genes enrichment analysis of these seven miRNAs demonstrated the terms or pathways associated with T2DM in both the five most significant GO terms and the five most significant KEGG pathways. In addition to this, the expression profiles of miRNAs differ in SG and RYGB surgeries, which might indicate different mechanisms [36]. When we analyzed the changes of seven miRNAs before and after surgery using the surgical procedures as subgroups, we found that their change characteristics differed from the above results. Future studies should delve into the expression profiles of miRNAs in the very short term with different surgical strategies.
MiRNAs exert their effects by regulating gene expression, and we therefore, predicted the target genes of miRNAs. The hub genes were further analyzed by Cytoscape to identify the genes at the center and reveal the key regulatory genes of T2DM in patients with obesity. Phosphoinositide-3-kinase regulatory subunit 1 (PIK3R1) plays an important role in the metabolic action of insulin and is required for increased glucose uptake and glycogen synthesis in insulin-stimulated insulin-sensitive tissues, and mutations in this gene are associated with insulin resistance [37,38]. PIK3R1 was one of the highest scoring genes in hub genes analysis. FGR proto-oncogene, Src family tyrosine kinase (FGR) promotes the phosphorylation of PIK3R1 thereby facilitating its activation [39]. Triosephate isomerase 1 (TPI1) encodes an enzyme consisting of two identical proteins that catalyze the isomerization of glyceraldehyde 3-phosphate and dihydroxyacetone phosphate during glycolysis and gluconeogenesis [40]. Mutations in this gene have been associated with a deficiency of propanose phosphate isomerase, and related pathways include glucose metabolism. Sterol regulatory element binding transcription factor 1 (SREBF1) regulates metabolism and the mammalian target of rapamycin (mTOR) signaling pathway, and is a key transcription factor regulating gene expression of cholesterol biosynthesis and lipid homeostasis [41]. It plays a role in the nutritional regulation of fatty acids and TG in lipogenic organs [42]. Syntaxin 1A (STX1A) encodes a member of the synaptic protein superfamily that plays an important role in the cytokinesis and endocytosis of hormones and neurotransmitters [43], and has also been shown to have a similar role in the cytokinesis of hormones such as insulin or glucagon-like peptide 1 [44]. NADH: ubiquinone oxidoreductase core subunit S8 (NDUFS8) encodes a subunit of mitochondrial nicotinamide adenine dinucleotide (NADH) that catalyzes the electron transfer of NADH through the respiratory chain and is closely involved in respiratory electron transport, adenosine triphosphate (ATP) synthesis and uncoupling protein thermogenesis, potentially a key gene for improved energy metabolism after bariatric surgery [45,46]. These hub genes regulate multiple aspects related to T2DM and are highly promising therapeutic targets.
Overall, we depicted miRNAs profiles for obesity with T2DM relative to obesity without T2DM, as well as for T2DM patients postoperatively relative to T2DM patients preoperatively. Further analysis intersected seven miRNAs that showed opposite features of change in the two miRNAs profiles, suggesting their important role in T2DM. The seven screened miRNAs showed different expression profiles in SG and RYGB. Target genes analysis of miRNAs revealed enrichment patterns for most of these target genes associated with T2DM, both in GO terms and in the KEGG pathway. We also identified genes that might be key regulators of T2DM. These findings certainly provided targets that could be intervened in the management of T2DM.

SUPPLEMENTARY MATERIALS

Supplementary materials related to this article can be found online at https://doi.org/10.4093/dmj.2022.0226.
Supplementary Table 1.
Preoperative and postoperative clinical characteristics in SG or RYGB
dmj-2022-0226-Supplementary-Table-1.pdf
Supplementary Table 2.
Characterization of changes in the selected seven miRNAs before and after SG or RYGB
dmj-2022-0226-Supplementary-Table-2.pdf
Supplementary Fig. 1.
Supplementary Fig. 1. MicroRNAs (miRNAs) profiles of type 2 diabetes mellitus (T2DM) in remission and T2DM not in remission after bariatric surgery. Volcano plots of differentially expressed miRNAs before and after surgery in the T2DM remission group (A) and in the T2DM non-remission group (B). The red dots of the volcano plots indicated differentially expressed miRNAs, which meant that |log2 fold change (FC)| >1 and P<0.05. Characterization of changes in the selected seven miRNAs in the T2DM remission group (C) and the T2DM non-remission group (D). NS, no significant.
dmj-2022-0226-Supplementary-Fig-1.pdf

Notes

CONFLICTS OF INTEREST

No potential conflict of interest relevant to this article was reported.

AUTHOR CONTRIBUTIONS

Conception or design: G.L., H.G.

Acquisition, analysis, or interpretation of data: G.L., H.G., Z. D., S.J.

Drafting the work or revising: G.L.

Final approval of the manuscript: G.L., H.G., Z.D., S.J., R.H., C.W.

FUNDING

This research was sponsored by the flagship specialty construction project-general surgery of The First Affiliated Hospital of Jinan University (Funding No.: 711003) and The First Affiliated Hospital of Jinan University self-raised talent introduction research start-up fee (Funding No.: 702016).

ACKNOWLEDGMENTS

We would like to express our gratitude for the preservation of blood samples in the Biobank of The First Affiliated Hospital of Jinan University.

REFERENCES

1. Swinburn BA, Sacks G, Hall KD, McPherson K, Finegood DT, Moodie ML, et al. The global obesity pandemic: shaped by global drivers and local environments. Lancet. 2011; 378:804–14.
crossref
2. NCD Risk Factor Collaboration (NCD-RisC). Worldwide trends in body-mass index, underweight, overweight, and obesity from 1975 to 2016: a pooled analysis of 2416 population-based measurement studies in 128.9 million children, adolescents, and adults. Lancet. 2017; 390:2627–42.
3. Hu W, Ding Y, Wang S, Xu L, Yu H. The construction and analysis of the aberrant lncRNA-miRNA-mRNA network in adipose tissue from type 2 diabetes individuals with obesity. J Diabetes Res. 2020; 2020:3980742.
crossref
4. Sangiao-Alvarellos S, Theofilatos K, Barwari T, Gutmann C, Takov K, Singh B, et al. Metabolic recovery after weight loss surgery is reflected in serum microRNAs. BMJ Open Diabetes Res Care. 2020; 8:e001441.
crossref
5. Schauer PR, Bhatt DL, Kirwan JP, Wolski K, Aminian A, Brethauer SA, et al. Bariatric surgery versus intensive medical therapy for diabetes: 5-year outcomes. N Engl J Med. 2017; 376:641–51.
crossref
6. Inge TH, Courcoulas AP, Jenkins TM, Michalsky MP, Helmrath MA, Brandt ML, et al. Weight loss and health status 3 years after bariatric surgery in adolescents. N Engl J Med. 2016; 374:113–23.
crossref
7. Schauer PR, Bhatt DL, Kirwan JP, Wolski K, Brethauer SA, Navaneethan SD, et al. Bariatric surgery versus intensive medical therapy for diabetes: 3-year outcomes. N Engl J Med. 2014; 370:2002–13.
crossref
8. Mingrone G, Panunzi S, De Gaetano A, Guidone C, Iaconelli A, Leccesi L, et al. Bariatric surgery versus conventional medical therapy for type 2 diabetes. N Engl J Med. 2012; 366:1577–85.
crossref
9. Atkin SL, Ramachandran V, Yousri NA, Benurwar M, Simper SC, McKinlay R, et al. Changes in blood microRNA expression and early metabolic responsiveness 21 days following bariatric surgery. Front Endocrinol (Lausanne). 2019; 9:773.
crossref
10. Manoel Alves J, Handerson Gomes Teles R, do Valle Gomes Gatto C, Munoz VR, Regina Cominetti M, Garcia de Oliveira Duarte AC. Mapping research in the obesity, adipose tissue, and microRNA field: a bibliometric analysis. Cells. 2019; 8:1581.
crossref
11. Hobert O. Gene regulation by transcription factors and microRNAs. Science. 2008; 319:1785–6.
crossref
12. Arner P, Kulyte A. MicroRNA regulatory networks in human adipose tissue and obesity. Nat Rev Endocrinol. 2015; 11:276–88.
crossref
13. Bae YU, Kim Y, Lee H, Kim H, Jeon JS, Noh H, et al. Bariatric surgery alters microRNA content of circulating exosomes in patients with obesity. Obesity (Silver Spring). 2019; 27:264–71.
crossref
14. Al-Rawaf HA. Circulating microRNAs and adipokines as markers of metabolic syndrome in adolescents with obesity. Clin Nutr. 2019; 38:2231–8.
crossref
15. Ji C, Guo X. The clinical potential of circulating microRNAs in obesity. Nat Rev Endocrinol. 2019; 15:731–43.
crossref
16. Fu X, Dong B, Tian Y, Lefebvre P, Meng Z, Wang X, et al. MicroRNA-26a regulates insulin sensitivity and metabolism of glucose and lipids. J Clin Invest. 2015; 125:2497–509.
crossref
17. Trajkovski M, Hausser J, Soutschek J, Bhat B, Akin A, Zavolan M, et al. MicroRNAs 103 and 107 regulate insulin sensitivity. Nature. 2011; 474:649–53.
crossref
18. Dehwah MA, Xu A, Huang Q. MicroRNAs and type 2 diabetes/obesity. J Genet Genomics. 2012; 39:11–8.
crossref
19. Jones A, Danielson KM, Benton MC, Ziegler O, Shah R, Stubbs RS, et al. miRNA signatures of insulin resistance in obesity. Obesity (Silver Spring). 2017; 25:1734–44.
crossref
20. Zampetaki A, Kiechl S, Drozdov I, Willeit P, Mayr U, Prokopi M, et al. Plasma microRNA profiling reveals loss of endothelial miR-126 and other microRNAs in type 2 diabetes. Circ Res. 2010; 107:810–7.
crossref
21. Lozano-Bartolome J, Llaurado G, Portero-Otin M, Altuna-Coy A, Rojo-Martinez G, Vendrell J, et al. Altered expression of miR-181a-5p and miR-23a-3p is associated with obesity and TNFα-induced insulin resistance. J Clin Endocrinol Metab. 2018; 103:1447–58.
crossref
22. Liu R, Wang M, Li E, Yang Y, Li J, Chen S, et al. Dysregulation of microRNA-125a contributes to obesity-associated insulin resistance and dysregulates lipid metabolism in mice. Biochim Biophys Acta Mol Cell Biol Lipids. 2020; 1865:158640.
crossref
23. Villard A, Marchand L, Thivolet C, Rome S. Diagnostic value of cell-free circulating MicroRNAs for obesity and type 2 diabetes: a meta-analysis. J Mol Biomark Diagn. 2015; 6:251.
crossref
24. Liao CH, Wang CY, Liu KH, Liu YY, Wen MS, Yeh TS. MiR122 marks the differences between subcutaneous and visceral adipose tissues and associates with the outcome of bariatric surgery. Obes Res Clin Pract. 2018; 12:570–7.
crossref
25. Gentile AM, Lhamyani S, Coin-Araguez L, Clemente-Postigo M, Oliva Olivera W, Romero-Zerbo SY, et al. miR-20b, miR296, and Let-7f expression in human adipose tissue is related to obesity and type 2 diabetes. Obesity (Silver Spring). 2019; 27:245–54.
26. Joglekar MV, Joglekar VM, Hardikar AA. Expression of isletspecific microRNAs during human pancreatic development. Gene Expr Patterns. 2009; 9:109–13.
crossref
27. Pullen TJ, da Silva Xavier G, Kelsey G, Rutter GA. miR-29a and miR-29b contribute to pancreatic beta-cell-specific silencing of monocarboxylate transporter 1 (Mct1). Mol Cell Biol. 2011; 31:3182–94.
28. Wu Q, Li JV, Seyfried F, le Roux CW, Ashrafian H, Athanasiou T, et al. Metabolic phenotype-microRNA data fusion analysis of the systemic consequences of Roux-en-Y gastric bypass surgery. Int J Obes (Lond). 2015; 39:1126–34.
crossref
29. Rega-Kaun G, Kaun C, Jaegersberger G, Prager M, Hackl M, Demyanets S, et al. Roux-en-Y-bariatric surgery reduces markers of metabolic syndrome in morbidly obese patients. Obes Surg. 2020; 30:391–400.
crossref
30. Zhu Z, Yin J, Li DC, Mao ZQ. Role of microRNAs in the treatment of type 2 diabetes mellitus with Roux-en-Y gastric bypass. Braz J Med Biol Res. 2017; 50:e5817.
crossref
31. Lirun K, Sewe M, Yong W. A pilot study: the effect of Roux-enY gastric bypass on the serum microRNAs of the type 2 diabetes patient. Obes Surg. 2015; 25:2386–92.
crossref
32. Breininger SP, Sabater L, Malcomson FC, Afshar S, Mann J, Mathers JC. Obesity and Roux-en-Y gastric bypass drive changes in miR-31 and miR-215 expression in the human rectal mucosa. Int J Obes (Lond). 2022; 46:333–41.
crossref
33. Zhang JJ, Zhang YZ, Peng JJ, Li NS, Xiong XM, Ma QL, et al. Atorvastatin exerts inhibitory effect on endothelial senescence in hyperlipidemic rats through a mechanism involving down-regulation of miR-21-5p/203a-3p. Mech Ageing Dev. 2018; 169:10–8.
crossref
34. Meng Q, Zhai X, Yuan Y, Ji Q, Zhang P. lncRNA ZEB1-AS1 inhibits high glucose-induced EMT and fibrogenesis by regulating the miR-216a-5p/BMP7 axis in diabetic nephropathy. Braz J Med Biol Res. 2020; 53:e9288.
crossref
35. Wijayatunga NN, Pahlavani M, Kalupahana NS, Kottapalli KR, Gunaratne PH, Coarfa C, et al. An integrative transcriptomic approach to identify depot differences in genes and microRNAs in adipose tissues from high fat fed mice. Oncotarget. 2018; 9:9246–61.
crossref
36. Langi G, Szczerbinski L, Kretowski A. Meta-analysis of differential miRNA expression after bariatric surgery. J Clin Med. 2019; 8:1220.
crossref
37. Winnay JN, Boucher J, Mori MA, Ueki K, Kahn CR. A regulatory subunit of phosphoinositide 3-kinase increases the nuclear accumulation of X-box-binding protein-1 to modulate the unfolded protein response. Nat Med. 2010; 16:438–45.
crossref
38. Bandyopadhyay GK, Yu JG, Ofrecio J, Olefsky JM. Increased p85/55/50 expression and decreased phosphotidylinositol 3-kinase activity in insulin-resistant human skeletal muscle. Diabetes. 2005; 54:2351–9.
crossref
39. Axelsson L, Hellberg C, Melander F, Smith D, Zheng L, Andersson T. Clustering of beta(2)-integrins on human neutrophils activates dual signaling pathways to PtdIns 3-kinase. Exp Cell Res. 2000; 256:257–63.
40. Olah J, Orosz F, Puskas LG, Hackler L, Horanyi M, Polgar L, et al. Triosephosphate isomerase deficiency: consequences of an inherited mutation at mRNA, protein and metabolic levels. Biochem J. 2005; 392(Pt 3):675–83.
crossref
41. Amemiya-Kudo M, Shimano H, Hasty AH, Yahagi N, Yoshikawa T, Matsuzaka T, et al. Transcriptional activities of nuclear SREBP-1a, -1c, and -2 to different target promoters of lipogenic and cholesterogenic genes. J Lipid Res. 2002; 43:1220–35.
crossref
42. Xu D, Wang Z, Xia Y, Shao F, Xia W, Wei Y, et al. The gluconeogenic enzyme PCK1 phosphorylates INSIG1/2 for lipogenesis. Nature. 2020; 580:530–5.
crossref
43. Craig TJ, Anderson D, Evans AJ, Girach F, Henley JM. SUMOylation of Syntaxin1A regulates presynaptic endocytosis. Sci Rep. 2015; 5:17669.
crossref
44. Romeo S, Sentinelli F, Cavallo MG, Leonetti F, Fallarino M, Mariotti S, et al. Search for genetic variants of the SYNTAXIN 1A (STX1A) gene: the -352 A>T variant in the STX1A promoter associates with impaired glucose metabolism in an Italian obese population. Int J Obes (Lond). 2008; 32:413–20.
crossref
45. Machado AK, Andreazza AC, da Silva TM, Boligon AA, do Nascimento V, Scola G, et al. Neuroprotective effects of Açaí (Euterpe oleracea Mart.) against rotenone in vitro exposure. Oxid Med Cell Longev. 2016; 2016:8940850.
46. Haack TB, Haberberger B, Frisch EM, Wieland T, Iuso A, Gorza M, et al. Molecular diagnosis in mitochondrial complex I deficiency using exome sequencing. J Med Genet. 2012; 49:277–83.
crossref

Fig. 1.
Volcano plots and heatmaps analysis of differentially expressed microRNAs (DEMs). Volcano plot (A) and heatmap cluster (C) analysis of DEMs between the absence and presence of type 2 diabetes mellitus (T2DM) in patients with obesity. Volcano plot (B) and heatmap cluster (D) analysis of DEMs before and after bariatric surgery in T2DM patients with obesity. The red dots of the volcano plots indicated DEMs, which meant that |log2 fold change (FC)| >1 and P<0.05. NS, no significant.
dmj-2022-0226f1.tif
Fig. 2.
The intersection of up- and down-regulated differentially expressed microRNAs (DEMs) from different groups and correlation analysis. (A) Venn diagram showed the intersection. (B) The specific DEMs that were produced by the intersection. (C) Pearson correlations of the seven microRNAs (miRNAs) from 30 patients preoperatively. (D) Pearson correlations of seven preoperative miRNAs at the intersection with preoperative clinical characteristics. The color bar on the right represented the correlation coefficient, with red for positive correlation and blue for negative correlation. The expression of preoperative miRNAs was all represented by log counts per million. T2DM, type 2 diabetes mellitus; FC, fold change; BMI, body mass index; WHR, waist to hip ratio; TG, triglyceride; TCHOL, total cholesterol; HDL, high density lipoprotein; LDL, low density lipoprotein; GSP, glycated serum protein; HbA1c, glycosylated hemoglobin; GLU, fasting glucose; HOMA-IR, homeostasis model assessment of insulin resistance; ∆BMI, changes in BMI; %TWL, percentage total weight loss. aP<0.05.
dmj-2022-0226f2.tif
Fig. 3.
Target genes analysis predicted by the screened seven microRNAs (miRNAs). (A) Gene Ontology (GO) terms analysis of target genes. (B) Interaction network of GO terms and target genes. (C) Kyoto Encyclopedia of Genes and Genomes (KEGG) pathway analysis of target genes. (D) Interaction network of KEGG pathway and target genes. Gene ratio indicated the ratio of the number of genes associated with the term or pathway to the total number of the entire gene. All P values were less than 0.05.
dmj-2022-0226f3.tif
Fig. 4.
Analysis of the hub genes. The left showed the relationship of the top 15 hub genes. On the right was the ranking of the 15 hub genes and the score of the degree model algorithm by cytoHubba. HNF4A, hepatocyte nuclear factor 4 alpha; SREBF1, sterol regulatory element binding transcription factor 1; SHH, sonic hedgehog signaling molecule; AXIN1, axis inhibition protein 1; RBX1, ring-box 1; TPI1, triosephate isomerase 1; PIK3R1, phosphoinositide-3-kinase regulatory subunit 1; PPP2R1A, protein phosphatase 2 scaffold subunit aalpha; NDUFS8, NADH: ubiquinone oxidoreductase core subunit S8; FGR, FGR proto-oncogene, Src family tyrosine kinase; ALDH18A1, aldehyde dehydrogenase 18 family member A1; RAB11A, member RAS oncogene family; MAG, myelin associated glycoprotein; GRB2, growth factor receptor bound protein 2; STX1A, syntaxin 1A.
dmj-2022-0226f4.tif
Table 1.
The clinical characteristics of patients with obesity in different groups
Characteristic Without T2DM (n=15) With T2DM (preoperatively) (n=15) T2DM postoperatively (n=15) P1a P2b
Procedure, SG/RYGB 10/5 7/8 - 0.462 -
Age, yr 28.67±8.04 33.67±6.74 - 0.075 -
Sex, male/female 5/10 5/10 - 1.000 -
Weight, kg 113.17±24.81 114.35±27.69 102.27±25.71 0.903 0.000c
BMI, kg/m2 41.41±7.66 41.15±8.39 36.20±7.34 0.931 0.000c
WHR 0.96±0.07 0.98±0.08 0.95±0.06 0.382 0.179
TG, mmol/L 1.52±0.63 2.41±1.75 1.52±0.71 0.081 0.022c
TCHOL, mmol/L 5.21±0.77 5.49±0.89 4.76±0.92 0.366 0.025c
HDL, mmol/L 1.03±0.20 1.15±0.17 0.99±0.11 0.099 0.001c
LDL, mmol/L 3.24±0.58 3.16±0.58 2.78±0.73 0.700 0.088
GSP, µmol/L 137.86±22.73 214.29±94.46 148.93±30.05 0.008c 0.003c
HbA1c, % 5.53±0.31 8.23±2.18 6.82±1.23 0.000c 0.000c
GLU, mmol/L 5.16±0.66 9.75±4.24 5.86±1.00 0.001c 0.002c
Insulin, mIU/L 24.24±14.46 24.76±13.16 12.32±6.56 0.918 0.004c
HOMA-IR 5.73±3.81 10.21±5.48 3.25±2.08 0.015c 0.000c
Weight loss, kg 11.52±3.39 12.08±2.72 - 0.621 -
∆BMI, kg/m2 4.35±1.25 4.95±1.48 - 0.240 -
%TWL 10.23±2.15 10.78±2.10 - 0.482 -

Values are presented as mean±standard deviation.

T2DM, type 2 diabetes mellitus; SG, sleeve gastrectomy; RYGB, Roux-en-Y gastric bypass; BMI, body mass index; WHR, waist to hip ratio; TG, triglyceride; TCHOL, total cholesterol; HDL, high density lipoprotein; LDL, low density lipoprotein; GSP, glycated serum protein; HbA1c, glycosylated hemoglobin; GLU, fasting glucose; HOMA-IR, homeostasis model assessment of insulin resistance; ΔBMI, changes in BMI; %TWL, percentage total weight loss.

a P1 indicated comparison between patients without T2DM and those with T2DM preoperatively. Measured variables were counted using two independent samples t-test and categorical variables were calculated by applying Fisher’s exact test,

b P2 represented the paired sample t-test between preoperative and postoperative patients with T2DM,

c P values less than 0.05.

TOOLS
Similar articles