

 PDF
PDF Citation
 Print
Print


INTRODUCTION
METHODS
Data source and study population
Definition of T2DM and DKD phenotype
Laboratory and clinical examination
Operational definitions for comorbidities
Outcome
Statistical analysis
RESULTS
Baseline characteristics of study subjects
Table 1.
|
First examination (2009–2012) |
Group 1a (GFRnorPU−), 91.9% |
Group 2a (GFRnorPU+), 4.8% |
Group 3a (GFRlowPU−), 3.3% |
P value | ||||||||
|---|---|---|---|---|---|---|---|---|---|---|---|---|
|
Second examination (2011–2014) |
Group 1a (GFRnorPU−) |
Group 2a (GFRnorPU−) |
Group 3b (GFRlowPU−) |
Group 4b (GFRlowPU+) |
Group 1a (GFRnorPU−) |
Group 2a (GFRnorPU−) |
Group 3b (GFRlowPU−) |
Group 4b (GFRlowPU+) |
Group 3b (GFRlowPU−) |
Group 4b (GFRlowPU+) |
||
| Category of changes in DKD phenotype | 1→1 | 1→2 | 1→3 | 1→4 | 2→1 | 2→2 | 2→3 | 2→4 | 3→3 | 3→4 | ||
| Number | 1,132,531 (84.3) | 39,584 (2.9) | 58,347 (4.3) | 3,990 (0.3) | 41,799 (3.1) | 15,619 (1.2) | 3,523 (0.3) | 2,908 (0.2) | 40,963 (3.0) | 3,852 (0.3) | ||
| Male sex | 738,987 (65.3) | 27,970 (70.7) | 26,926 (46.2) | 2,355 (59.0) | 28,655 (68.6) | 12,060 (77.2) | 1,967 (55.8) | 2,099 (72.2) | 17,102 (41.8) | 2,071 (53.86) | <0.001 | |
| Age, yr | 56.3±11.9 | 57.3±11.7 | 66.4±9.7 | 65.2±10.1 | 57.2±11.3 | 57.5±11.0 | 66.0±9.7 | 62.8±10.0 | 70.1±8.3 | 68.7±9.1 | <0.001 | |
| BMI, kg/m2 | 24.9±3.3 | 25.5±3.6 | 25.1±3.2 | 25.2±3.4 | 25.4±3.5 | 25.8±3.7 | 25.4±3.4 | 25.2±3.4 | 25.1±3.3 | 25.1±3.4 | <0.001 | |
| WC, cm | 84.9±8.5 | 86.9±8.9 | 85.6±8.5 | 86.8±8.6 | 86.5±8.8 | 88.1±9.0 | 87.1±8.8 | 87.4±8.5 | 86.3±8.6 | 87.0±9.0 | <0.001 | |
| Current smoker | 308,378 (27.2) | 12,269 (31.0) | 8,124 (13.9) | 752 (18.9) | 12,185 (29.2) | 5,171 (33.1) | 587 (16.7) | 686 (23.6) | 4,020 (9.8) | 534 (13.9) | <0.001 | |
| Heavy drinker | 113,621 (10.0) | 5,449 (13.8) | 2,787 (4.8) | 270 (6.8) | 5,038 (12.1) | 2,185 (14.0) | 209 (5.9) | 192 (6.6) | 1,116 (2.7) | 147 (3.8) | <0.001 | |
| Regular exercise | 256,468 (22.7) | 8,247 (20.8) | 12,345 (21.2) | 813 (20.4) | 9,258 (22.2) | 3,397 (21.8) | 728 (20.7) | 643 (22.1) | 8,156 (19.9) | 737 (19.1) | <0.001 | |
| Comorbidities | ||||||||||||
| Hypertension | 578,956 (51.1) | 26,284 (66.4) | 43,331 (74.3) | 3,270 (82.0) | 27,214 (65.1) | 11,936 (76.4) | 3,027 (85.9) | 2,623 (90.2) | 34,197 (83.5) | 3,405 (88.4) | <0.001 | |
| Dyslipidemia | 453,034 (40.0) | 19,056 (48.1) | 30,844 (52.9) | 2,266 (56.8) | 19,776 (47.3) | 8,710 (55.8) | 2,028 (57.6) | 1,870 (64.3) | 23,289 (56.9) | 2,329 (60.5) | <0.001 | |
| IHD | 163,411 (14.4) | 6,777 (17.1) | 14,748 (25.3) | 1,101 (27.6) | 7,156 (17.1) | 3,055 (19.6) | 1,005 (28.5) | 800 (27.5) | 13,397 (32.7) | 1,357 (35.2) | <0.001 | |
| AF | 9,689 (0.9) | 620 (1.2) | 1,213 (2.1) | 117 (2.9) | 598 (1.4) | 277 (1.8) | 94 (2.7) | 61 (2.1) | 1,209 (3.0) | 154 (4.0) | <0.001 | |
| Stroke | 60,159 (5.3) | 2,782 (7.0) | 7,054 (12.1) | 577 (14.5) | 2,800 (6.7) | 1,317 (8.4) | 569 (16.2) | 424 (14.6) | 6,665 (16.3) | 773 (20.1) | <0.001 | |
| PAD | 186,665 (16.5) | 7,538 (19.0) | 16,289 (27.9) | 1,116 (28.0) | 8,008 (19.2) | 3,262 (20.9) | 1,031 (29.3) | 809 (27.8) | 12,620 (30.8) | 1,225 (31.8) | <0.001 | |
| CVD | 328,687 (29.0) | 13,425 (33.9) | 28,462 (48.8) | 2,082 (52.2) | 14,200 (34.0) | 5,926 (37.9) | 1,882 (53.4) | 1,477 (50.8) | 23,499 (57.4) | 2,338 (60.7) | <0.001 | |
| Heart failure | 24,818 (2.2) | 1,136 (2.9) | 3,435 (5.9) | 289 (7.2) | 1,227 (2.9) | 558 (3.6) | 260 (7.4) | 184 (6.3) | 3,689 (9.0) | 400 (10.4) | <0.001 | |
| Severity of diabetes | ||||||||||||
| FPG ≥150 mg/dL | 259,945 (23.0) | 16,894 (42.7) | 12,881 (22.1) | 1,447 (36.3) | 12,767 (30.5) | 7,127 (45.6) | 1,006 (28.6) | 1,124 (38.7) | 8,062 (19.7) | 1,173 (30.5) | <0.001 | |
| FPG, mg/dL | 133.8±43.0 | 155.2±53.6 | 133.1±45.5 | 149.2±57.7 | 142.1±50.3 | 158.7±56.2 | 139.5±57.2 | 151.0±60.3 | 129.2±43.9 | 140.2±52.1 | <0.001 | |
| DM ≥5 years | 362,229 (32) | 17,260 (43.6) | 28,524 (48.9) | 2,385 (59.8) | 16,834 (40.3) | 8,741 (56.0) | 2,123 (60.3) | 2,180 (75.0) | 24,993 (61.0) | 2,768 (71.9) | <0.001 | |
| Insulin use | 73,554 (6.5) | 4,877 (12.3) | 6,670 (11.4) | 887 (22.2) | 4,506 (10.8) | 2,832 (18.1) | 743 (21.1) | 964 (33.2) | 6,701 (16.4) | 1,109 (28.8) | <0.001 | |
| ≥2 Oral GLD | 449,285 (39.7) | 20,120 (50.8) | 30,970 (53.1) | 2,350 (58.9) | 21,749 (52) | 9,477 (60.7) | 2,237 (63.5) | 1,986 (68.3) | 23,241 (56.7) | 2,328 (60.4) | <0.001 | |
| PDR | 4,188 (0.4) | 542 (1.4) | 506 (0.9) | 107 (2.78) | 406 (1.0) | 445 (2.9) | 89 (2.5) | 212 (7.3) | 409 (1.0) | 105 (2.7) | <0.001 | |
| Medication | ||||||||||||
| RAS inhibitor | 384,398 (33.9) | 17,926 (45.3) | 33,907 (58.1) | 2,637 (66.1) | 19,765 (47.3) | 9,007 (57.7) | 2,564 (72.8) | 2,298 (79.0) | 28,197 (68.8) | 2,843 (73.8) | <0.001 | |
| Sulfonylurea | 392,530 (34.7) | 18,282 (46.2) | 28,902 (49.5) | 2,227 (55.8) | 18,990 (45.4) | 8,647 (55.4) | 2,085 (59.2) | 1,885 (64.8) | 22,219 (54.2) | 2,262 (58.7) | <0.001 | |
| TZD | 49,341 (4.4) | 2,083 (5.3) | 3,489 (6.0) | 250 (6.3) | 2,217 (5.3) | 940 (6.0) | 240 (6.8) | 185 (6.4) | 2,689 (6.6) | 273 (7.1) | <0.001 | |
| SBP, mm Hg | 127.5±14.9 | 132.1±16.8 | 129.2±15.7 | 132.7±18.1 | 129.8±15.6 | 134.3±17 | 131.4±17 | 135.2±17.9 | 130.1± 16.1 | 134.3±17.6 | <0.001 | |
| DBP, mm Hg | 78.5±9.8 | 80.8±11 | 77.6±10.1 | 79.2±11.2 | 79.4±10.3 | 81.4±11 | 78±10.6 | 80±11.4 | 76.9±10.2 | 78.3±10.8 | <0.001 | |
| eGFR, mL/min/1.73 m2 | 91.8±37.7 | 90.8±37.4 | 54.3±5.4 | 52.9±6.4 | 92.1±43.2 | 89.1±40.5 | 52.9±6.3 | 51.1±7.2 | 50.6±7.3 | 47.8±8.1 | <0.001 | |
| eGFR at 1st exam, mL/min/1.73 m2 | 90.5±34.9 | 91.4±39.8 | 78.5±32.1 | 79.4±44.2 | 89.8±32.8 | 89.7±34.1 | 76.9±21.5 | 75.5±24.3 | 50.3±10.0 | 48.6±10.2 | <0.001 | |
| PU | 0 | 39,584 (100) | 0 | 3,990 (100) | 0 | 15,619 (100) | 0 | 2,908 (100) | 0 | 3,852 (100) | <0.001 | |
| PU at 1st exam | 0 | 0 | 0 | 0 | 41,799 (100) | 15,619 (100) | 3,523 (100) | 2,908 (100) | 0 | 0 | <0.001 | |
| Non-HDL-C, mg/dL | 140.9±40.7 | 146.7±51.5 | 139.9±42.1 | 144.6±49 | 140.4 ±44.1 | 148.2±47.9 | 138±43 | 147.2±47.4 | 135.9±44.7 | 138.3±43 | <0.001 | |
| AST, IU/L | 25.72 (25.7–25.74) | 28.55 (28.41–28.7) | 25.07 (24.99–25.15) | 25.81 (25.44–26.2) | 26.81 (26.69–26.92) | 27.27 (27.07–27.48) | 24.84 (24.49–25.18) | 23.71 (23.35–24.08) | 24.15 (24.06–24.23) | 24.13 (23.82–24.45) | <0.001 | |
| ALT, IU/L | 25.72 (25.7–25.75) | 28.87 (28.7–29.05) | 22.47 (22.38–22.57) | 23.39 (22.97–23.82) | 27.04 (26.89–27.19) | 27.65 (27.4–27.91) | 22.29 (21.89–22.7) | 21.67 (21.25–22.09) | 20.5 (20.4–20.61) | 20.81 (20.46–21.16) | <0.001 | |
| γ-GTP, IU/L | 35.57 (35.52–35.62) | 46.15 (45.75–46.55) | 29.54 (29.37–29.71) | 35.37 (34.5–36.27) | 40.97 (40.64–41.3) | 45.99 (45.38–46.6) | 31.47 (30.71–32.25) | 33.03 (32.14–33.94) | 26.57 (26.4–26.75) | 29.53 (28.87–30.19) | <0.001 | |
Values are presented as number (%), mean±standard deviation, or geometric mean (95% confidence interval). Results are based on data from the second examination.
DKD, diabetic kidney disease; GFR, glomerular filtration rate; PU, proteinuria; BMI, body mass index; WC, waist circumference; IHD, ischemic heart disease; AF, atrial fibrillation; PAD, peripheral artery disease; CVD, cardiovascular disease; FPG, fasting plasma glucose; DM, diabetes mellitus; GLD, glucose-lowering drug; PDR, proliferative diabetic retinopathy; RAS, renin-angiotensin system; TZD, thiazolidinedione; SBP, systolic blood pressure; DBP, diastolic blood pressure; eGFR, estimated glomerular filtration rate; HDL-C, high-density lipoprotein cholesterol; AST, aspartate aminotransferase; ALT, alanine aminotransferase; γ-GTP, gamma-glutamyltransferase.
![]()
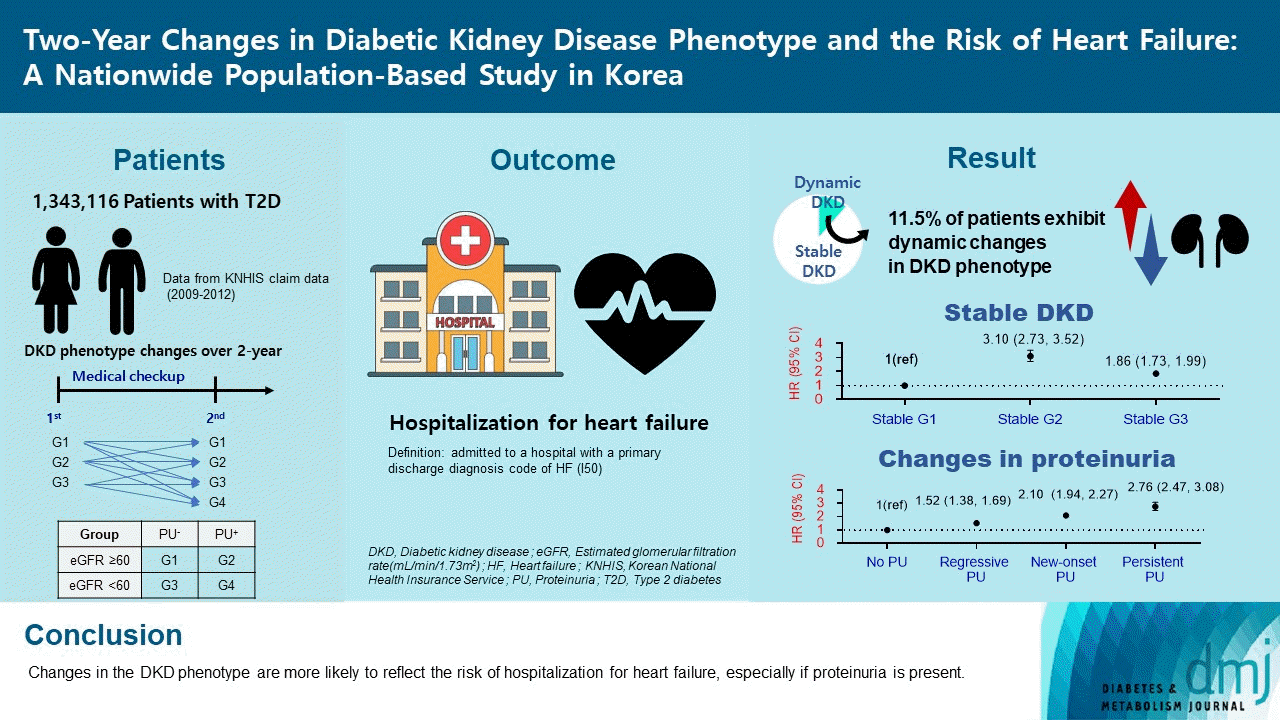
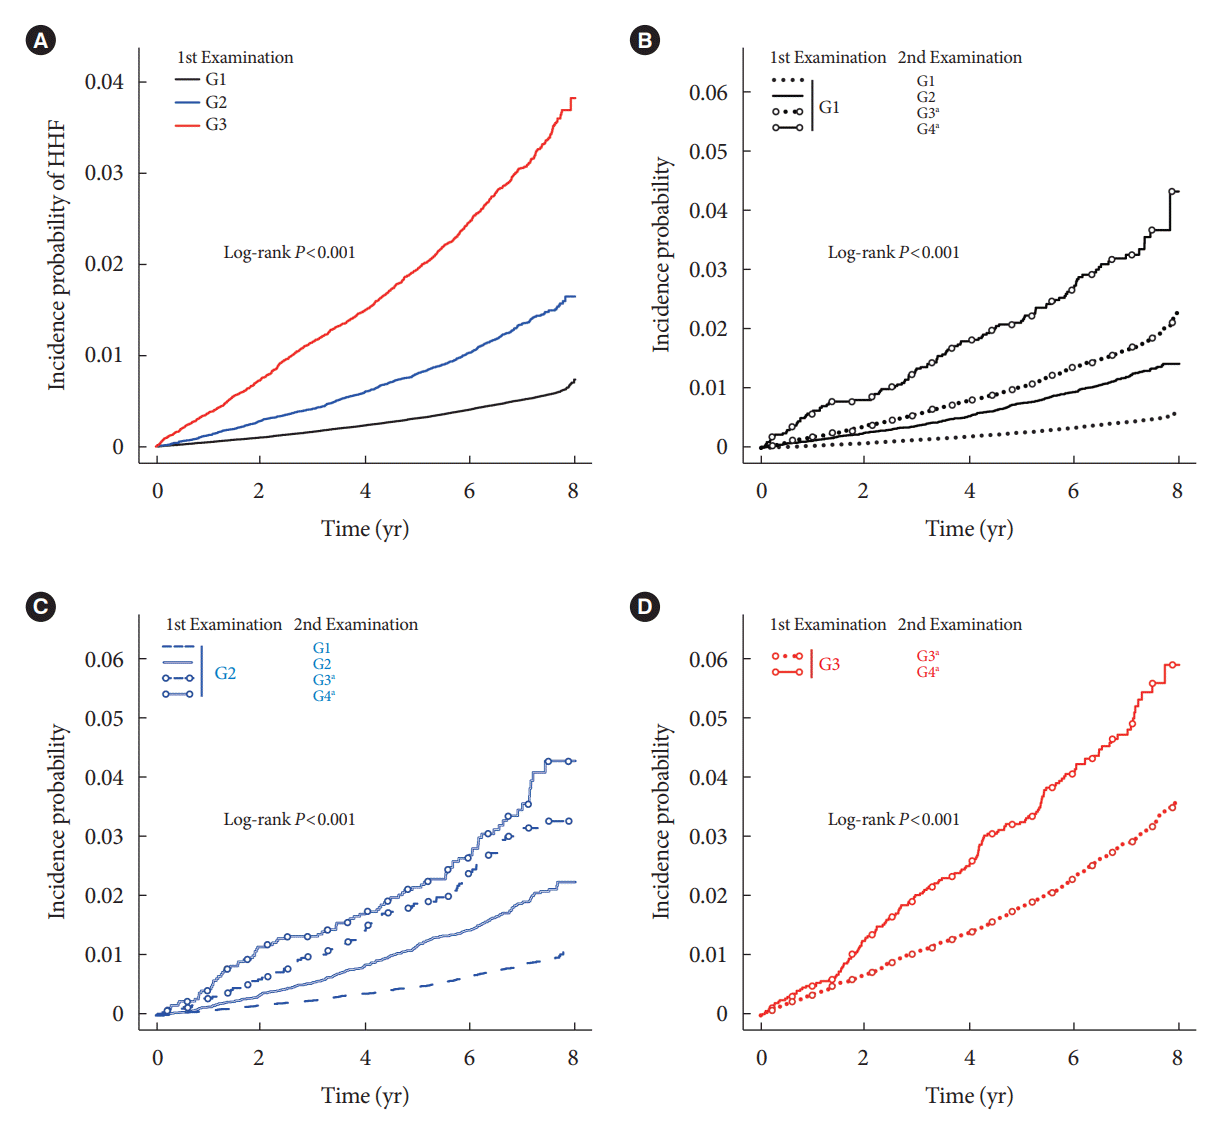
Risk of HHF according to changes in DKD phenotype
Fig. 1.
![]()
Fig. 2.
![]()
Risk of HHF based on changes in proteinuria phenotype
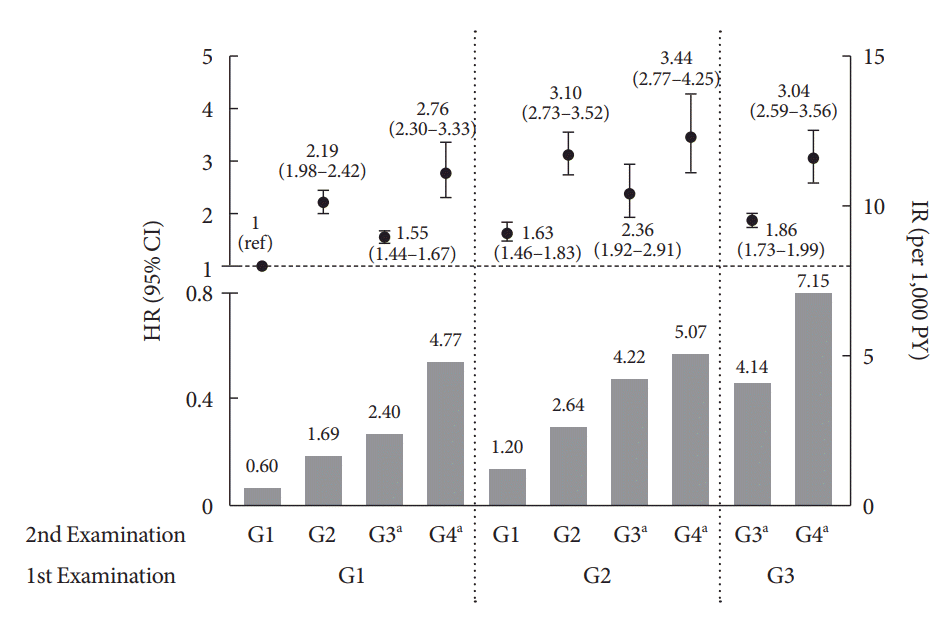
Sensitivity analyses
Subgroup analysis
Fig. 3.
![]()
 XML Download