Journal List > Korean J Orthod > v.53(4) > 1516083391

Noh, Kim, and Park: Differences in positions of cone-beam computed tomography landmarks in patients with skeletal Class III facial asymmetry according to midsagittal planes

Abstract

Objective

This study aimed to clarify differences in the positions of cone-beam computed tomography (CBCT) landmarks according to different midsagittal planes (MSPs) in patients with skeletal Class III facial asymmetry.

Methods

Pre-treatment CBCT data from 60 patients with skeletal Class III were used. The patients were classified into symmetric (menton deviations of < 2 mm) or asymmetric (menton deviations of > 4 mm) groups. Six MSPs were established based on previous studies, and three-dimensional analyses were performed for the planes in both the groups. The measurement outcomes were compared statistically.

Results

A statistically significant interaction (p < 0.01) was observed between MSPs and facial asymmetry. No significant differences were observed among MSPs in the symmetric group. However, significant differences in linear measurements were identified among MSPs in the asymmetric group. Specifically, the upper facial MSP revealed both maxillary and mandibular transverse asymmetries. On the other hand, anterior nasal spine (ANS)-associated MSP could not identify maxillary asymmetry. Furthermore, the menton deviation was approximately 3 mm lower when estimated using the ANS-associated MSP than that using upper facial MSP.

Conclusions

The choice of MSP can significantly affect treatment outcomes while diagnosing patients with asymmetry. Therefore, care should be taken when selecting MSP in clinical practice.

INTRODUCTION

The midsagittal plane (MSP) demarcates the two sides (left and right) of the body. Various attempts have been made to construct an accurate MSP. Mathematically, morphometric or least-square approximated MSPs are usually considered as true MSPs.1-4 However, the general use of these methods remains debatable.3-5 Conventional cephalometric MSP remains the most preferred method for defining an MSP.
A cephalometric MSP is defined based on geometric rules and anatomic landmarks. The main research goal regarding cephalometric MSPs is to determine the optimal combination of landmarks and construction schemes.2-12 Studies in the relevant literature have recommended several cephalometric MSPs. However, currently, there is no consensus on a cephalometric definition of MSP. To date, choosing landmarks from the mid-facial area, such as the anterior nasal spine (ANS) is debated.4-7,9,11,13
The aforementioned arguments exist due to the possibility of positional bias in midfacial landmarks for patients with facial asymmetry.6,7,13 It has been suggested that the results of asymmetry evaluation may vary if midfacial landmarks are included in the definition of MSP.7,9 Furthermore, given that the asymmetry confirmed during diagnosis is directly reflected in the treatment plan, this diagnostic difference is clinically relevant. However, only a few studies have quantitatively examined the differences among various MSPs, despite their clinical importance.
This study aimed to clarify the diagnostic differences caused by interactions between cephalometric MSPs and facial asymmetry. Commonly used three-dimensional (3D) measurements were statistically compared for different MSPs. We then examined how asymmetry assessments differed with MSPs in patients with skeletal Class III facial asymmetry. Our null hypothesis stated that no statistical interaction would exist between MSPs and facial asymmetry.

MATERIALS AND METHODS

Research data were collected from the diagnostic records of patients who visited the Department of Orthodontics at Kyungpook National University Dental Hospital for surgical orthodontic treatment between 2012 and 2019. The inclusion criteria were as follows: ANB angle ≤ 0°, no malformed teeth, no prosthetic crowns, no missing or supernumerary teeth, symmetrically distributed crowding or spacing < 3 mm, no craniofacial syndrome, and no previous orthodontic treatment. The menton deviation was measured from the initial posteroanterior cephalograms to classify the study participants. Moreover, the symmetry and asymmetry groups comprised of patients with menton deviations of < 2 mm and > 4 mm, respectively. Patients with menton deviations of 2–4 mm were excluded, and data from 60 patients (30 per group) were analyzed. The participant characteristics are summarized in Table 1. This study was approved by the Institutional Review Board of the Kyungpook National University Dental Hospital (KNUDH-2022-03-02-00).
Pre-treatment cone-beam computed tomography (CBCT) was performed with the patient in the maximum intercuspal position for diagnostic purposes. The settings of the CBCT scanner (CB MercuRay; Hitachi, Osaka, Japan) were as follows: 15 mA, 120 kV, exposure time of 9.6 s, voxel size of 0.2 mm, axial slice thickness of 0.38 mm, and field of view of 19.3 × 19.3 cm. All the captured images were stored in digital imaging and communication in medicine (DICOM) format, and they were three-dimensionally reconstructed using volume-rendering software (InVivo Dental, version 5.4; Anatomage, San Jose, CA, USA).
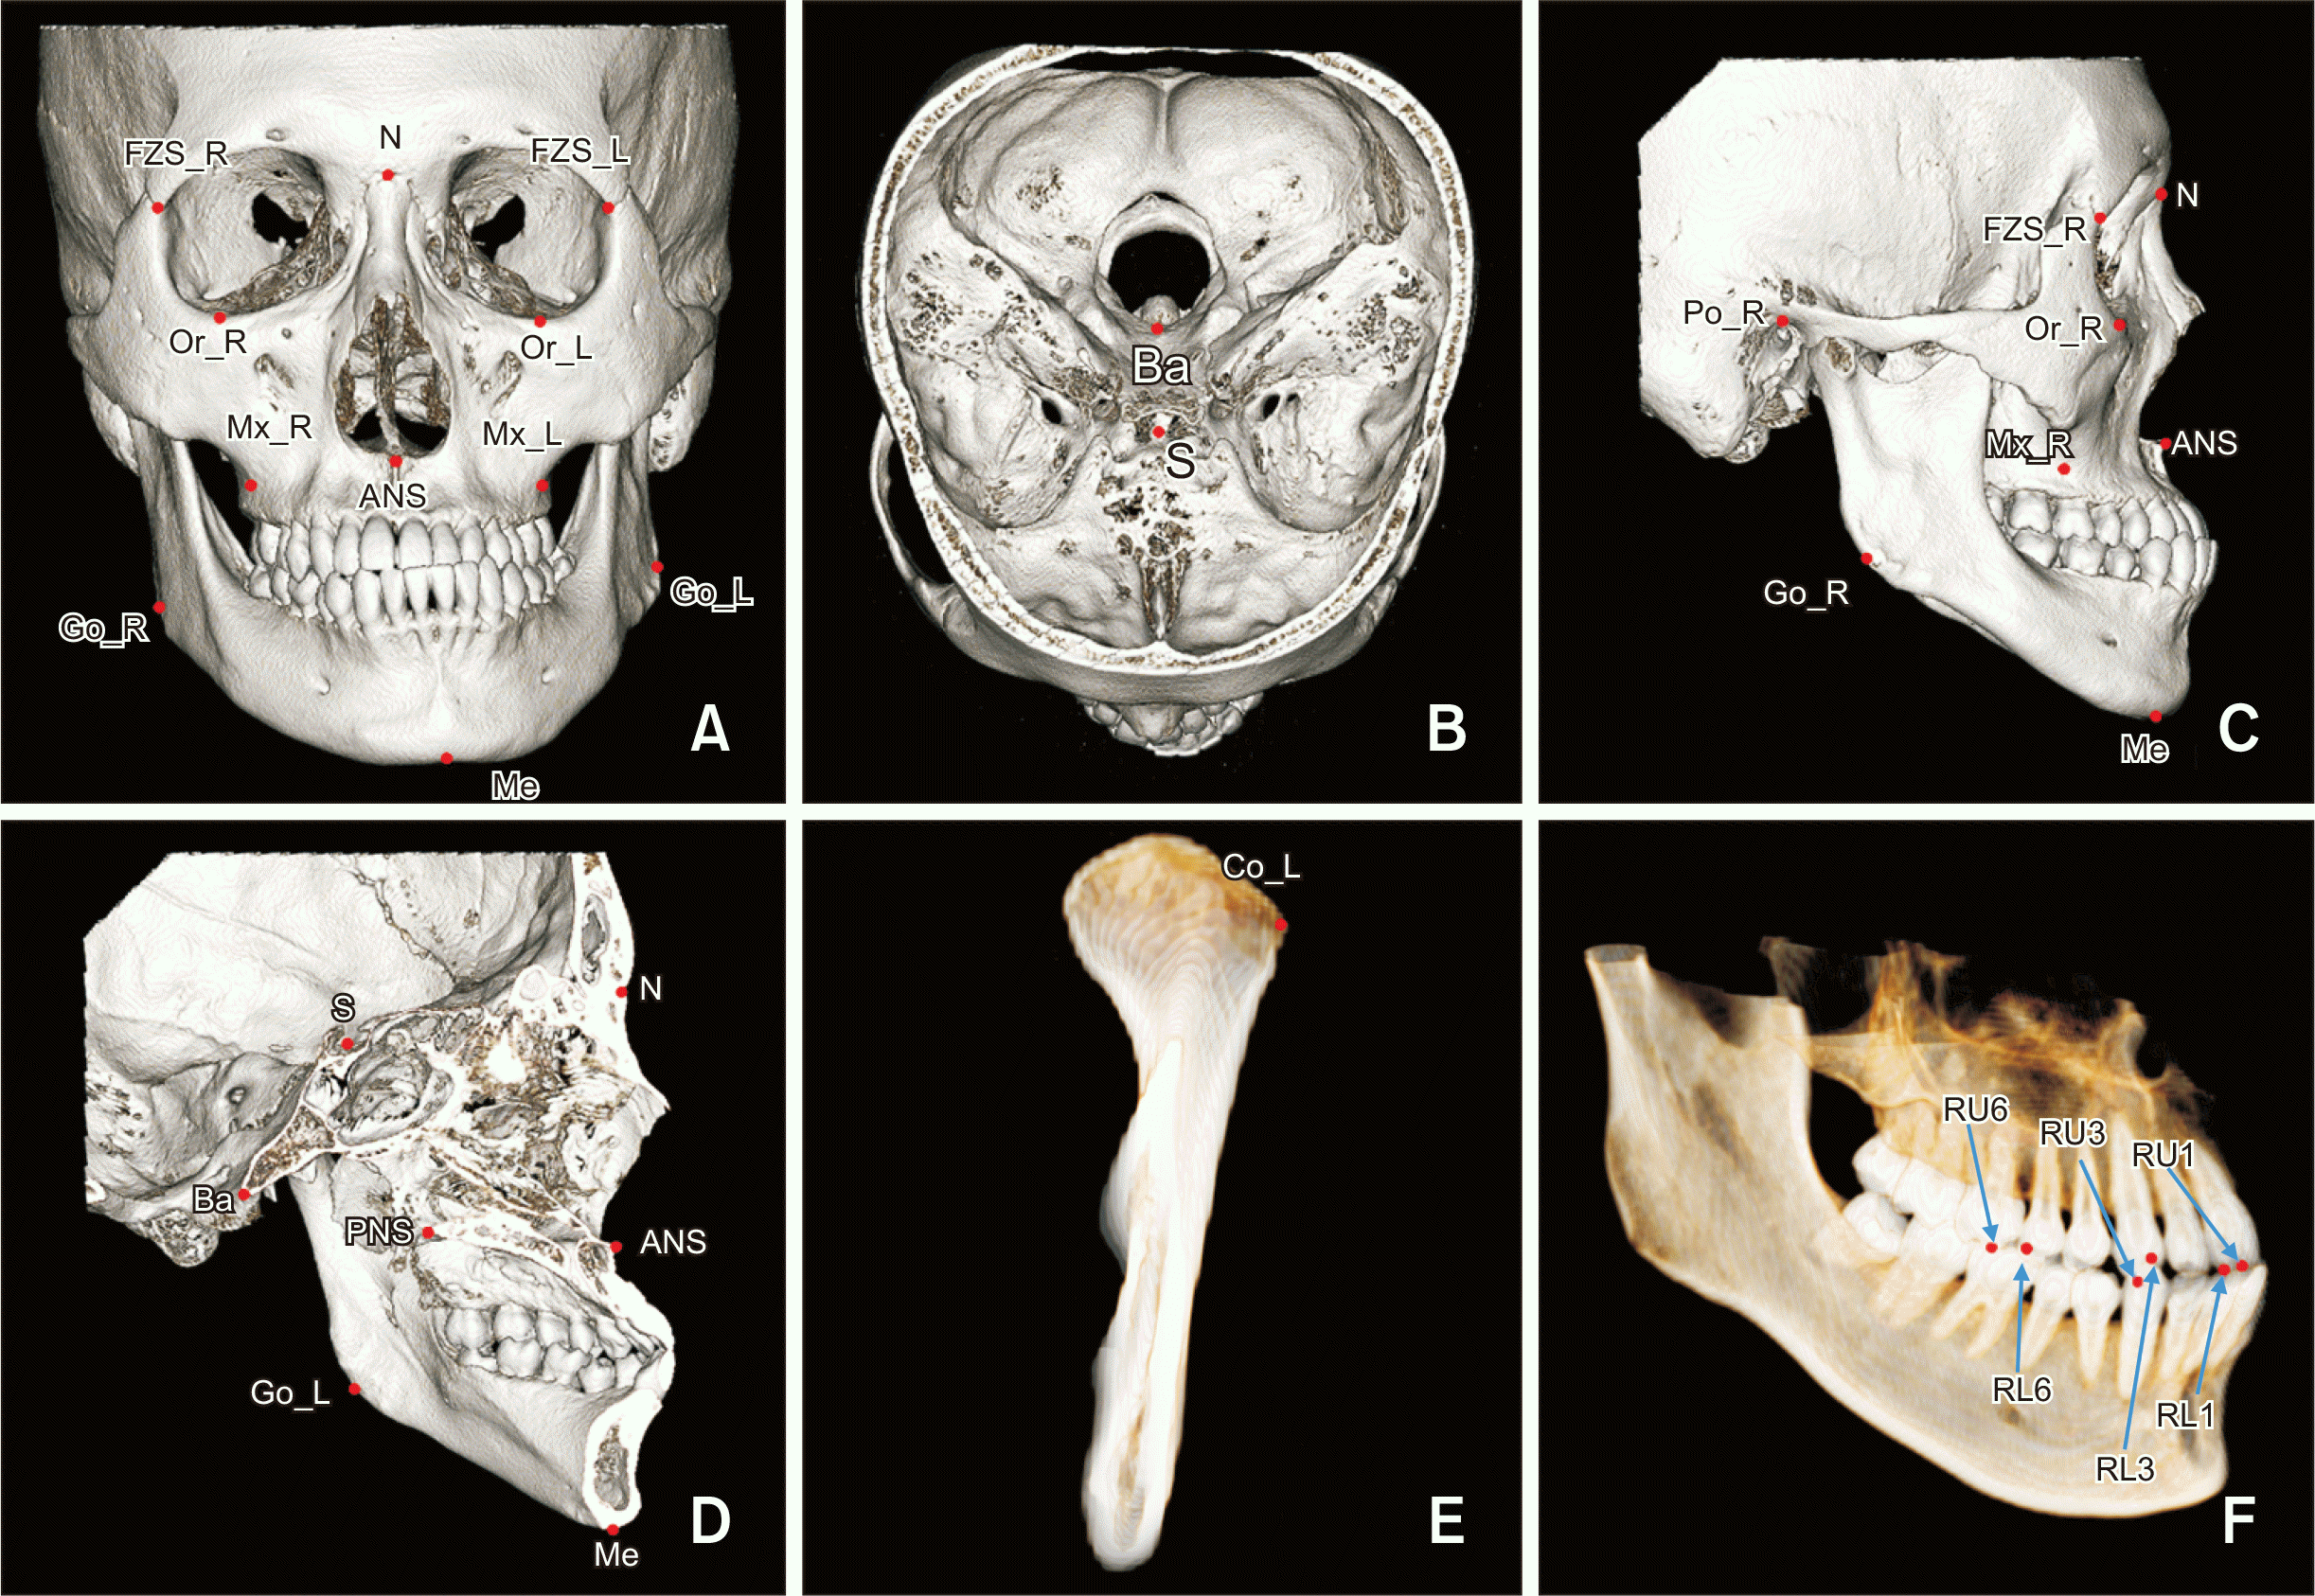
Definitions of the skeletal and dental landmarks used in this study are presented in Table 2 and Figure 1. After selecting the approximate position of a landmark on the volume-rendered image, the final location was finely adjusted in a multiplanar view that showed the axial, frontal, and sagittal cuts simultaneously.
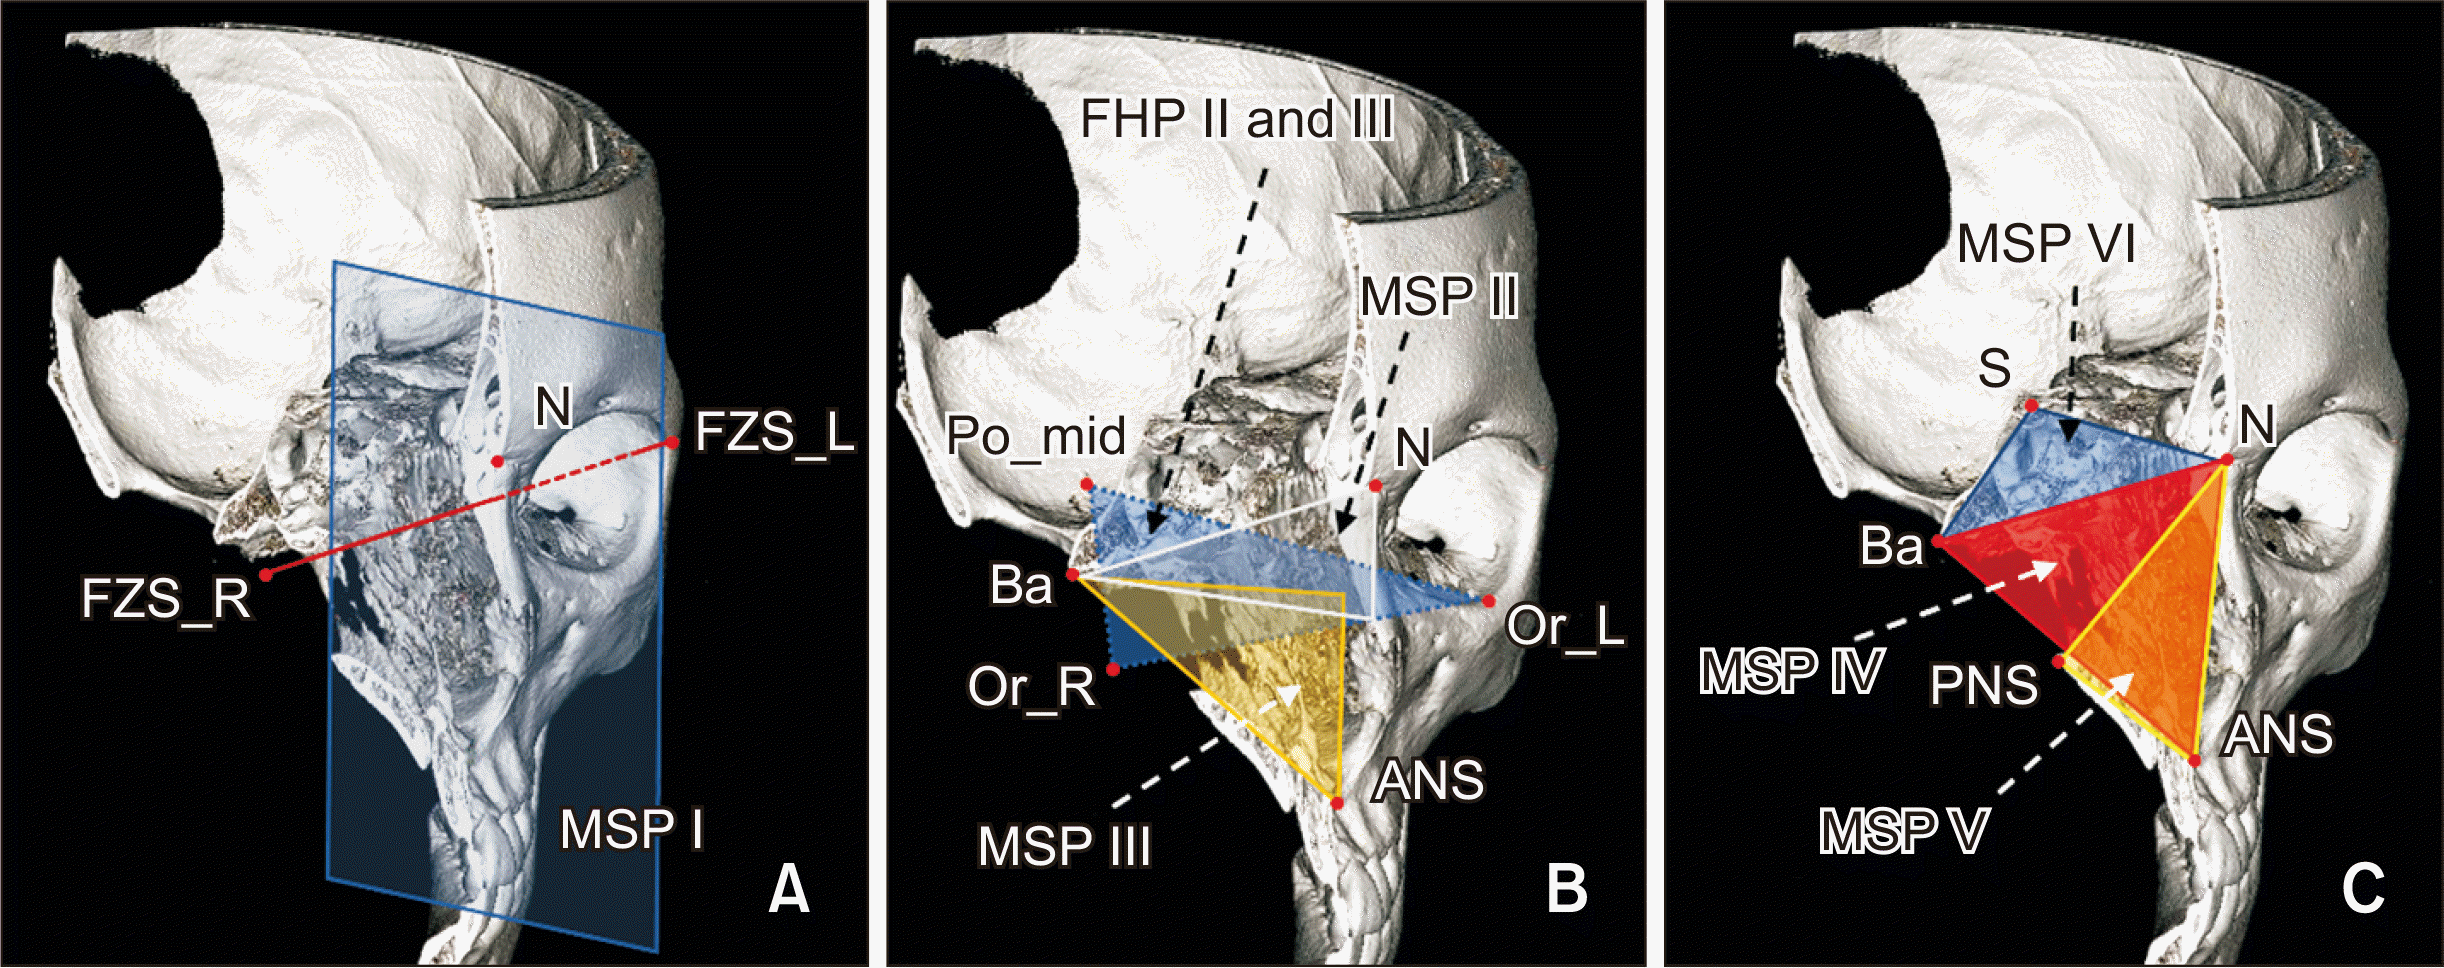
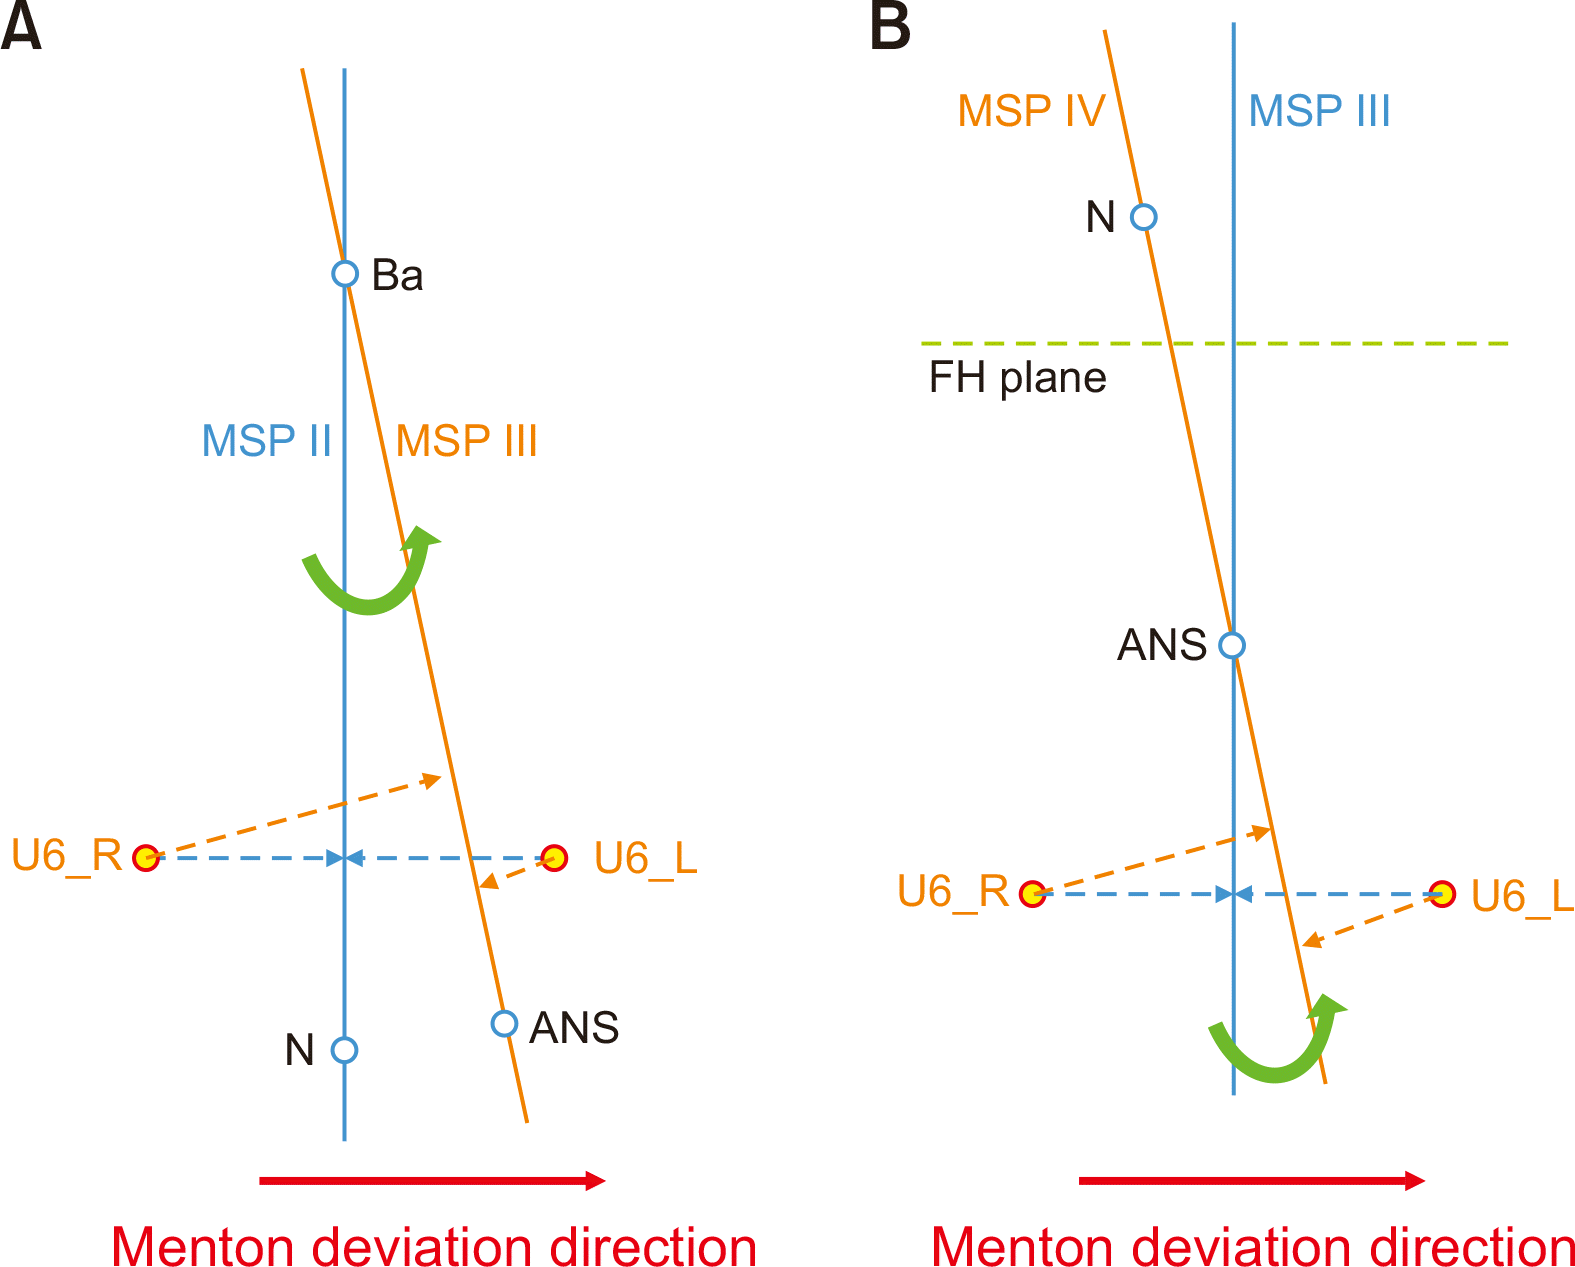
Six MSPs were compared (Table 3, Figure 2). These MSPs were used according to the recommendations of previous studies (MSPs I, II, IV, V, and VI) or with minor modifications (MSP III) from previous studies.3,4,8,9,12 Furthermore, MSPs I (FZS, N), II (FH, Ba-N), and VI (Ba-S-N) were defined using the cranium and upper facial landmarks alone, whereas the definitions of MSPs III (FH, Ba-ANS), IV (Ba-N-ANS) and V (PNS-N-ANS) included mid-facial landmarks.
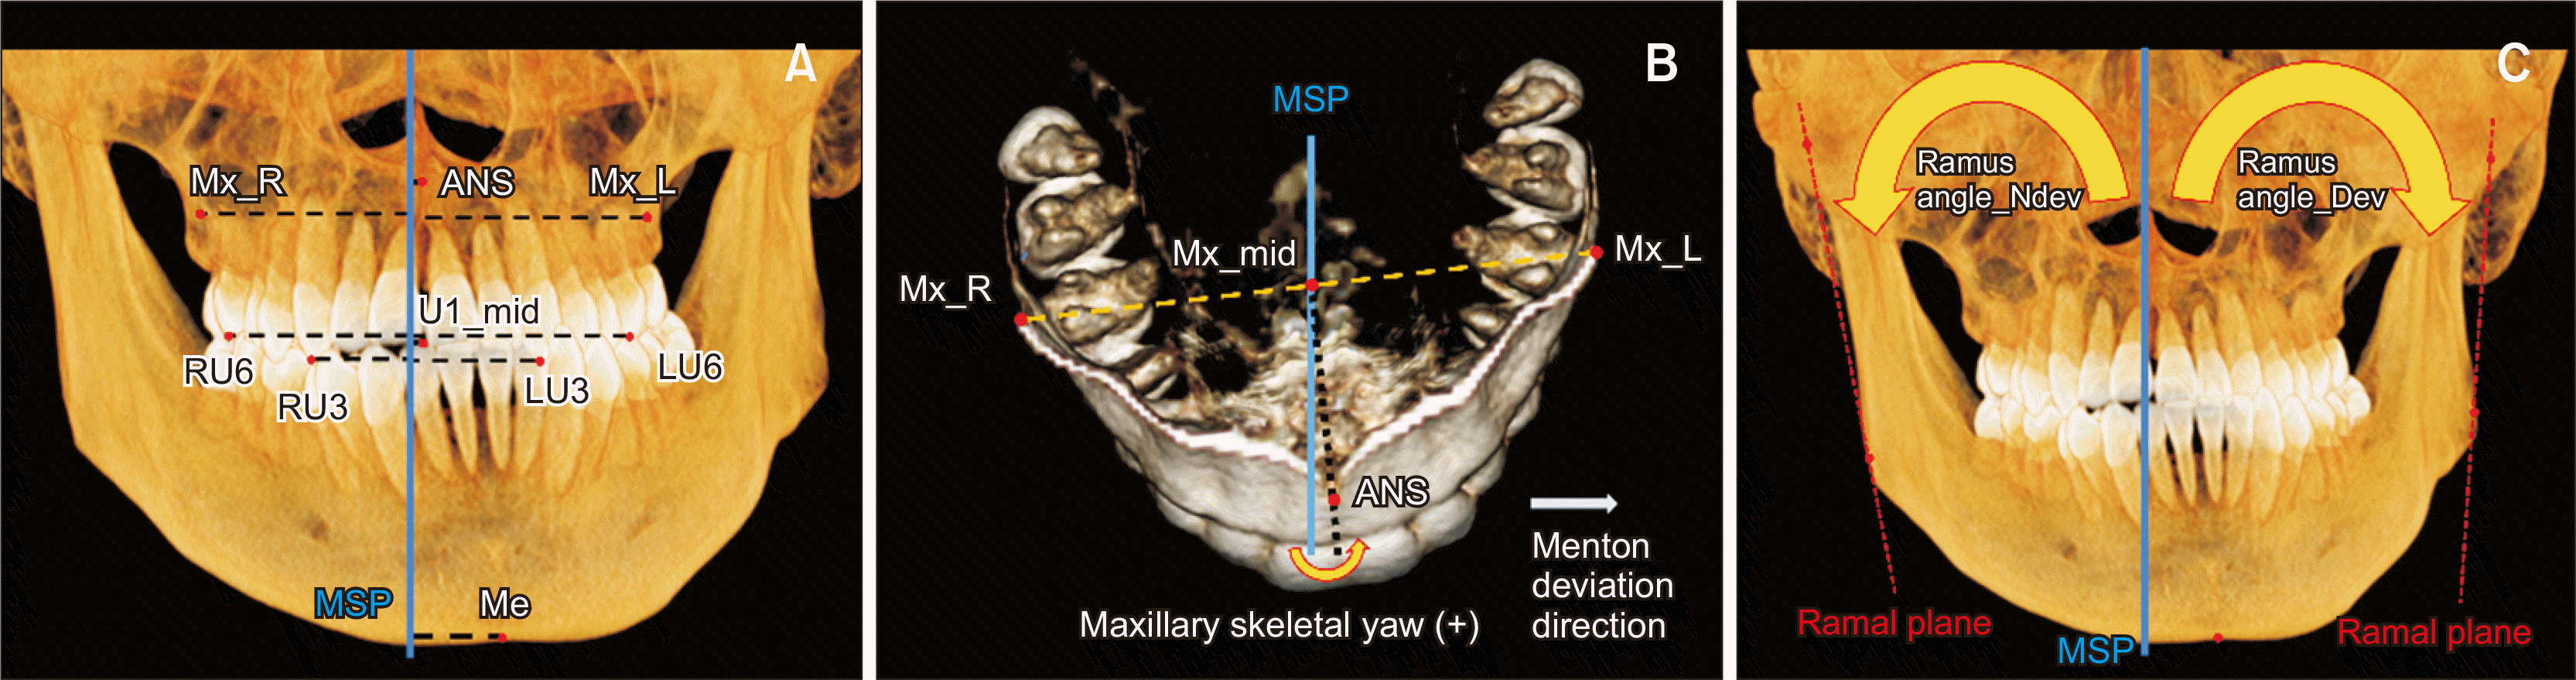
Subsequently, 3D analyses were performed. Maxillomandibular skeletal and dental asymmetries were calculated for each MSP. Linear measurements included the distance of the landmarks from the MSPs, whereas angular measurements included the ramus angle and maxillary and mandibular skeletal/dental yaws. Notably, positive signs were assigned when the skeletal and dental yaws as well as the transverse position of the midline landmarks, such as the ANS and upper incisor, were in the direction of menton deviations. The detailed definitions of these measurements are presented in Table 4 and Figure 3.

Statistical analysis

The sample size was estimated using G*Power software (version 3.1.9.7; Franz Faul, Christan-Albrechts-University, Kiel, Germany). The numbers of groups (between-subject factor; symmetric/asymmetric) and repeat measurements (within-subject factor; MSPs) were two and six, respectively. With an effect size of 0.65, a significance level of 0.05, and a test power of 0.85, the minimum number of patients required in each group was estimated to be 20. Furthermore, based on the central limit theorem, the number of patients in each group was determined to be 30.
Furthermore, to verify the reliability of the measurements, 30 patients were randomly selected, and landmarking was repeated for these patients at intervals of 4 weeks. We used a two-way mixed, single-rater, and absolute agreement model to calculate the intraclass correlation coefficient (ICC) for the coordinates of each landmark. Moreover, Dahlberg’s formula (d2/2n) was used to estimate the method errors for these coordinates.
We used the Shapiro–Wilk test to examine the normality of the measured variables. After assessing the equality of variances using Levene’s test, an independent t-test was used to confirm the matching of sample characteristics between the two groups. The sphericity assumption among the variables of repeated measurements was significantly violated according to the results of Mauchly’s test (p < 0.001). Therefore, the statistical interaction between MSPs and facial asymmetry was evaluated using multivariate analysis of variance (MANOVA), which is more robust than a mixed analysis of variance approach whereby the sphericity assumption is not applicable.14 To further interpret this interaction, simple main-effect analyses and subsequent pairwise comparisons with Bonferroni correction were performed.
All statistical analyses were performed at a significance level of 5% using the SPSS software version 26 (IBM Corp., Armonk, NY, USA).

RESULTS

The coordinates of all the landmarks demonstrated high reproducibility for repeated measurements, with a mean ICC of 0.994 (range: 0.922–1.000). Notably, the estimated method errors were 0.35 mm, 0.43 mm, and 0.51 mm for x, y, and z coordinates, respectively. Therefore, we used the first set of measurement data for the subsequent analyses.
The patient factors that might have affected the study results are presented in Table 1. Age, anteroposterior skeletal patterns, and vertical skeletal patterns did not differ significantly between the symmetric and asymmetric groups. Only menton deviation, which was the group-dividing factor, demonstrated high significance (p < 0.001).
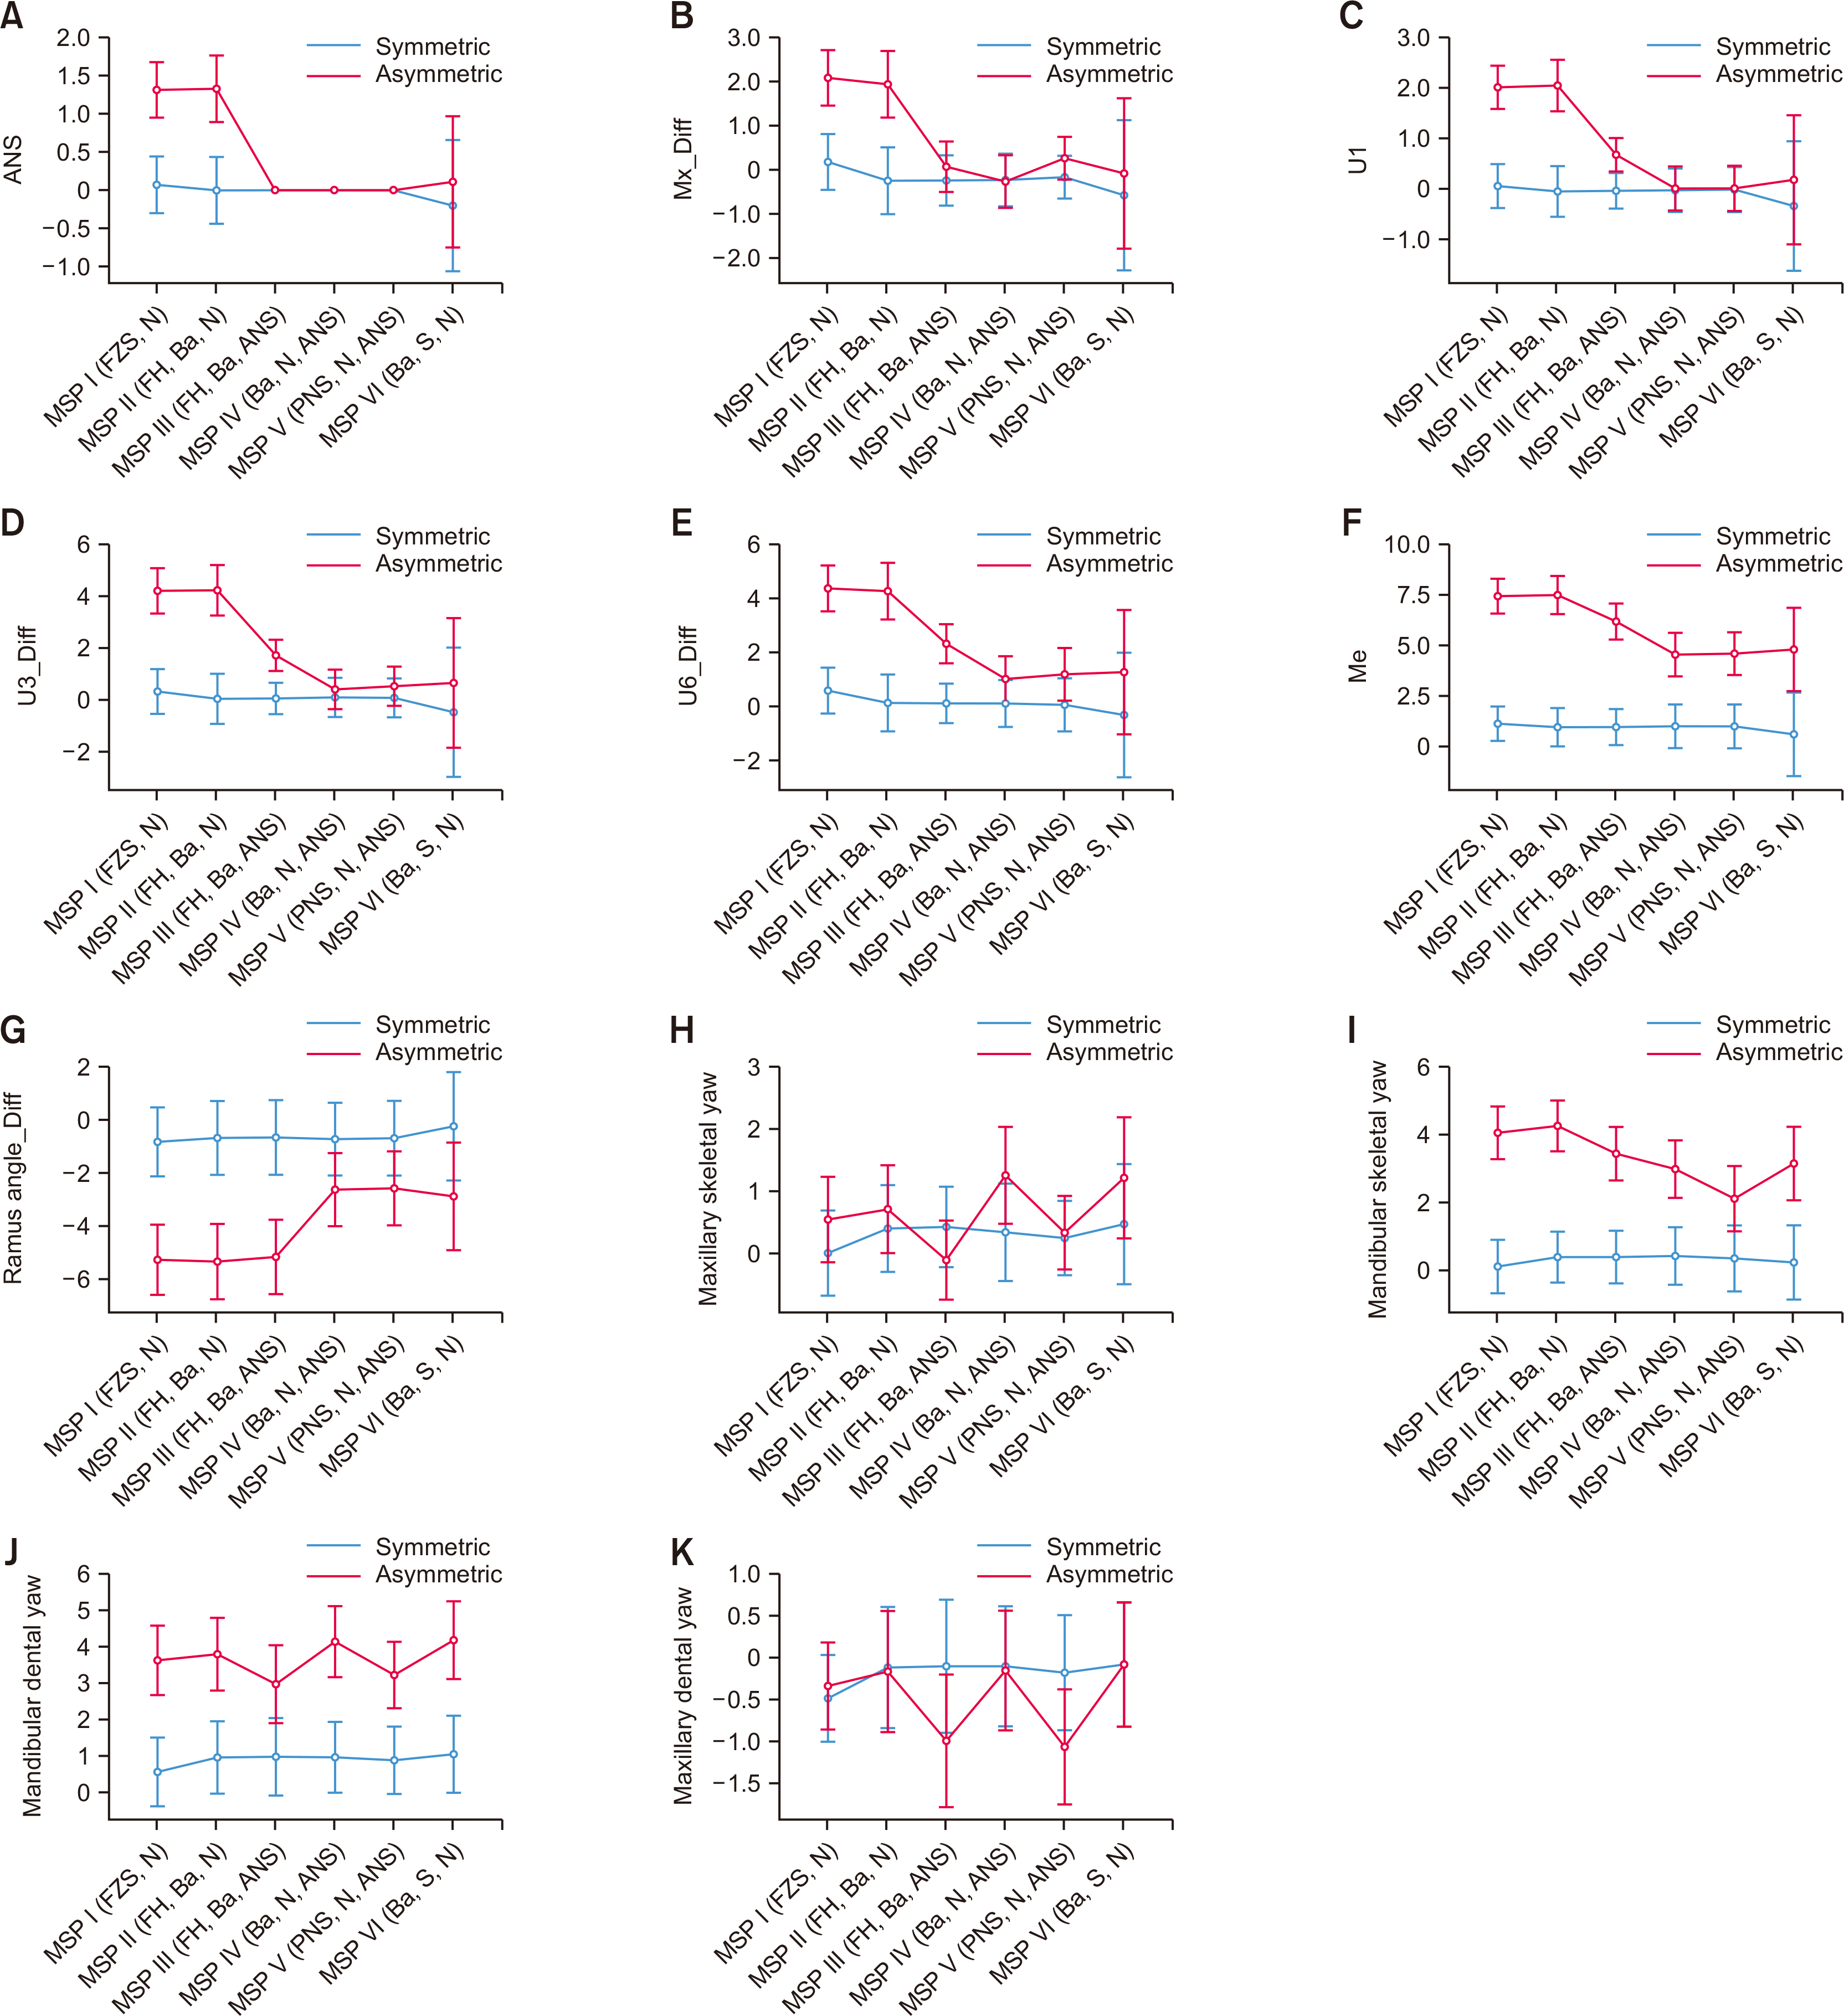
Table 5 presents descriptive statistics for each variable. The mean and standard deviation values of the variables measured at each level using a combination of within-subject (MSPs) and between-subject (symmetry and asymmetry) factors are presented in Table 5. In the symmetric group, all the measurements demonstrated similar values among the MSPs. However, in the asymmetric group, the outcomes differed among the MSPs. Notably, skeletal/dental measurements determined according to MSP VI (Ba-N-ANS) demonstrated a remarkably larger standard deviation than those determined according to other MSPs, irrespective of the patient group.
Furthermore, MANOVA revealed a highly significant interaction between MSP and facial symmetry for all the variables (p < 0.01; Supplementary Table 1). Subsequent simple main-effect analysis, which is another MANOVA used to investigate the effect of MSPs in each group (symmetric and asymmetric), confirmed that no significant difference was observed according to MSPs in the symmetric group (p-values ranging from 0.215–0.933, Supplementary Table 2). However, all the measurements in the asymmetric group were highly significant among the MSPs (p < 0.001).
The profile plots (Figure 4) graphically summarize the results of pairwise comparisons in the asymmetric group. Only representative variables are presented for simplicity. The pairwise comparison results are presented in the Supplementary Data (Supplementary Table 3). No statistically significant differences were observed in the linear measurements and ramus angle between MSPs I (FZS, N) and II (FH, Ba-N) and between MSPs IV (Ba-N-ANS) and V (PNS-N-ANS). However, significance was evident (p < 0.001) in comparisons between MSPs II (FH, Ba-N) and III (FH, Ba-ANS) and between MSPs III (FH, Ba-ANS) and IV (Ba-N-ANS). Moreover, skeletal and dental yaws showed fluctuation patterns within a range of 1° among the MSPs.
The differences in the asymmetry measurements between the MSPs are presented in Table 6. The matching MSP pairs were combined by averaging. Specifically, MSPs I (FZS, N) and II (FH, Ba-N) were merged into the upper facial MSP, whereas MSPs IV (Ba-N-ANS) and V (PNS-N-ANS) were merged into ANS-associated MSP. Statistical significance was confirmed for all the measurements using the paired t-test (p < 0.001). ANS-associated MSP could not identify the maxillary skeletal and dental transverse asymmetries. Furthermore, the menton deviations were evaluated differently as 7.5 mm and 4.6 mm using upper facial and ANS-associated MSPs, respectively. Similarly, the ramus angle difference tended to be underestimated by ANS-associated MSPs than that by upper facial MSPs by a factor of 2.69°.

DISCUSSION

Previously, An et al.9 studied how ANS deviation, menton deviation, and maxillary yaw were evaluated in eight cephalometric MSPs using CBCT data from 30 patients with facial asymmetry. Although the midline landmark MSP tended to evaluate asymmetry less, no clinically significant difference was observed between the MSP perpendicular to the Frankfort horizontal (FH) plane and the midline landmark MSP. Similarly, Damstra et al.2 measured skeletal/dental asymmetry using six cephalometric MSPs with 14 dry skulls (five in the asymmetric and nine in the symmetric group). The MSPs perpendicular to the FH plane showed significantly greater asymmetry than the midline landmark MSPs. Both studies confirmed that the midline landmark MSP evaluated asymmetry smaller, whereas the size of the difference in the actual measured values differed between the studies. These differences may be attributed to the characteristics of the samples used in each study. An et al.9 did not present detailed data on the characteristics of 30 patients with asymmetry; however, the sample size in the study by Damstra et al.2 was too small to generalize their findings. Therefore, in this study, we investigated the interaction between facial asymmetry and the MSP type using 30 patients per group and explicitly presented the patient characteristics.
Statistically significant interactions were confirmed between MSPs and facial symmetricity. The between-group (symmetric and asymmetric) differences in each variable were significantly different in at least one of the six MSPs (Figure 4). However, the significant interaction originated from the asymmetric group rather than the symmetric group because the measurement outcomes varied significantly among MSPs in the simple main-effect analyses of the asymmetric group. Therefore, the null hypothesis was rejected.
MSP VI (Ba-S-N) was incorporated to determine the effect of the MSP, which was defined by the three midline landmarks in the cranium and upper facial areas. However, the large standard deviations, which were 2–4 times larger than those of the other MSPs, were confirmed by the measurement results presented in Table 5 for both the symmetric and asymmetric groups. Geometrically, when the landmarks that define the MSP are close, even a small change in the landmark position can remarkably change the overall orientation of the MSP.2,4,15 Therefore, slight cranial base asymmetries may lead to MSP deflection and consequent misinterpretation of facial asymmetry.16 Thus, MSP VI (Ba-S-N) was considered an inappropriate reference plane and was excluded from subsequent analyses.
The profile plots (Figure 4) show the fluctuating patterns in the yaw measurements from MSPs II (FH, Ba-N) to V (PNS-N-ANS). Changes in the alignment of the MSP may have been entangled three-dimensionally with the angular measurement methods via projection onto the horizontal plane (Table 4), which may have led to variations among the MSPs. However, the overall magnitude of variation was < 1°, rendering it clinically insignificant. Therefore, we determined that the differences in skeletal and dental yaw measurements were negligible among the MSPs.
The plateaus observed in the profile plot (Figure 4) indicate that MSPs I (FZS, N) and II (FH, Ba-N) were mutually equivalent pairs for the ramus angle and linear asymmetry measurements. Similarly, MSPs IV (Ba-N-ANS) and MSP V (PNS-N-ANS) are interchangeable. However, substituting MSP I (FZS, N) or II (FH, Ba-N) with MSP IV (Ba-N-ANS) or V (PNS-N-ANS) may not be possible because of the evident tendency for reduction over a clinically significant range between them.17-19 MSP III (FH, Ba-ANS) was experimentally introduced in this study to facilitate the understanding of this outcome. Notably, previous studies have reported that the ANS can deviate in the direction of mandibular asymmetry.6,7,13 Consequently, as illustrated in Figure 5, MSP tilting in the horizontal and frontal planes in the chin deviation direction can be induced, which would further reduce the corresponding ramus angle and transverse linear measurements.
The diagnostic differences according to different MSPs are summarized in Table 6. The identified diagnostic discrepancies between upper facial- and ANS-associated MSPs may lead to the development of different surgical plans. For example, the required mandibular movement based on the menton deviation differs between these MSPs, i.e., the 3 mm difference in chin deviation is in a clinically non-negligible range according to perception studies.17,19 Moreover, transverse maxillary correction may not be indicated by ANS-associated MSP, whereas upper facial MSP may indicate a translational movement of the maxilla to the non-deviated side when two-jaw surgery is considered.20 The overall aesthetics of the face after treatment may vary depending on the MSP because the maxilla determines the final position of the mandible.21,22
Presurgical orthodontic treatment plans may also be affected by the MSP type. Dental compensation in asymmetric patients is a well-known phenomenon reported in the literature. Many CBCT studies have confirmed flaring of the molars and canines and deviation of incisors in the asymmetric direction, along with a resultant transverse discrepancy between the deviated and non-deviated sides.23-26 However, in this study, this characteristic compensational pattern in the transverse distance could be reproduced only in the upper facial MSP. ANS-associated MSP cannot detect a transverse dental discrepancy between the sides, which suggests that presurgical orthodontic treatment goals may differ according to the type of MSP.
Recently, ANS-associated MSPs have been gathering attention.3-5,10 Interestingly, to our knowledge, the above-mentioned dental compensation has been verified mainly using upper facial MSPs. In contrast, CBCT dental compensation studies using ANS-associated MSP are rare. As the current results imply, the dental compensation pattern might be observed differently depending on the MSPs. Future studies on the differences in dental compensation according to various reference planes are required.
Unfortunately, no consensus exists on MSP selection. Finding an objective and scientific basis to support the idea that one MSP is more appropriate than another is challenging. Although various MSPs have been proposed based on mathematical and geometric techniques, they could be optimal only in their domains (upper face or upper to middle face).2-4 As a result, an MSP that is optimal in one domain may not be optimal in another, resulting in a significant difference in the diagnostic outcome, as demonstrated in this study.
The lack of an absolute reference MSP may make it difficult to reach an agreement. Given that the ultimate treatment goals are soft tissue symmetry and beauty, 3D facial scanning technology may offer a way to resolve this controversy. For example, taking 3D facial images with the patient in a natural head position and merging them with CBCT data may help define the most reliable MSP. Therefore, further studies are warranted in this regard.
This study divided the samples into symmetric and asymmetric groups based on menton deviation. The standard deviation of the menton deviation of the asymmetric group was larger than that of the symmetric group (Tables 1 and 5), indicating that patients with moderate and severe asymmetries were included in one group. Therefore, within-subject differences according to the type of MSP identified in this study may have been slightly exaggerated because of severe cases in the asymmetric group. Subdividing the asymmetric group according to the degree of severity may help reduce this bias. However, the limited number of samples makes it difficult to confirm this possibility. Further research is required to confirm this hypothesis.
A clinical guide may be required to select an MSP for diagnosing patients with facial asymmetry. When maxillary skeletal correction is not needed, i.e., 1-jaw surgery is indicated, ANS-associated MSP may help reduce the amount of presurgical orthodontic treatment and subsequent surgical movement. In contrast, if the nasal deviation is evident on extraoral examination and rhinoplasty is planned, an upper facial MSP diagnosis may be more plausible because ANS deviation can be associated with nasal deviation.27 However, as a general approach, the clinician must initially considerboth types of MSPs. A thorough discussion between the patient and the oral surgeon is required. Of the two MSPs, the one that orients the CBCT image closer to the patient’s natural head posture may be desirable. Moreover, an agreement must be reached between the orthodontist and oral surgeon before treatment. For example, if an orthodontist performs presurgical orthodontics based on ANS-associated MSP and an oral surgeon establishes a surgical plan and manufactures a surgical splint according to the upper facial MSP, the optimal treatment outcome might not be obtainable.

CONCLUSIONS

The type of cephalometric MSP influences the diagnosis due to the interaction between MSPs and facial asymmetry. Although the effect on the skeletal and dental yaw measurements was negligible, the ramus angle and transverse distance could indicate a significant difference depending on the MSP in patients with facial asymmetry. Moreover, the upper facial MSP, MSP I (FZS, N) or II (FH, Ba-N) clearly demonstrated transverse asymmetries of both the maxilla and mandible; however, the ANS-associated MSP, MSP IV (Ba-N-ANS), and V (PNS-N-ANS) tended to underestimate these asymmetries significantly. Accordingly, plans for orthognathic surgery and presurgical orthodontic treatment may vary depending on the MSP selection. Unfortunately, no consensus exists on the type of MSP that should be used to diagnose asymmetry. Therefore, clinicians should initially consider both types of MSP and then select one or more compromises between the two after a comprehensive assessment of the clinical case.

Notes

SUPPLEMENTARY MATERIAL

Supplementary data is available at https://doi.org/10.4041/kjod23.015.

AUTHOR CONTRIBUTIONS

Conceptualization: HKN. Data curation: HKN. Formal analysis: HKN. Funding acquisition: HKN. Methodology: HKN. Project administration: HSP. Supervision: HSP. Writing–original draft: HKN. Writing–review & editing: HJK, HSP.

CONFLICTS OF INTEREST

No potential conflict of interest relevant to this article was reported.

REFERENCES

1. Hajeer MY, Ayoub AF, Millett DT. 2004; Three-dimensional assessment of facial soft-tissue asymmetry before and after orthognathic surgery. Br J Oral Maxillofac Surg. 42:396–404. https://doi.org/10.1016/j.bjoms.2004.05.006. DOI: 10.1016/j.bjoms.2004.05.006. PMID: 15336764.
crossref
2. Damstra J, Fourie Z, De Wit M, Ren Y. 2012; A three-dimensional comparison of a morphometric and conventional cephalometric midsagittal planes for craniofacial asymmetry. Clin Oral Investig. 16:285–94. https://doi.org/10.1007/s00784-011-0512-4. DOI: 10.1007/s00784-011-0512-4. PMID: 21271348. PMCID: PMC3259389.
crossref
3. Shin SM, Kim YM, Kim NR, Choi YS, Park SB, Kim YI. 2016; Statistical shape analysis-based determination of optimal midsagittal reference plane for evaluation of facial asymmetry. Am J Orthod Dentofacial Orthop. 150:252–60. https://doi.org/10.1016/j.ajodo.2016.01.017. DOI: 10.1016/j.ajodo.2016.01.017. PMID: 27476357.
crossref
4. Green MN, Bloom JM, Kulbersh R. 2017; A simple and accurate craniofacial midsagittal plane definition. Am J Orthod Dentofacial Orthop. 152:355–63. https://doi.org/10.1016/j.ajodo.2016.12.025. DOI: 10.1016/j.ajodo.2016.12.025. PMID: 28863916.
crossref
5. Dobai A, Markella Z, Vízkelety T, Fouquet C, Rosta A, Barabás J. 2018; Landmark-based midsagittal plane analysis in patients with facial symmetry and asymmetry based on CBCT analysis tomography. J Orofac Orthop. 79:371–9. https://doi.org/10.1007/s00056-018-0151-3. DOI: 10.1007/s00056-018-0151-3. PMID: 30255320.
6. Yoon KW, Yoon SJ, Kang BC, Kim YH, Kook MS, Lee JS, et al. 2014; Deviation of landmarks in accordance with methods of establishing reference planes in three-dimensional facial CT evaluation. Imaging Sci Dent. 44:207–12. https://doi.org/10.5624/isd.2014.44.3.207. DOI: 10.5624/isd.2014.44.3.207. PMID: 25279341. PMCID: PMC4182355.
7. Kim TY, Baik JS, Park JY, Chae HS, Huh KH, Choi SC. 2011; Determination of midsagittal plane for evaluation of facial asymmetry using three-dimensional computed tomography. Imaging Sci Dent. 41:79–84. https://doi.org/10.5624/isd.2011.41.2.79. DOI: 10.5624/isd.2011.41.2.79. PMID: 21977479. PMCID: PMC3174462.
8. Kim HJ, Kim BC, Kim JG, Zhengguo P, Kang SH, Lee SH. 2014; Construction and validation of the midsagittal reference plane based on the skull base symmetry for three-dimensional cephalometric craniofacial analysis. J Craniofac Surg. 25:338–42. https://doi.org/10.1097/SCS.0000000000000380. DOI: 10.1097/SCS.0000000000000380. PMID: 24469365.
9. An S, Lee JY, Chung CJ, Kim KH. 2017; Comparison of different midsagittal plane configurations for evaluating craniofacial asymmetry by expert preference. Am J Orthod Dentofacial Orthop. 152:788–97. https://doi.org/10.1016/j.ajodo.2017.04.024. DOI: 10.1016/j.ajodo.2017.04.024. PMID: 29173858.
10. Grissom MK, Gateno J, English JD, Jacob HB, Kuang T, Gonzalez CE, et al. 2022; Midsagittal plane first: building a strong facial reference frame for computer-aided surgical simulation. J Oral Maxillofac Surg. 80:641–50. https://doi.org/10.1016/j.joms.2021.11.016. DOI: 10.1016/j.joms.2021.11.016. PMID: 34942153. PMCID: PMC8983510.
11. Lee EH, Yu HS, Lee KJ, Han SS, Jung HD, Hwang CJ. 2020; Comparison of three midsagittal planes for three-dimensional cone beam computed tomography head reorientation. Korean J Orthod. 50:3–12. https://doi.org/10.4041/kjod.2020.50.1.3. DOI: 10.4041/kjod.2020.50.1.3. PMID: 32042715. PMCID: PMC6995832.
12. Cho HJ. 2009; A three-dimensional cephalometric analysis. J Clin Orthod. 43:235–52. discussion 235quiz 273https://pubmed.ncbi.nlm.nih.gov/19458456/. PMID: 19458456.
13. Trpkova B, Prasad NG, Lam EW, Raboud D, Glover KE, Major PW. 2003; Assessment of facial asymmetries from posteroanterior cephalograms: validity of reference lines. Am J Orthod Dentofacial Orthop. 123:512–20. https://doi.org/10.1016/S0889-5406(02)57034-7. DOI: 10.1016/S0889-5406(02)57034-7. PMID: 12750669.
14. Field A. Carmichael M, editor. 2013. Repeated-measures designs (GLM 4). Discovering statistics using IBM SPSS statistics. 4th ed. Sage;London: p. 543–90.
15. Nagasaka S, Fujimura T, Segoshi K. 2003; Development of a non-radiographic cephalometric system. Eur J Orthod. 25:77–85. https://doi.org/10.1093/ejo/25.1.77. DOI: 10.1093/ejo/25.1.77. PMID: 12608727.
16. Kwon TG, Park HS, Ryoo HM, Lee SH. 2006; A comparison of craniofacial morphology in patients with and without facial asymmetry--a three-dimensional analysis with computed tomography. Int J Oral Maxillofac Surg. 35:43–8. https://doi.org/10.1016/j.ijom.2005.04.006. DOI: 10.1016/j.ijom.2005.04.006. PMID: 15925488.
17. Williams RP, Rinchuse DJ, Zullo TG. 2014; Perceptions of midline deviations among different facial types. Am J Orthod Dentofacial Orthop. 145:249–55. https://doi.org/10.1016/j.ajodo.2013.02.034. DOI: 10.1016/j.ajodo.2013.02.034. PMID: 24485740.
18. Johnston CD, Burden DJ, Stevenson MR. 1999; The influence of dental to facial midline discrepancies on dental attractiveness ratings. Eur J Orthod. 21:517–22. https://doi.org/10.1093/ejo/21.5.517. DOI: 10.1093/ejo/21.5.517. PMID: 10565092.
19. Kim KS, Kim YJ, Lee KH, Kim YH, Kook YA. 2006; Level of perception of changed lip protrusion and asymmetry of the lower facial height. Korean J Orthod. 36:434–41. https://scienceon.kisti.re.kr/commons/util/originalView.do?cn=JAKO200609906156890&oCn=JAKO200609906156890&dbt=JAKO&journal=NJOU00293807.
20. Noh HK, Park HS. 2021; Does maxillary yaw exist in patients with skeletal Class III facial asymmetry? Am J Orthod Dentofacial Orthop. 160:573–87. https://doi.org/10.1016/j.ajodo.2020.05.025. DOI: 10.1016/j.ajodo.2020.05.025. PMID: 34332794.
21. Haraguchi S, Takada K, Yasuda Y. 2002; Facial asymmetry in subjects with skeletal Class III deformity. Angle Orthod. 72:28–35. https://pubmed.ncbi.nlm.nih.gov/11843270/. DOI: 10.1043/0003-3219(2002)072<0028:FAISWS>2.0.CO;2. PMID: 11843270.
22. Posnick JC, Fantuzzo JJ, Orchin JD. 2006; Deliberate operative rotation of the maxillo-mandibular complex to alter the A-point to B-point relationship for enhanced facial esthetics. J Oral Maxillofac Surg. 64:1687–95. https://doi.org/10.1016/j.joms.2005.11.118. DOI: 10.1016/j.joms.2005.11.118. PMID: 17052598.
23. Tyan S, Park HS, Janchivdorj M, Han SH, Kim SJ, Ahn HW. 2016; Three-dimensional analysis of molar compensation in patients with facial asymmetry and mandibular prognathism. Angle Orthod. 86:421–30. https://doi.org/10.2319/030915-142.1. DOI: 10.2319/030915-142.1. PMID: 26192894. PMCID: PMC8601728.
24. Ahn J, Kim SJ, Lee JY, Chung CJ, Kim KH. 2017; Transverse dental compensation in relation to sagittal and transverse skeletal discrepancies in skeletal Class III patients. Am J Orthod Dentofacial Orthop. 151:148–56. https://doi.org/10.1016/j.ajodo.2016.06.031. DOI: 10.1016/j.ajodo.2016.06.031. PMID: 28024769.
25. Kim HJ, Hong M, Park HS. 2019; Analysis of dental compensation in patients with facial asymmetry using cone-beam computed tomography. Am J Orthod Dentofacial Orthop. 156:493–501. https://doi.org/10.1016/j.ajodo.2018.10.025. DOI: 10.1016/j.ajodo.2018.10.025. PMID: 31582121.
26. Lee JY, Han SH, Ryu HS, Lee HM, Kim SC. 2018; Cone-beam computed tomography analysis of transverse dental compensation in patients with skeletal Class III malocclusion and facial asymmetry. Korean J Orthod. 48:357–66. https://doi.org/10.4041/kjod.2018.48.6.357. DOI: 10.4041/kjod.2018.48.6.357. PMID: 30450328. PMCID: PMC6234112.
27. Marianetti TM, Boccieri A, Pascali M. 2016; Reshaping of the anterior nasal spine: an important step in rhinoplasty. Plast Reconstr Surg Glob Open. 4:e1026. https://doi.org/10.1097/GOX.0000000000001026. DOI: 10.1097/GOX.0000000000001026. PMID: 27757343. PMCID: PMC5055009.

Figure 1
Graphical representation of landmark position. A, frontal view; B, top-down view; C, lateral view; D, clipping-lateral view; E, clipping-frontal view of the left condyle; F, oblique view for dental landmarks.
FZS, frontozygomatic suture; N, nasion; Or, orbitale; Mx, maxilla; ANS, anterior nasal spine; Go, gonion; Me, menton; Ba, basion; Po, porion; S, sella; RU1, right upper incisor; RU3, right upper canine; RU6, right upper first molar; RL1, right lower incisor; RL3, right lower canine; RL6, right lower first molar; R, right; L, left.
kjod-53-4-219-f1.tif
Figure 2
Graphical representation of the midsagittal planes (MSPs). A, MSP I; B, MSPs II and III; C, MSPs IV, V and VI.
FZS, frontozygomatic suture; N, nasion; FHP, Frankfort horizontal plane; Po, porion; Ba, basion; Or, orbitale; ANS, anterior nasal spine; S, sella; PNS, posterior nasal spine; R, right; L, left.
kjod-53-4-219-f2.tif
Figure 3
Graphical representation of measurement variables. A, transverse distance of landmarks relative to a midsagittal plane; B, maxillary skeletal yaw (other skeletal and dental yaws were calculated similarly according to their definition). Positive signs were assigned to the yaw and transverse distance of median landmarks if they were in the same direction as the menton deviation; C, ramus angles.
Mx, maxilla; ANS, anterior nasal spine; RU3, right upper canine; RU6, right upper first molar; U1, upper incisor; LU3, left upper canine; LU6, left upper first molar; MSP, midsagittal plane; Me, menton; Ndev, non-deviated side; Dev, deviated side; R, right; L, left.
kjod-53-4-219-f3.tif
Figure 4
Profile plots of measurement variables among different midsagittal planes (MSPs). A, anterior nasal spine deviation; B, maxillary transverse distance difference relative to the MSP, subtracting the non-deviated side from the deviated side; C, upper incisor deviation; D, maxillary canine transverse distance difference relative to the MSP, obtained by subtracting the non-deviated side from the deviated side; E, maxillary first molar transverse distance difference for the MSP, obtained by subtracting the non-deviated side from the deviated side; F, menton deviation; G, the ramus angle difference relative to the MSP, obtained by subtracting the non-deviated side from the deviated side; H, maxillary skeletal yaw; I, mandibular skeletal yaw; J, maxillary dental yaw; K, mandibular dental yaw. The red line denotes the asymmetric group, whereas the blue line denotes the symmetric group. Error bars indicate 95% confidence intervals for each variable.
FZS, frontozygomatic suture; N, nasion; FH, Frankfort horizontal plane; Ba, basion; ANS, anterior nasal spine; S, sella; PNS, posterior nasal spine; Mx, maxilla; Diff, difference; U1, upper incisor; U3, upper canine; U6, upper first molar; Me, menton.
kjod-53-4-219-f4.tif
Figure 5
Schematic diagrams showing changes in linear measurements relative to various midsagittal planes (MSPs). A, top-down view showing the MSP-yaw of MSP III; B, frontal view showing the MSP-roll of MSP IV. The dotted arrows denote the transverse distance between the first molars and the aforementioned MSPs.
Ba, basion; U6, upper first molar; N, nasion; ANS, anterior nasal spine; FH, Frankfort horizontal plane; R, right; L, left.
kjod-53-4-219-f5.tif
Table 1
Sample characteristics
Characteristic Symmetric group (mean ± SD) Asymmetric group (mean ± SD) Sig*
N 30 30 -
Age (yr) 20.40 ± 2.01 20.60 ± 2.92 0.758
SNA (°) 82.45 ± 2.86 81.88 ± 3.84 0.516
SNB (°) 86.25 ± 3.39 85.33 ± 4.31 0.366
ANB (°) –3.79 ± 2.28 –3.45 ± 2.02 0.543
Wits appraisal (mm) –12.17 ± 3.91 –12.10 ± 3.46 0.938
SN-MP (°) 35.15 ± 6.40 34.64 ± 6.31 0.757
Menton deviation (mm) 1.25 ± 0.53 9.09 ± 2.56 0.000

SD, standard deviation; SNA, sella-nasion-point A; SNB, sella-nasion-B point; ANB, A point-nasion-B point; SN, sella-nasion plane; MP, mandibular plane.

*Results of independent t-test.

Table 2
Definitions of skeletal and dental landmarks
Landmark Definition
N The most superior point of the frontonasal suture
S The 3-dimensional center point of the sella turcica space
Ba The middorsal point of the anterior margin of the foramen magnum
Co_R, L The lateral pole of the condylar head
Or_R, L The most inferior point of the bony orbit
Or_mid The midpoint of Or_R and Or_L
Po_R, L The most superior point of the external auditory meatus
Po_mid The midpoint of Po_R and Po_L
FZS_R, L The intersection of the frontozygomatic suture and the margin of the bony orbit
Mx_R, L The most concave point on the contour of the maxilla around molars and the lower contour of the zygomaticomaxillary process
Mx_mid The midpoint of Mx_R and Mx_L
ANS The tip of the anterior nasal spine
PNS The tip of the posterior nasal spine
Me The most inferior point of the symphysis of the mandible
Go_R, L The midpoint of the bony border of the mandibular angle
Go_mid The midpoint of Go_R and Go_L
RU1 The midpoint of the incisor edge of the right upper incisor
LU1 The midpoint of the incisor edge of the left upper incisor
U1_mid The midpoint between RU1 and LU1
RU3 The cusp tip of the right upper canine
LU3 The cusp tip of the left upper canine
U3_mid The midpoint between RU3 and LU3
RU6 The mesiobuccal cusp tip of the right upper first molar
LU6 The mesiobuccal cusp tip of the left upper first molar
U6_mid The midpoint between RU6 and LU6
RL1 The midpoint of the incisor edge of the right lower incisor
LL1 The midpoint of the incisor edge of the left lower incisor
L1_mid The midpoint between RL1 and LL1
RL3 The cusp tip of the right lower canine
LL3 The cusp tip of the left lower canine
L3_mid The midpoint of RL3 and LL3
RL6 The mesiobuccal cusp tip of the right lower first molar
LL6 The mesiobuccal cusp tip of the left lower first molar
L6_mid The midpoint between RL6 and LL6

N, nasion; S, sella; Ba, basion; Co, condyle; Or, orbitale; Po, porion; FZS, frontozygomatic suture; Mx, maxilla; ANS, anterior nasal spine; PNS, posterior nasal spine; Me, menton; Go, gonion; RU1, right upper incisor; LU1, left upper incisor; U1, upper incisor; RU3, right upper canine; LU3, left upper canine; U3, upper canine; RU6, right upper first molar; LU6, left upper first molar; U6, upper first molar; RL1, right lower incisor; LL1, left lower incisor; RL3, right lower canine; LL3, left lower canine; RL6, right lower first molar; LL6, left lower first molar; R, right; L, left.

Table 3
Definitions of the reference planes
Planes Definition
MSP I The plane passing through N, perpendicular to the line between FZS_R and FZS_L
MSP II The plane perpendicular to FHP, containing both Ba and N
MSP III The plane perpendicular to FHP, containing both Ba and ANS
MSP IV The plane constructed by Ba, N, and ANS
MSP V The plane constructed by PNS, N, and ANS
MSP VI The plane constructed by Ba, S, and N
FHP II, III The plane containing Or_R, Or_L, and Po_mid
FHP I, IV, V, VI The plane perpendicular to the corresponding MSP passing through both Or_mid and Po_mid

MSP, midsagittal plane; FHP, Frankfort horizontal plane; FZS, frontozygomatic suture; Ba, basion; S, sella; ANS, anterior nasal spine; PNS, posterior nasal spine; N, nasion; Or, orbitale; Po, porion; R, right; L, left.

Table 4
Definitions of measurement variables
Measurements Definition
ANS The distance from the MSP to ANS
Mx_Dev The distance from the MSP to the Mx point on the deviated side
Mx_Ndev The distance from the MSP to the Mx point on the non-deviated side
Mx_Diff The value obtained by subtracting Mx_Ndev from Mx_Dev
Ramus angle_Dev The angle between the MSP and the line connecting Co and Go on the deviated side
Ramus angle_Ndev The angle between the MSP and the line connecting Co and Go on the non-deviated side
Ramus angle_Diff The value obtained by subtracting Ramus angle_Ndev from Ramus angle_Dev
Menton The distance from the MSP to Me
U1 The distance from the MSP to U1_mid
U3_Dev The distance from the MSP to the cusp tip of the upper canine on the deviated side
U3_Ndev The distance from the MSP to the cusp tip of the upper canine on the non-deviated side
U3_Diff The value obtained by subtracting U3_Ndev from U3_Dev
U6_Dev The distance from the MSP to the mesiobuccal cusp tip of the upper first molar on the deviated side
U6_Ndev The distance from the MSP to the mesiobuccal cusp tip of the upper first molar on the non-deviated side
U6_Diff The value obtained by subtracting U6_Ndev from U6_Dev
Maxillary skeletal yaw The angle between the MSP and a line, projected onto the FHP, connecting ANS and Mx_mid
Maxillary dental yaw The angle between the MSP and a line, projected onto the FHP, connecting U1_mid and U6_mid
Mandibular skeletal yaw The angle between the MSP and a line, projected onto the FHP, connecting Me and Go_mid
Mandibular dental yaw The angle between the MSP and a line, projected onto the FHP, connecting L1_mid and L6_mid

Dev, deviated side; Ndev, non-deviated side; Diff, difference; MSP, midsagittal plane; Co, condyle; Mx, maxilla; Me, mentions; ANS, anterior nasal spine; Go, gonion; U1, upper incisor; U3, upper canine; U6, upper first molar.

Table 5
Descriptive statistics
Measurements Group MSP I (FZS, N) MSP II (FH, Ba-N) MSP III (FH, Ba-ANS) MSP IV (Ba-N-ANS) MSP V (PNS-N-ANS) MSP VI (Ba-S-N)
ANS Sym 0.07 ± 0.75 0.00 ± 0.93 0.00 ± 0.00 0.00 ± 0.00 0.00 ± 0.00 −0.20 ± 2.15
Asym 1.31 ± 1.20 1.32 ± 1.40 0.00 ± 0.00 0.00 ± 0.00 0.00 ± 0.00 0.10 ± 2.52
Mx_Dev Sym 32.76 ± 2.53 32.55 ± 2.54 32.55 ± 2.50 32.56 ± 2.51 32.58 ± 2.39 32.36 ± 3.55
Asym 33.40 ± 1.90 33.32 ± 1.98 32.39 ± 1.48 32.21 ± 1.46 32.48 ± 1.43 32.28 ± 2.14
Mx_Ndev Sym 32.60 ± 2.63 32.80 ± 2.64 32.80 ± 2.56 32.78 ± 2.56 32.76 ± 2.61 32.94 ± 2.95
Asym 31.31 ± 1.80 31.37 ± 2.03 32.31 ± 2.15 32.48 ± 2.20 32.21 ± 2.09 32.38 ± 3.63
Mx_Diff Sym 0.16 ± 1.68 −0.25 ± 1.74 −0.25 ± 1.31 −0.23 ± 1.35 −0.18 ± 1.12 −0.58 ± 4.34
Asym 2.08 ± 1.78 1.95 ± 2.38 0.08 ± 1.77 −0.26 ± 1.86 0.27 ± 1.52 −0.09 ± 5.01
Ramus angle_Dev Sym 12.97 ± 4.40 13.03 ± 4.30 13.04 ± 4.29 13.01 ± 4.18 13.02 ± 4.19 13.25 ± 4.72
Asym 9.70 ± 4.89 9.66 ± 4.93 9.72 ± 4.89 10.99 ± 4.77 11.01 ± 4.76 10.87 ± 5.29
Ramus angle_Ndev Sym 13.82 ± 4.13 13.75 ± 4.24 13.74 ± 4.26 13.77 ± 4.50 13.75 ± 4.51 13.53 ± 4.90
Asym 14.97 ± 3.82 15.00 ± 4.00 14.90 ± 4.00 13.64 ± 3.97 13.60 ± 3.98 13.76 ± 4.20
Ramus angle_Diff Sym −0.85 ± 2.66 −0.72 ± 2.70 −0.70 ± 2.69 −0.75 ± 3.12 −0.73 ± 3.17 −0.28 ± 5.20
Asym −5.27 ± 4.32 −5.34 ± 4.73 −5.18 ± 4.65 −2.64 ± 4.36 −2.59 ± 4.35 −2.89 ± 5.77
Me Sym 1.14 ± 0.49 0.97 ± 1.49 0.96 ± 1.22 0.99 ± 1.74 0.98 ± 1.73 0.58 ± 4.52
Asym 7.44 ± 3.27 7.48 ± 3.37 6.18 ± 3.19 4.55 ± 3.81 4.59 ± 3.77 4.77 ± 6.54
U1 Sym 0.04 ± 0.99 −0.06 ± 1.10 −0.05 ± 0.78 −0.04 ± 0.99 −0.04 ± 1.01 −0.34 ± 3.33
Asym 2.00 ± 1.33 2.04 ± 1.63 0.66 ± 1.02 0.01 ± 1.36 0.00 ± 1.35 0.17 ± 3.62
U3_Dev Sym 18.28 ± 1.31 18.15 ± 1.57 18.15 ± 1.37 18.16 ± 1.48 18.16 ± 1.48 17.86 ± 3.66
Asym 19.50 ± 1.83 19.51 ± 1.86 18.25 ± 1.33 17.59 ± 1.56 17.65 ± 1.54 17.72 ± 3.69
U3_Ndev Sym 17.97 ± 1.74 18.10 ± 1.63 18.10 ± 1.47 18.08 ± 1.56 18.08 ± 1.55 18.36 ± 3.16
Asym 15.32 ± 1.86 15.30 ± 2.10 16.54 ± 1.63 17.20 ± 1.78 17.13 ± 1.74 17.07 ± 3.81
U3_Diff Sym 0.31 ± 1.68 0.05 ± 1.90 0.05 ± 1.18 0.08 ± 1.61 0.08 ± 1.58 −0.49 ± 6.34
Asym 4.18 ± 2.93 4.21 ± 3.27 1.71 ± 1.96 0.39 ± 2.49 0.52 ± 2.41 0.65 ± 7.16
U6_Dev Sym 28.52 ± 1.95 28.29 ± 2.14 28.29 ± 2.04 28.25 ± 2.16 28.25 ± 2.25 28.05 ± 3.54
Asym 29.97 ± 2.21 29.91 ± 2.39 28.94 ± 1.77 28.25 ± 1.58 28.37 ± 1.69 28.41 ± 3.20
U6_Ndev Sym 27.97 ± 2.28 28.19 ± 2.29 28.19 ± 2.19 28.15 ± 2.33 28.22 ± 2.35 28.40 ± 3.53
Asym 25.64 ± 1.49 25.68 ± 1.86 26.64 ± 1.62 27.28 ± 1.91 27.22 ± 2.11 27.17 ± 3.86
U6_Diff Sym 0.55 ± 1.71 0.10 ± 2.17 0.09 ± 1.73 0.10 ± 2.31 0.03 ± 2.50 −0.35 ± 5.92
Asym 4.32 ± 2.73 4.23 ± 3.39 2.30 ± 2.19 0.98 ± 2.35 1.15 ± 2.79 1.25 ± 6.59
Maxillary skeletal yaw Sym −0.01 ± 1.61 0.39 ± 1.69 0.41 ± 1.60 0.32 ± 1.90 0.24 ± 1.41 0.46 ± 2.71
Asym 0.53 ± 2.13 0.70 ± 2.14 −0.12 ± 1.91 1.25 ± 2.37 0.32 ± 1.83 1.21 ± 2.62
Maxillary dental yaw Sym −0.49 ± 1.64 −0.12 ± 1.92 −0.10 ± 1.99 −0.10 ± 1.89 −0.18 ± 1.81 −0.09 ± 1.96
Asym −0.34 ± 1.18 −0.16 ± 2.03 −0.99 ± 2.33 −0.15 ± 2.03 −1.07 ± 1.94 −0.08 ± 2.08
Mandibular skeletal yaw Sym 0.11 ± 1.21 0.38 ± 1.52 0.40 ± 1.39 0.42 ± 1.42 0.35 ± 1.57 0.23 ± 1.95
Asym 4.07 ± 2.78 4.26 ± 2.47 3.43 ± 2.69 3.00 ± 2.96 2.11 ± 3.38 3.15 ± 3.71
Mandibular dental yaw Sym 0.56 ± 2.50 0.95 ± 2.50 0.96 ± 2.53 0.96 ± 2.53 0.88 ± 2.18 1.06 ± 2.70
Asym 3.62 ± 2.69 3.80 ± 2.92 2.97 ± 3.24 4.13 ± 2.80 3.21 ± 2.80 4.17 ± 3.02

Values are presented as mean ± standard deviation.

MSP, midsagittal plane; FZS, frontozygomatic suture; N, nasion; FH, Frankfort horizontal plane; Ba, basion; ANS, anterior nasal spine; PNS, posterior nasal spine; S, sella; Sym, symmetric; Asym, asymmetric; Dev, deviated side; Ndev, non-deviated side; Diff, difference; U1, upper incisor; U3, upper canine; U6, upper first molar; Me, menton; Mx, maxilla.

Table 6
The diagnostic difference of linear measurements between upper facial MSP and ANS-associated MSP in the asymmetric group
Measurements Upper facial MSP(A) ANS-associated MSP(B) Difference (A–B) 95% CI Sig*
ANS 1.32 ± 1.27 0.00 ± 0.00 1.32 ± 1.27 0.84, 1.79 0.000
Mx_Dev 33.36 ± 1.89 32.34 ± 1.42 1.02 ± 1.02 0.63, 1.40 0.000
Mx_Ndev 31.34 ± 1.88 32.34 ± 2.13 −1.00 ± 1.04 −1.39, −0.61 0.000
Mx_Diff 2.02 ± 1.92 0.00 ± 1.63 2.02 ± 2.06 1.25, 2.79 0.000
U1 2.02 ± 1.43 0.00 ± 1.35 2.01 ± 1.98 1.28, 2.75 0.000
U3_Dev 19.50 ± 1.79 17.62 ± 1.55 1.88 ± 1.84 1.19, 2.57 0.000
U3_Ndev 15.31 ± 1.94 17.17 ± 1.76 −1.86 ± 1.84 −2.55, −1.17 0.000
U3_Diff 4.19 ± 2.98 0.45 ± 2.44 3.74 ± 3.68 2.36, 5.11 0.000
U6_Dev 29.94 ± 2.25 28.31 ± 1.61 1.63 ± 1.52 1.06, 2.19 0.000
U6_Ndev 25.66 ± 1.62 27.25 ± 1.99 −1.58 ± 1.51 −2.15, −1.02 0.000
U6_Diff 4.28 ± 2.92 1.06 ± 2.53 3.21 ± 3.02 2.09, 4.34 0.000
Ramus angle_Dev 9.68 ± 4.90 11.00 ± 4.77 −1.32 ± 1.28 −1.80, −0.84 0.000
Ramus angle_Ndev 14.98 ± 3.90 13.62 ± 3.98 1.37 ± 1.32 0.87, 1.86 0.000
Ramus angle_Diff −5.30 ± 4.48 −2.62 ± 4.35 −2.69 ± 2.60 −3.66, −1.72 0.000
Me 7.46 ± 3.26 4.57 ± 3.79 2.89 ± 2.85 1.82, 3.95 0.000

Values are presented as mean ± standard deviation.

CI denotes the confidence interval of the difference (A–B); *obtained using a paired t-test between the upper facial and ANS-associated MSPs.

MSP, midsagittal plane; ANS, anterior nasal spine; CI, confidence interval; Mx, maxilla; Dev, deviated side; Ndev; non-deviated side; Diff, difference; Me, menton; U1, upper incisor; U3, upper canine; U6, upper first molar.

TOOLS
Similar articles