Journal List > Lab Med Online > v.13(3) > 1516083362

Liver Fibrosis Biomarker Validation Using Machine Learning Algorithms

Abstract

Background

Liver fibrosis which causes several liver diseases, requires early screening and management. The gold standard for fibrosis assessment, liver biopsy, has recently been replaced by noninvasive scores. In this study, we validated liver fibrosis-associated biomarkers using machine learning techniques applied in medical research and evaluated their prediction models.

Methods

Noninvasive scores were assayed in 144 patients who underwent transient elastography (TE). The patients were divided into three groups (<7 kPa, 7–10 kPa, ≥10 kPa) according to their TE results. Feature selection and modeling for predicting liver fibrosis were performed using random forest (RF) and support vector machine (SVM).

Results

Considering the mean decrease in impurity, permutation importance, and multicollinear analysis, the important features for differentiating between the three groups were Mac-2 binding protein glycosylation isomer (M2BPGi), platelet count, and aspartate aminotransferase (AST). Using these features, the RF and SVM models showed equivalent or better performance than noninvasive scores. The sensitivities of RF and SVM models for predicting ≥7 kPa TE results were higher than noninvasive scores (83.3% and 90.0% vs. <80%, respectively). The sensitivity and specificity of RF and SVM models for ≥10 kPa TE result was 100%.

Conclusions

We used machine learning techniques to verify the usefulness of established serological biomarkers (M2BPGi, PLT, and AST) that predict liver fibrosis. Conclusively, machine learning models showed better performance than noninvasive scores.

초록

배경

다양한 간질환의 원인인 간섬유화는 조기 선별과 관리가 필요하다. 간섬유화의 표준 진단법인 간 생검은 비침습적 점수들로 대체되고 있다. 본 연구는 의학 분야에서 사용되고 있는 기계 학습 기법을 사용하여 간섬유화와 관련된 혈청 바이오마커를 검증하고 예측 모델을 평가했다.

방법

순간탄성측정법(transient elastography, TE)을 받은 144명의 환자들에서 비침습적 점수가 계산되었다. TE검사 결과에 따라 세 그룹(<7 kPa, 7–10 kPa, ≥10 kPa)으로 나누었다. 간섬유화의 예측을 위한 특징 선택(feature selection)과 전산 모델링(computatio-nal modeling)은 RF (random forest)와 SVM (support vector machine)을 사용하였다.

결과

평균 불순도 감소(mean decrease in impurity), 순열 중요도(permutation importance) 및 다중 공선(multicollinear) 분석 결과를 고려한 세 그룹을 구별하는 중요한 특징은 M2BPGi (Mac-2 binding protein glycosylation isomer), 혈소판수 및 아스파르테이트 아미노전이효소(AST)로 확인되었다. 이 특징을 사용한 RF 및 SVM 모델은 비침습적 점수와 동등하거나 더 우수한 성능을 보였다. TE 결과가 7 kPa 이상인 결과를 예측하기 위한 RF와 SVM 모델의 민감도는 비침습적 점수보다 높았다(각각 83.3%, 90.0% 대 <80%). TE 결과가 10 kPa 이상인 결과에 대한 RF와 SVM 모델의 민감도와 특이도는 100%였다.

결론

본 연구를 통해 기계 학습 기법을 사용하여 간섬유화를 예측하는 혈청학적 바이오마커(M2BPGi, 혈소판수 및 AST)의 유용성을 검증했다. 또한 기계 학습 모델은 비침습적 점수보다 더 우수한 성능을 보여주었다.

INTRODUCTION

Acute and chronic liver inflammation induces epithelial cell injury and leads to fibrosis via fibrotic effector cell activation and proliferation [1]. Liver fibrosis can cause cirrhosis, leading to portal hypertension, variceal bleeding, ascites, and in some cases, hepatocellular carcinoma. However, hepatocytes can regenerate, making liver fibrosis reversible through therapeutic interventions [2, 3]. A liver biopsy is the “gold standard” for assessing liver fibrosis severity. However, it has limitations, such as sampling error and observer subjectivity in histological interpretation [4, 5]. Additionally, liver biopsy is an invasive method with rare but potentially life-threatening complications [5]. Therefore, noninvasive methods (NIMs) have become necessary to estimate the stage of liver fibrosis in patients.
NIMs use several biomarkers and their calculation formulas, such as the aspartate aminotransferase (AST)-platelet ratio index (APRI), the fibrosis index based on four factors (FIB-4), nonalcoholic fatty liver disease (NAFLD) fibrosis score (NFS), Mac-2 binding protein glycosylation isomer (M2BPGi), and radiological tests, such as transient elastography (TE, FibroScan) [6, 7]. The FIB-4 index is calculated using a formula based on patient age, AST, ALT, and platelet count (PLT) [7]. The NFS is based on six routine clinical parameters: age, body mass index (BMI), presence of diabetes or impaired fasting glucose, AST/ALT ratio, PLT, and albumin. M2BPGi is a glycoprotein produced by hepatic stellate cells and a novel biomarker to estimate liver fibrosis because the liver secretes it during fibrosis progression and can thus be evaluated using a single serologic test [8-11]. An automated immunoassay detects abnormal M2BPGi glycosylation related to liver fibrosis, which becomes agglutinated and can be detected by lectin [12].
FibroScan allows noninvasive measurement of liver stiffness using a low-frequency 50 Hz elastic shear wave transmitted through the liver [13]. The velocity of the shear wave is measured and directly related to tissue stiffness, which, in turn, is associated with the stage of fibrosis. The method is fast, reproducible, and has reliable intra- and inter-observer agreements [14]. In a meta-analysis, FibroScan had an area under the receiver operating characteristic (ROC) curve of 0.84–1.00, excluding advanced fibrosis [15]. Furthermore, FibroScan had high negative and modest positive predictive values, indicating its usefulness as a screening test to determine whether a liver biopsy is required. However, various studies showed different cutoff values when determining the liver fibrosis stage, and liver stiffness measurement values falsely increase in patients with high BMI and/or central obesity [16].
Artificial intelligence (AI) technology has recently advanced substantially, and applying AI to several aspects of medicine has become common, particularly to support diagnostics [17-19]. Machine learning (ML) algorithms have been developed to predict disease risk and outcomes using multiple clinical parameters in liver diseases [20, 21]. ML is the scientific discipline focusing on how computers learn from data [22]. ML methods are well suited for classification tasks and use an unbiased approach to identify unexpected informative variables. Noninvasive biomarkers and AI integration are leading to new advances in liver fibrosis prediction. In a study by Feng et al. [23], ML algorithms were used to discover noninvasive urine proteomic biomarkers for predicting NA-FLD. Protein levels were measured using ultra-performance liquid chromatography-mass spectrometry (UPLC-MS) in urine samples. The resulting novel protein profile had an area under the ROC (AUC) values of ≥0.80 in the independent validation cohort. Although urine biomarkers offer advantages in accessibility and invasiveness compared to blood tests, they pose disadvantages because their measurement methods require a high degree of skill and less verification data than existing serological biomarkers. Despite ongoing research on novel biomarkers, serological tests remain helpful in predicting liver fibrosis.
In this study, we used ML techniques to validate the diagnostic performance of known liver fibrosis-associated serological biomarkers. Furthermore, the performance of liver fibrosis prediction models using ML algorithms was compared with that of NIMs.

MATERIALS AND METHODS

1. Study Samples

Participants were recruited from the Kangbuk Samsung Health Study, which was a cohort study of Korean males and females who undergo comprehensive annual or biennial examinations at the Kangbuk Samsung Hospital Healthcare Screening Center in South Korea. This study enrolled 186 participants who underwent elastography for screening liver fibrosis with a comprehensive health checkup from November 2017 to April 2019. Patients with the following conditions were excluded from the study: 1) incomplete data, 2) evidence of any cancer and other chronic liver diseases, including autoimmune hepatitis, hepatitis B or C, or alcoholic liver disease, 3) medications, such as ursodeoxycholic acid, 4) advanced liver disease, hemangioma, and hepatic congestion, and 5) obesity (BMI of ≥31). The following clinical information, including underlying diseases and laboratory data, was collected by reviewing the medical records: sex, age, BMI, hypertension (HTN), diabetes mellitus (DM), hyperlipidemia, AST, ALT, gamma-glutamyltransferase (GGT), total bilirubin, albumin, creatinine (Cr), white blood cell count (WBC), PLT, and prothrombin time (PT). This study was approved by the Institutional Review Board of Kangbuk Samsung Hospital (KBSMC 2017-08-015), and the requirement for informed consent was waived.

2. Transient elastography (TE) (FibroScan)

A liver biopsy was not performed on the subjects of this study because none had severe liver disease. Therefore, the stages of liver fibrosis were classified based on TE and performed by experienced radiologists using FibroScan (Echosens, Paris, France) with an M probe. Patients were placed in a supine position with the right upper arm abducted, and the probe was vertically positioned at the intercostal spaces above the right lobe of the liver. The median of 10 valid measurements was expressed in kilopascals (kPa) [24, 25]. The following stages of fibrosis were defined based on previous studies [14, 15, 26]: F0/1 with <7.0 kPa, presumed no or minimal fibrosis; F2 with ≥7.0 kPa, presumed moderate fibrosis; F3 with ≥10.0 kPa, presumed severe fibrosis; and F4 with ≥13 kPa, presumed cirrhosis. We classified the three groups based on 7.0 kPa; group 1, including F0/1; group 2, including F2; and group 3, including F3/4.

3. Serum M2BPGi

Serum samples were collected from subjects that were requested for liver fibrosis assessment using TE. M2BPGi levels were measured from frozen sera previously collected. An immunoassay based on the lectin antibody sandwich method was performed using an automatic immune analyzer (HISCL-5000, Sysmex, Kobe, Japan) to quantify M2BPGi. The measured result was presented as a cutoff index (COI) by the following formula:
M2BPGi COI=(M2BPGisample-M2BPGiNC)÷(M2BPGiPC-M2BPGiNC), where M2BPGisample is the measured value of the patient sample, M2BPGiNC is the negative control value, and M2BPGiPC is the positive control value, which was provided by the manufacturer. The positive control was used as a preliminarily standardized calibration solution to yield a COI value of 1.0 [27].

4. Noninvasive scores

APRI, FIB-4, and NFS were calculated using laboratory data as follows [7, 28]:
AP RI=[AST (U/L)/upper limit of reference interval of AST (U/L) ×100]/PLT (×109/L)
FIB-4=[age (year)×AST (U/L)]/[PLT (×109/L)×√ALT (U/L)]
NF S=-1.675+0.037×age (year)+0.094×BMI (kg/m2)+1.13×impaired fasting glucose/diabetes (yes=1, no=0)+0.99×AST/ALT ratio-0.013×PLT (×109/L)-0.66×albumin (g/dL)

5. Feature selection

After reviewing previous studies on NIMs [10, 25, 28], 16 features were selected: sex, age, BMI, HTN, DM, hyperlipidemia, AST, ALT, GGT, total bilirubin, albumin, Cr, WBC, PLT, PT, and M2BPGi. Standard preprocessing methods were performed, such as one-hot encoding for categorical features and normalization for numerical features. One-hot encoding mitigates categorical data in ML. The method turns categorical features into binary features. The mean decrease in impurity (MDI) [29] and permutation importance (PI) [30] was calculated using a random forest (RF) [31] as a classifier to evaluate the feature importance in the three groups. The mean decrease in impurity was used in decision tree algorithms, such as RF, to evaluate the importance of a feature in predicting the target variable. Impurity indicates how well a split separates the classes in a node of the tree. If a feature creates splits that result in highly homogeneous classes, then it is considered important, and its mean decrease in impurity value will be high. The mean decrease in the impurity of a feature is calculated by averaging the impurity decrease for that feature over all the decision trees in the ensemble in the case of RFs. The feature with the highest mean decrease in impurity is considered the most important feature in predicting the target variable. Permutation importance evaluates how much the model’s performance decreases when the values of a given feature are randomly permuted (shuffled) across the data samples while leaving the target variable unchanged. The decrease in the accuracy of a model following permutation reflects the importance of the feature in the model. The default configuration provided by the sci-kit-learn library (v1.0.2) was used for the RF. Top-ranked features based on the MDI and the PI were selected.

6. Computational modeling and validation

After reviewing previous studies on liver diseases [20, 21], we used ML algorithms for our computational modeling and the RF and support vector machine (SVM) with linear kernel [32] using selected features. The models were validated using five-fold cross-validation, in which the total dataset was randomly split into subsets (train and test datasets) five times to evaluate the model performance on the test dataset. The ROC curves were applied to evaluate the performance of three ML models, and APRI, FIB-4, NFS, and M2BPGi were used to diagnose moderate fibrosis (groups 2–3, ≥7.0 kPa) or severe fibrosis (group 3, ≥10.0 kPa). The model performance was evaluated using AUC, accuracy, sensitivity, and specificity. The sensitivity and specificity were calculated at Youden’s point, which is obtained by maximizing the difference between the true- and false-positive rates. The AUC results were considered excellent (0.9–1), good (0.8–0.9), fair (0.7–0.8), poor (0.6–0.7), and failed (0.5–0.6).

7. Statistical analysis and visualization

The IBM statistical package for the social sciences version 20 (IBM Corp. Released 2011. IBM SPSS Statistics for Windows, Version 20.0. Armonk, NY: IBM Corp.) was used for statistical analysis. Baseline characteristics were presented as a number, mean, or median with percentage, standard deviation, or interquartile range (IQR, Q1–Q3) and tested using an independent t-test, Mann—Whitney U-test, Pearson’s chi-square test, or Fisher’s exact test. The ROC curves were plotted using the Matplotlib library [33]. The feature importance, ML modeling, and ROC analysis with five-fold cross-validation were performed by Python with Scikit-learn-the machine learning library (https://scikit-learn.org/stable/auto_examples/index.html) [34]. The level of statistical significance was set at P<0.05.

RESULTS

A total of 144 participants were included in this study. The characteristics of the study population are summarized in Table 1. Of the total, 83 (57.6%) were males, and the mean age was 55±14 years. The mean BMI was 24.5±2.7 kg/m2. HTN was determined in 33 (22.9%) patients; 30 (20.8%) had DM, and 53 (36.8%) had hyperlipidemia. The liver fibrosis classification using FibroScan determined 115 (79.9%), 6 (4.2%), and 23 (16.0%) patients belonged to group 1 (no or minimal), group 2 (moderate), and group 3 (severe), respectively. A significant difference was found between the three groups regarding laboratory findings, except for ALT and Cr. All noninvasive scores were significantly different in group 1 vs. group 2 vs. group 3 (except for APRI in group 1 vs. group 2, P=0.313) (Fig. 1).

1. Feature importance

The MDI and PI of 16 features (four categorical and twelve numerical features) were calculated (Fig. 2). Considering the MDI and PI pattern, the important features for discriminating between the three groups were M2BPGi, PLT, and AST.

2. Model performance

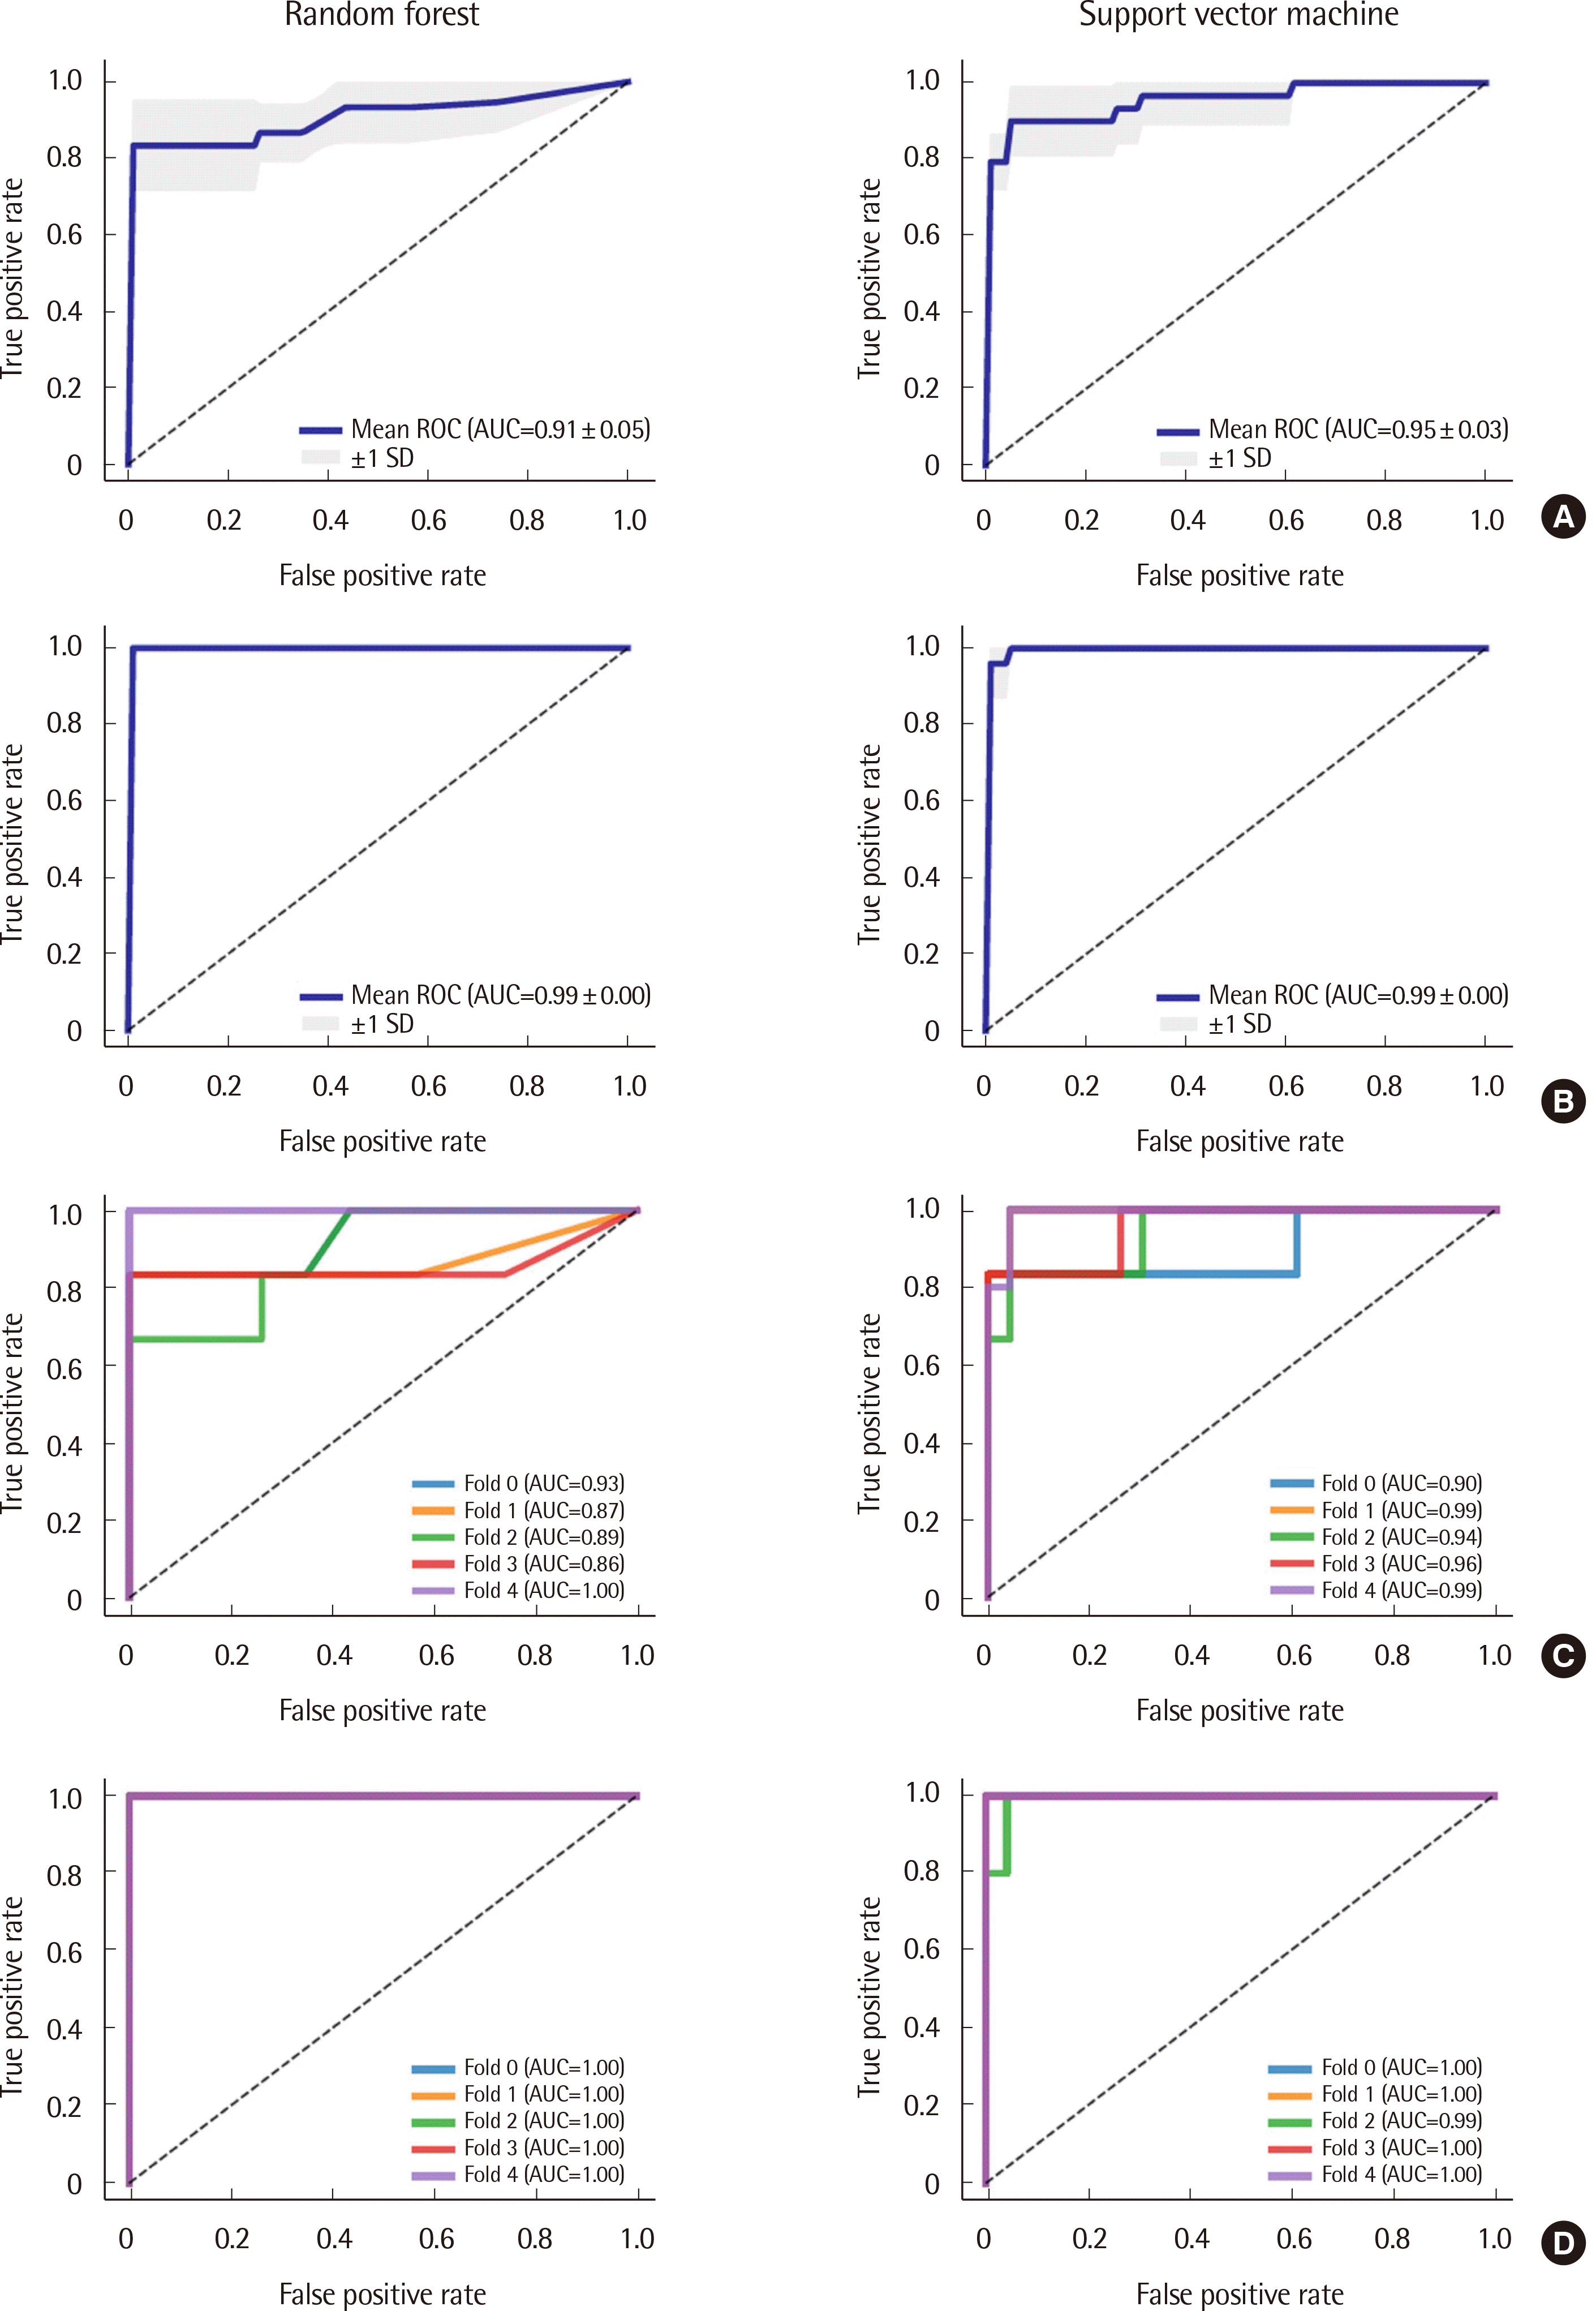
The RF and SVM models predicting moderate fibrosis (group 2-3, ≥7 kPa) or severe fibrosis (group 3, ≥10 kPa) were generated using three features (M2BPGi, AST, and PLT). The ROC curves with five-fold cross-validation were plotted to evaluate the model performance (Fig. 3). The AUCs for the RF and SVM models to predict fibrosis were 0.906±0.052 and 0.952±0.035 for predicting moderate fibrosis and 0.995±0.000 and 0.993±0.003 for severe fibrosis, respectively. To predict moderate fibrosis, the RF model had a sensitivity of 83.3%±10.5% and a specificity of 100%±0.0%. The SVM model had a sensitivity of 90.0%±8.2% and a specificity of 97.4%±2.1%. To predict severe fibrosis, the RF model had a sensitivity of 100%±0.0% and a specificity of 100%±0.0%. The SVM model had a sensitivity of 100%±0.0% and a specificity of 99.2%±1.7%. Simple ROC curves of APRI, FIB-4, NFS, and M2BPGi for diagnosing moderate or severe fibrosis were analyzed. To diagnose moderate fibrosis, the AUCs of APRI, FIB-4, NFS, and M2BPGi were 0.891, 0.910, 0.913, and 0.922, respectively; the sensitivity was 72.4%, 75.9%, 72.4%, and 75.9%, respectively; and the specificity was 95.7%, 93.0%, 95.7%, and 96.5%, respectively. To diagnose severe fibrosis, the AUCs of APRI, FIB-4, NFS, and M2BPGi were 0.917, 0.882, 0.864, and 0.903, respectively; the sensitivity was 82.6%, 87.0%, 82.6%, and 87.0%, respectively; the specificity was 96.7%, 92.6%, 94.2%, and 97.5%, respectively. All models had an AUC of excellent performance except for the APRI of the moderate fibrosis group. The sensitivity of APRI, FIB-4, NFS, and M2BPGi for moderate fibrosis was <80%. The sensitivity and specificity of the RF model for the severe fibrosis group were 100%. All models had an accuracy of >90%, except for the FIB-4 of the moderate fibrosis group. The performance of the ROC curves is summarized in Table 2.

DISCUSSION

This study identified three features, M2BPGi, PLT, and AST, using ML methods, as the top-ranked significant features to evaluate liver fibrosis, based on 16 features, including information for underlying diseases and laboratory results. Among the three features, the most important feature based on MDI and PI was M2BPGi. Several investigators validated the usefulness of M2BPGi to assess liver fibrosis in patients with primary biliary cirrhosis [35, 36], biliary atresia [37], autoimmune hepatitis [38], NFLD [39-42], and hepatitis B or C infection. The higher the M2BPGi value, the higher the probability of fibrosis and progression to liver cancer [39, 43, 44]. PLT and AST, as the next important factor after M2BPGi, were common components of APRI, FIB-4, and NFS [7, 28]. This study used ML algorithms to validate the usefulness of well-known biomarkers, unlike the above studies that evaluated serological biomarkers of liver fibrosis using general statistical methods. Several reports using AI techniques, including ML, have been used mainly to build predictive models in liver disease related to fibrosis [20, 21]. However, this study focused on demonstrating their reproducibility using ML methods rather than presenting a new predictive model because these serological biomarkers already show reliable performance in predicting liver fibrosis.
The RF and SVM models showed equivalent or better performance than NIMs. The sensitivity and specificity of the ML models were better than those of NIMs. The RF is a type of nonlinear classifier that consists of an ensemble of decision trees [31]. The predicted probability computed by the RF is the average over the predictions of all decision trees that comprise the forest. A majority vote of these decision trees offsets any bias against the variance across the tree predictions. SVM builds classification models using a transformed set of features in higher dimensions [45]. All ML models split the analysis dataset into training and test sets. The ML model learns from the training set and then evaluates the model’s performance using the test set. Overfitting occurs when the model learns the details and noise of the training data to such an extent that it negatively affects the model’s performance on new data. Thus, we used feature selection to reduce the number of variables and simplify the model to avoid overfitting. Additionally, stratified five-fold cross-validation was used to avoid overfitting due to the small number of samples.
Feature selection by ML methods can discover new variables as predictors [22]. However, many cases report that these previously unknown variables may likely remain missing from cohort data. This study performed the feature selection for predicting liver fibrosis targeting 16 variables, but only liver disease-related laboratory data and clinical information remained in most cases. We could not find a novel biomarker in feature selection, but the ML model showed better performance, and significantly improved sensitivity, compared to the conventional NIMs. The ML model will contribute to conventional scoring system improvement and the discovery of new features.
Our study has some limitations. First, the number of patients included was small, so only the test set was performed, and an independent verification set was not performed by dividing the patient groups. As previously mentioned, this may have degraded the performance of some ML models. Furthermore, this study evaluated the diagnostic performance of ML models to predict liver fibrosis in individuals without chronic liver diseases from the Healthcare Screening Center. Thus, it is possible that the models were overfitted for these individuals, leading to reduced accuracy when applied to patients with liver disease. Despite these limitations, the serological biomarkers associated with liver fibrosis were still verifiable, and ML algorithms using these biomarkers exhibited superior performance to conventional NIMs in predicting liver fibrosis. Second, the ML methods used in this study have a black-box nature, complicating the understanding of the internal mechanism of analysis [46]. This can lead to unpredictable and obvious risks by leaving critical decisions to systems that are difficult to explain. However, this study used ML only as a means for verifying well-known biomarkers; hence it is partially exempt from black box-related limitations. Third, we used FibroScan as the reference method instead of liver biopsy. This study excluded patients with advanced or chronic liver disease; thus, liver biopsy was not required. Moreover, many studies have reported that liver stiffness measurements using TE can accurately predict liver fibrosis [47].
In conclusion, we used ML methods to verify the usefulness of well-known serological biomarkers and confirmed that M2BPGi, PLT, and AST were key biomarkers that predict liver fibrosis. Additionally, the ML models using these biomarkers performed better than the conventional NIMs, such as APRI, FIB-4, NFS, and M2BPGi.

Notes

Conflicts of Interest

None declared.

REFERENCES

1. Campana L, Esser H, Huch M, Forbes S. 2021; Liver regeneration and inflammation: from fundamental science to clinical applications. Nat Rev Mol Cell Biol. 22:608–24. DOI: 10.1038/s41580-021-00373-7. PMID: 34079104.
2. Rockey DC, Bell PD, Hill JA. 2015; Fibrosis - a common pathway to organ injury and failure. N Engl J Med. 372:1138–49. DOI: 10.1056/NEJMra1300575. PMID: 25785971.
3. Pellicoro A, Ramachandran P, Iredale JP, Fallowfield JA. 2014; Liver fibrosis and repair: immune regulation of wound healing in a solid organ. Nat Rev Immunol. 14:181–94. DOI: 10.1038/nri3623. PMID: 24566915.
4. Kim BK, Fun J, Yuen MF, Kim SU. 2013; Clinical application of liver stiffness measurement using transient elastography in chronic liver disease from longitudinal perspectives. World J Gastroenterol. 19:1890–900. DOI: 10.3748/wjg.v19.i12.1890. PMID: 23569334. PMCID: PMC3613104.
5. Khalifa A, Rockey DC. The utility of liver biopsy in 2020. Curr Opin Gastroenterol. 2020; 36:184–91. DOI: 10.1097/MOG.0000000000000621. PMID: 32097176.
6. Fallatah HI, Akbar HO, Fallatah AM. 2016; Fibroscan compared to FIB-4, APRI, and AST/ALT ratio for assessment of liver fibrosis in Saudi patients with nonalcoholic fatty liver disease. Hepat Mon. 16:e38346. DOI: 10.5812/hepatmon.38346. PMID: 27642348. PMCID: PMC5018361.
7. Amernia B, Moosavy SH, Banookh F, Zoghi G. 2021; FIB-4, APRI, and AST/ALT ratio compared to FibroScan for the assessment of hepatic fibrosis in patients with non-alcoholic fatty liver disease in Bandar Abbas, Iran. BMC Gastroenterol. 21:453. DOI: 10.1186/s12876-021-02038-3. PMID: 34861841. PMCID: PMC8642865.
8. Moon HW, Park M, Hur M, Kim H, Choe WH, Yun YM. 2018; Usefulness of enhanced liver fibrosis, glycosylation isomer of Mac-2 binding protein, galectin-3, and soluble suppression of tumorigenicity 2 for assessing liver fibrosis in chronic liver diseases. Ann Lab Med. 38:331–7. DOI: 10.3343/alm.2018.38.4.331. PMID: 29611383. PMCID: PMC5895862.
9. Shirabe K, Bekki Y, Gantumur D, Araki K, Ishii N, Kuno A, et al. 2018; Mac-2 binding protein glycan isomer (M2BPGi) is a new serum biomarker for assessing liver fibrosis: more than a biomarker of liver fibrosis. J Gastroenterol. 53:819–26. DOI: 10.1007/s00535-017-1425-z. PMID: 29318378.
10. Saleh SA, Salama MM, Alhusseini MM, Mohamed GA. 2020; M2BPGi for assessing liver fibrosis in patients with hepatitis C treated with direct-acting antivirals. World J Gastroenterol. 26:2864–76. DOI: 10.3748/wjg.v26.i21.2864. PMID: 32550761. PMCID: PMC7284180.
11. Mak LY, Wong DK, Cheung KS, Hui RW, Liu F, Fung J, et al. 2022; Role of serum M2BPGi levels in predicting persistence of advanced fibrosis in chronic hepatitis B virus infection. Dig Dis Sci. 67:5127–36. DOI: 10.1007/s10620-022-07429-4. PMID: 35258755.
12. Choi R, Oh Y, Lee S, Lee SG. 2019; Evaluation of the serum Mac-2 binding protein glycosylation isomer test used for diagnosis and monitoring of liver fibrosis and the correlation of Mac-2 binding protein glycosylation isomer with hemoglobin A1c. Clin Lab. 65:197. DOI: 10.7754/Clin.Lab.2018.180719.
13. Tsochatzis EA, Gurusamy KS, Ntaoula S, Cholongitas E, Davidson BR, Burroughs AK. 2011; Elastography for the diagnosis of severity of fibrosis in chronic liver disease: a meta-analysis of diagnostic accuracy. J Hepatol. 54:650–9. DOI: 10.1016/j.jhep.2010.07.033. PMID: 21146892.
14. Mikolasevic I, Orlic L, Franjic N, Hauser G, Stimac D, Milic S. 2016; Transient elastography (FibroScan®) with controlled attenuation parameter in the assessment of liver steatosis and fibrosis in patients with nonalcoholic fatty liver disease - Where do we stand? World J Gastroenterol. 22:7236–51. DOI: 10.3748/wjg.v22.i32.7236. PMID: 27621571. PMCID: PMC4997649.
15. Festi D, Schiumerini R, Marzi L, Di Biase AR, Mandolesi D, Montrone L, et al. 2013; Review article: the diagnosis of non-alcoholic fatty liver disease - availability and accuracy of non-invasive methods. Aliment Pharmacol Ther. 37:392–400. DOI: 10.1111/apt.12186. PMID: 23278163.
16. Oeda S, Tanaka K, Oshima A, Matsumoto Y, Sueoka E, Takahashi H. 2020; Diagnostic accuracy of FibroScan and factors affecting measurements. Diagnostics (Basel). 10:940. DOI: 10.3390/diagnostics10110940. PMID: 33198092. PMCID: PMC7696616.
17. Haq AU, Li JP, Saboor A, Khan J, Wali S, Ahmad S, et al. 2021; Detection of breast cancer through clinical data using supervised and unsupervised feature selection techniques. IEEE Access. 9:22090–105. DOI: 10.1109/ACCESS.2021.3055806.
18. Ahmad S, Khan S, Fahad M, Kumar Dutta A, Minh Dang L, Prasad Joshi G, et al. 2022; Deep learning enabled disease diagnosis for secure internet of medical things. Computers, Materials & Continua. 73:965–79. DOI: 10.32604/cmc.2022.025760.
19. Poonguzhali R, Ahmad S, Sivasankar PT, Babu SA, Joshi P, Joshi GP, et al. 2023; Automated brain tumor diagnosis using deep residual U-Net segmentation model. Computers, Materials & Continua. 74:2179–94. DOI: 10.32604/cmc.2023.032816.
20. Decharatanachart P, Chaiteerakij R, Tiyarattanachai T, Treeprasertsuk S. 2021; Application of artificial intelligence in chronic liver diseases: a systematic review and meta-analysis. BMC Gastroenterol. 21:10. DOI: 10.1186/s12876-020-01585-5. PMID: 33407169. PMCID: PMC7788739.
21. Spann A, Yasodhara A, Kang J, Watt K, Wang B, Goldenberg A, et al. 2020; Applying machine learning in liver disease and transplantation: a comprehensive review. Hepatology. 71:1093–105. DOI: 10.1002/hep.31103. PMID: 31907954.
22. Deo RC. 2015; Machine learning in medicine. Circulation. 132:1920–30. DOI: 10.1161/CIRCULATIONAHA.115.001593. PMID: 26572668. PMCID: PMC5831252.
23. Feng G, Zhang X, Zhang L, Liu WY, Geng S, Yuan HY, et al. Novel urinary protein panels for the non-invasive diagnosis of non-alcoholic fatty liver disease and fibrosis stages. Liver Int. 2023; 43:1234–6. DOI: 10.1111/liv.15565. PMID: 36924436.
24. Alkhouri N. 2017; Putting it all together: noninvasive diagnosis of fibrosis in nonalcoholic fatty liver disease in adults and children. Clin Liver Dis (Hoboken). 9:134–7. DOI: 10.1002/cld.636. PMID: 30992977. PMCID: PMC6467159.
25. Wei B, Feng S, Chen E, Li D, Wang T, Gou Y, et al. 2018; M2BPGi as a potential diagnostic tool of cirrhosis in Chinese patients with hepatitis B virus infection. J Clin Lab Anal. 32:e22261. DOI: 10.1002/jcla.22261. PMID: 28544156. PMCID: PMC6817288.
26. Jekarl DW, Choi H, Lee S, Kwon JH, Lee SW, Yu H, et al. 2018; Diagnosis of liver fibrosis with Wisteria floribunda agglutinin-positive Mac-2 binding protein (WFA-M2BP) among chronic hepatitis B patients. Ann Lab Med. 38:348–54. DOI: 10.3343/alm.2018.38.4.348. PMID: 29611385. PMCID: PMC5895864.
27. Cross TJ, Calvaruso V, Maimone S, Carey I, Chang TP, Pleguezuelo M, et al. 2010; Prospective comparison of Fibroscan, King's score and liver biopsy for the assessment of cirrhosis in chronic hepatitis C infection. J Viral Hepat. 17:546–54. DOI: 10.1111/j.1365-2893.2009.01210.x. PMID: 19874477.
28. Wong VW, Vergniol J, Wong GL, Foucher J, Chan HL, Le Bail B, et al. 2010; Diagnosis of fibrosis and cirrhosis using liver stiffness measurement in nonalcoholic fatty liver disease. Hepatology. 51:454–62. DOI: 10.1002/hep.23312. PMID: 20101745.
29. Breiman L, Friedman JH, editors. Classification and regression trees-[eBook]. New York: Routledge;2017.
30. Altmann A, Tolosi L, Sander O, Lengauer T. 2010; Permutation importance: a corrected feature importance measure. Bioinformatics. 26:1340–7. DOI: 10.1093/bioinformatics/btq134. PMID: 20385727.
31. Breiman L. 2001; Random forests. Mach Learn. 45:5–32. DOI: 10.1023/A:1010933404324.
32. Burger CJ. A tutorial on support vector machines for pattern recognition. Data mining and knowledge discovery. 1998; 2:121–67. DOI: 10.1023/A:1009715923555.
33. Hunter JD. 2007; Matplotlib: a 2D graphics environment. Computing in science & engineering. 9:90–5. DOI: 10.1109/MCSE.2007.55.
34. Pedregosa F, Varoquaux G, Gramfort A, Michel V, Thirion B, Grisel O, et al. 2011; Scikit-learn: Machine learning in Python. J Mach Learn Res. 12:2825–30.
35. Nishikawa H, Enomoto H, Iwata Y, Hasegawa K, Nakano C, Takata R, et al. 2016; Impact of serum Wisteria floribunda agglutinin positive Mac-2-binding protein and serum interferon-gamma-inducible protein-10 in primary biliary cirrhosis. Hepatol Res. 46:575–83. DOI: 10.1111/hepr.12595. PMID: 26418076.
36. Umemura T, Joshita S, Sekiguchi T, Usami Y, Shibata S, Kimura T, et al. 2015; Serum Wisteria floribunda agglutinin-positive Mac-2-binding protein level predicts liver fibrosis and prognosis in primary biliary cirrhosis. Am J Gastroenterol. 110:857–64. DOI: 10.1038/ajg.2015.118. PMID: 25916223.
37. Yamada N, Sanada Y, Tashiro M, Hirata Y, Okada N, Ihara Y, et al. 2017; Serum Mac-2 binding protein glycosylation isomer predicts grade F4 liver fibrosis in patients with biliary atresia. J Gastroenterol. 52:245–52. DOI: 10.1007/s00535-016-1235-8. PMID: 27349650.
38. Nishikawa H, Enomoto H, Iwata Y, Hasegawa K, Nakano C, Takata R, et al. 2016; Clinical significance of serum Wisteria floribunda agglutinin positive Mac-2-binding protein level and high-sensitivity C-reactive protein concentration in autoimmune hepatitis. Hepatol Res. 46:613–21. DOI: 10.1111/hepr.12596. PMID: 26406984.
39. Abe M, Miyake T, Kuno A, Imai Y, Sawai Y, Hino K, et al. 2015; Association between Wisteria floribunda agglutinin-positive Mac-2 binding protein and the fibrosis stage of non-alcoholic fatty liver disease. J Gastroenterol. 50:776–84. DOI: 10.1007/s00535-014-1007-2. PMID: 25326152.
40. Mizuno M, Shima T, Oya H, Mitsumoto Y, Mizuno C, Isoda S, et al. 2017; Classification of patients with non-alcoholic fatty liver disease using rapid immunoassay of serum type IV collagen compared with liver histology and other fibrosis markers. Hepatol Res. 47:216–25. DOI: 10.1111/hepr.12710. PMID: 26997642.
41. Nishikawa H, Enomoto H, Iwata Y, Kishino K, Shimono Y, Hasegawa K, et al. 2016; Clinical significance of serum Wisteria floribunda agglutinin positive Mac-2-binding protein level in non-alcoholic steatohepatitis. Hepatol Res. 46:1194–202. DOI: 10.1111/hepr.12662. PMID: 26836229.
42. Shigefuku R, Takahashi H, Nakano H, Watanabe T, Matsunaga K, Matsumoto N, et al. 2016; Correlations of hepatic hemodynamics, liver function, and fibrosis markers in nonalcoholic fatty liver disease: Comparison with chronic hepatitis related to hepatitis C virus. Int J Mol Sci. 17:1545. DOI: 10.3390/ijms17091545. PMID: 27649152. PMCID: PMC5037819.
43. Fujiyoshi M, Kuno A, Gotoh M, Fukai M, Yokoo H, Kamachi H, et al. 2015; Clinicopathological characteristics and diagnostic performance of Wisteria floribunda agglutinin positive Mac-2-binding protein as a preoperative serum marker of liver fibrosis in hepatocellular carcinoma. J Gastroenterol. 50:1134–44. DOI: 10.1007/s00535-015-1063-2. PMID: 25773774.
44. Toshima T, Shirabe K, Ikegami T, Yoshizumi T, Kuno A, Togayachi A, et al. 2015; A novel serum marker, glycosylated Wisteria floribunda agglutinin-positive Mac-2 binding protein (WFA(+)-M2BP), for assessing liver fibrosis. J Gastroenterol. 50:76–84. DOI: 10.1007/s00535-014-0946-y. PMID: 24603981.
45. Vapnik VN. 1999; An overview of statistical learning theory. IEEE Trans Neural Netw. 10:988–99. DOI: 10.1109/72.788640. PMID: 18252602.
46. LeCun Y, Bengio Y, Hinton G. 2015; Deep learning. Nature. 521:436–44.
47. Singh S, Fujii LL, Murad MH, Wang Z, Asrani SK, Ehman RL, et al. Liver stiffness is associated with risk of decompensation, liver cancer, and death in patients with chronic liver diseases: a systematic review and meta-analysis. Clin Gastroenterol Hepatol. 2013; 11:1573–84.
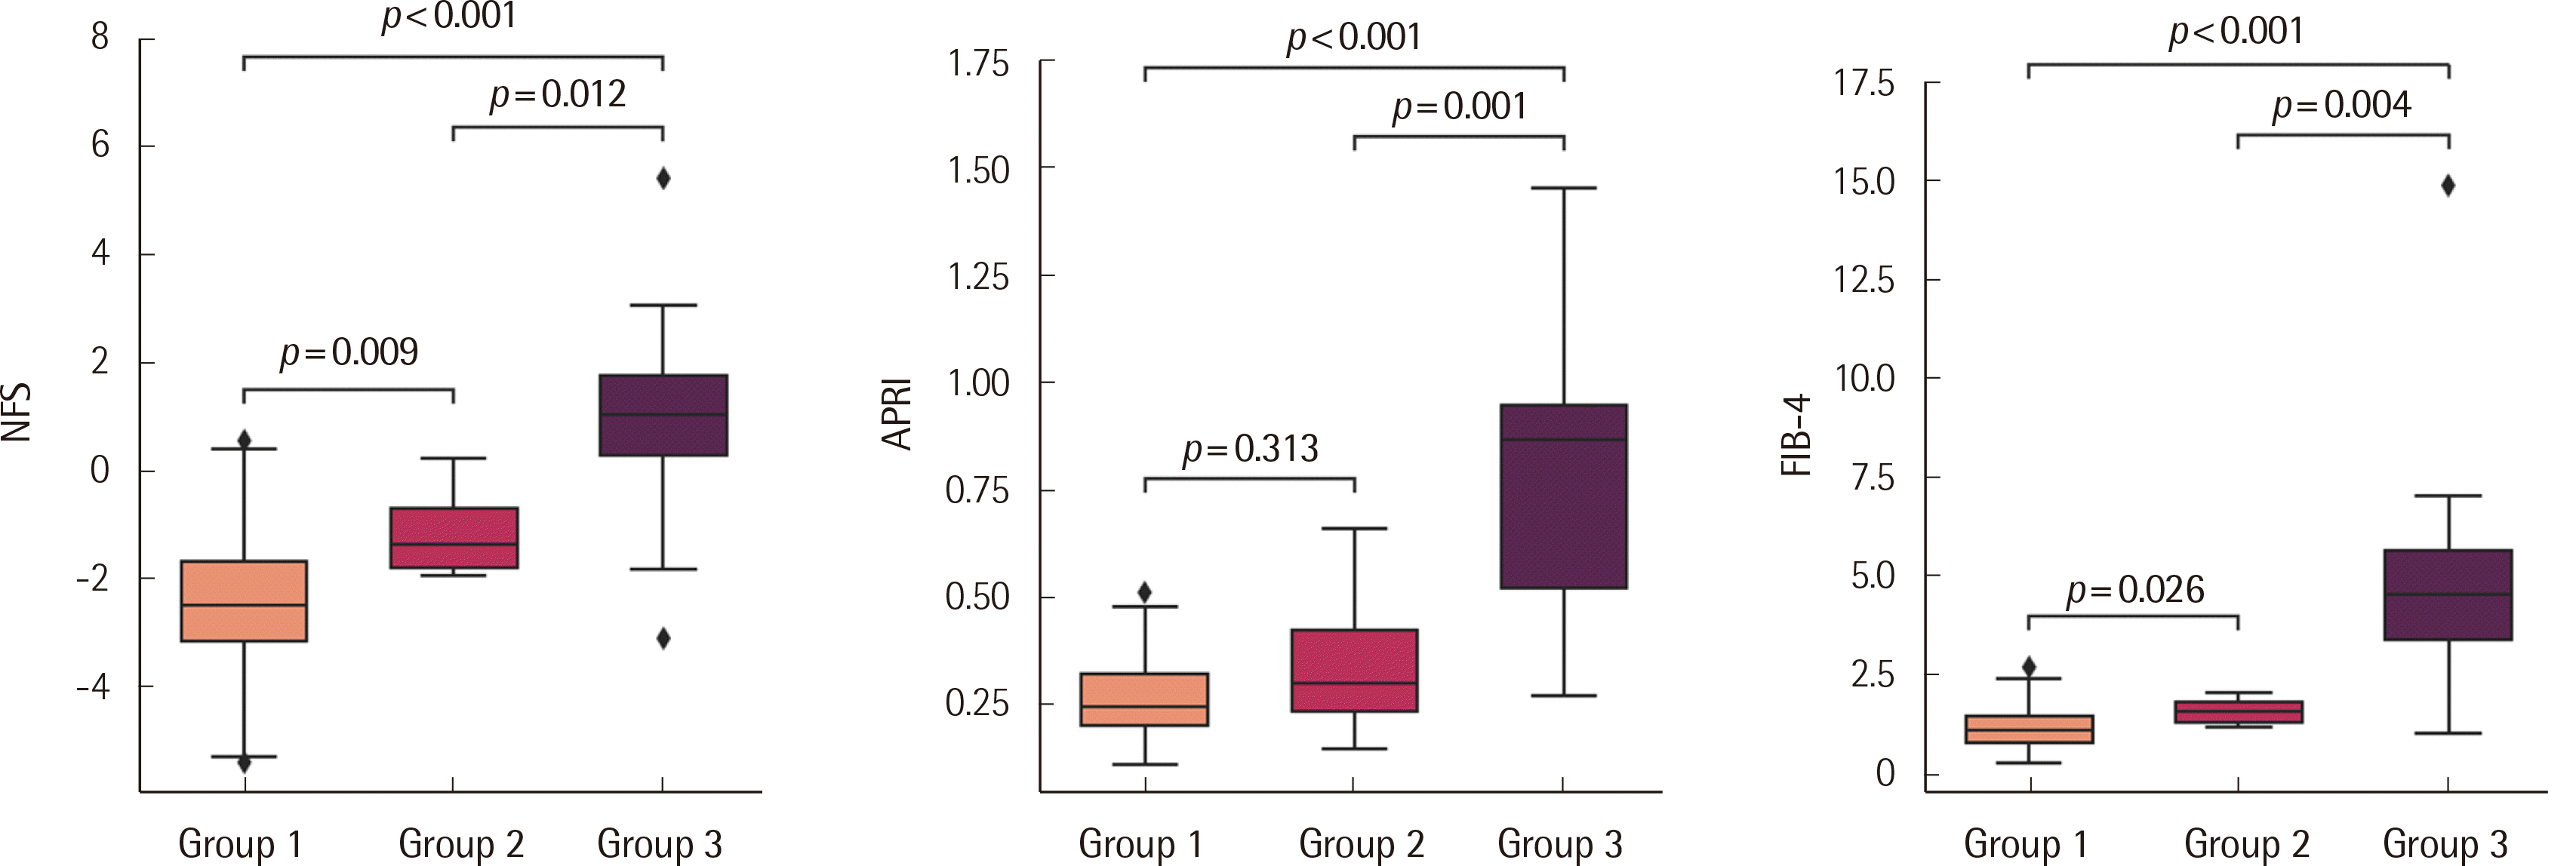
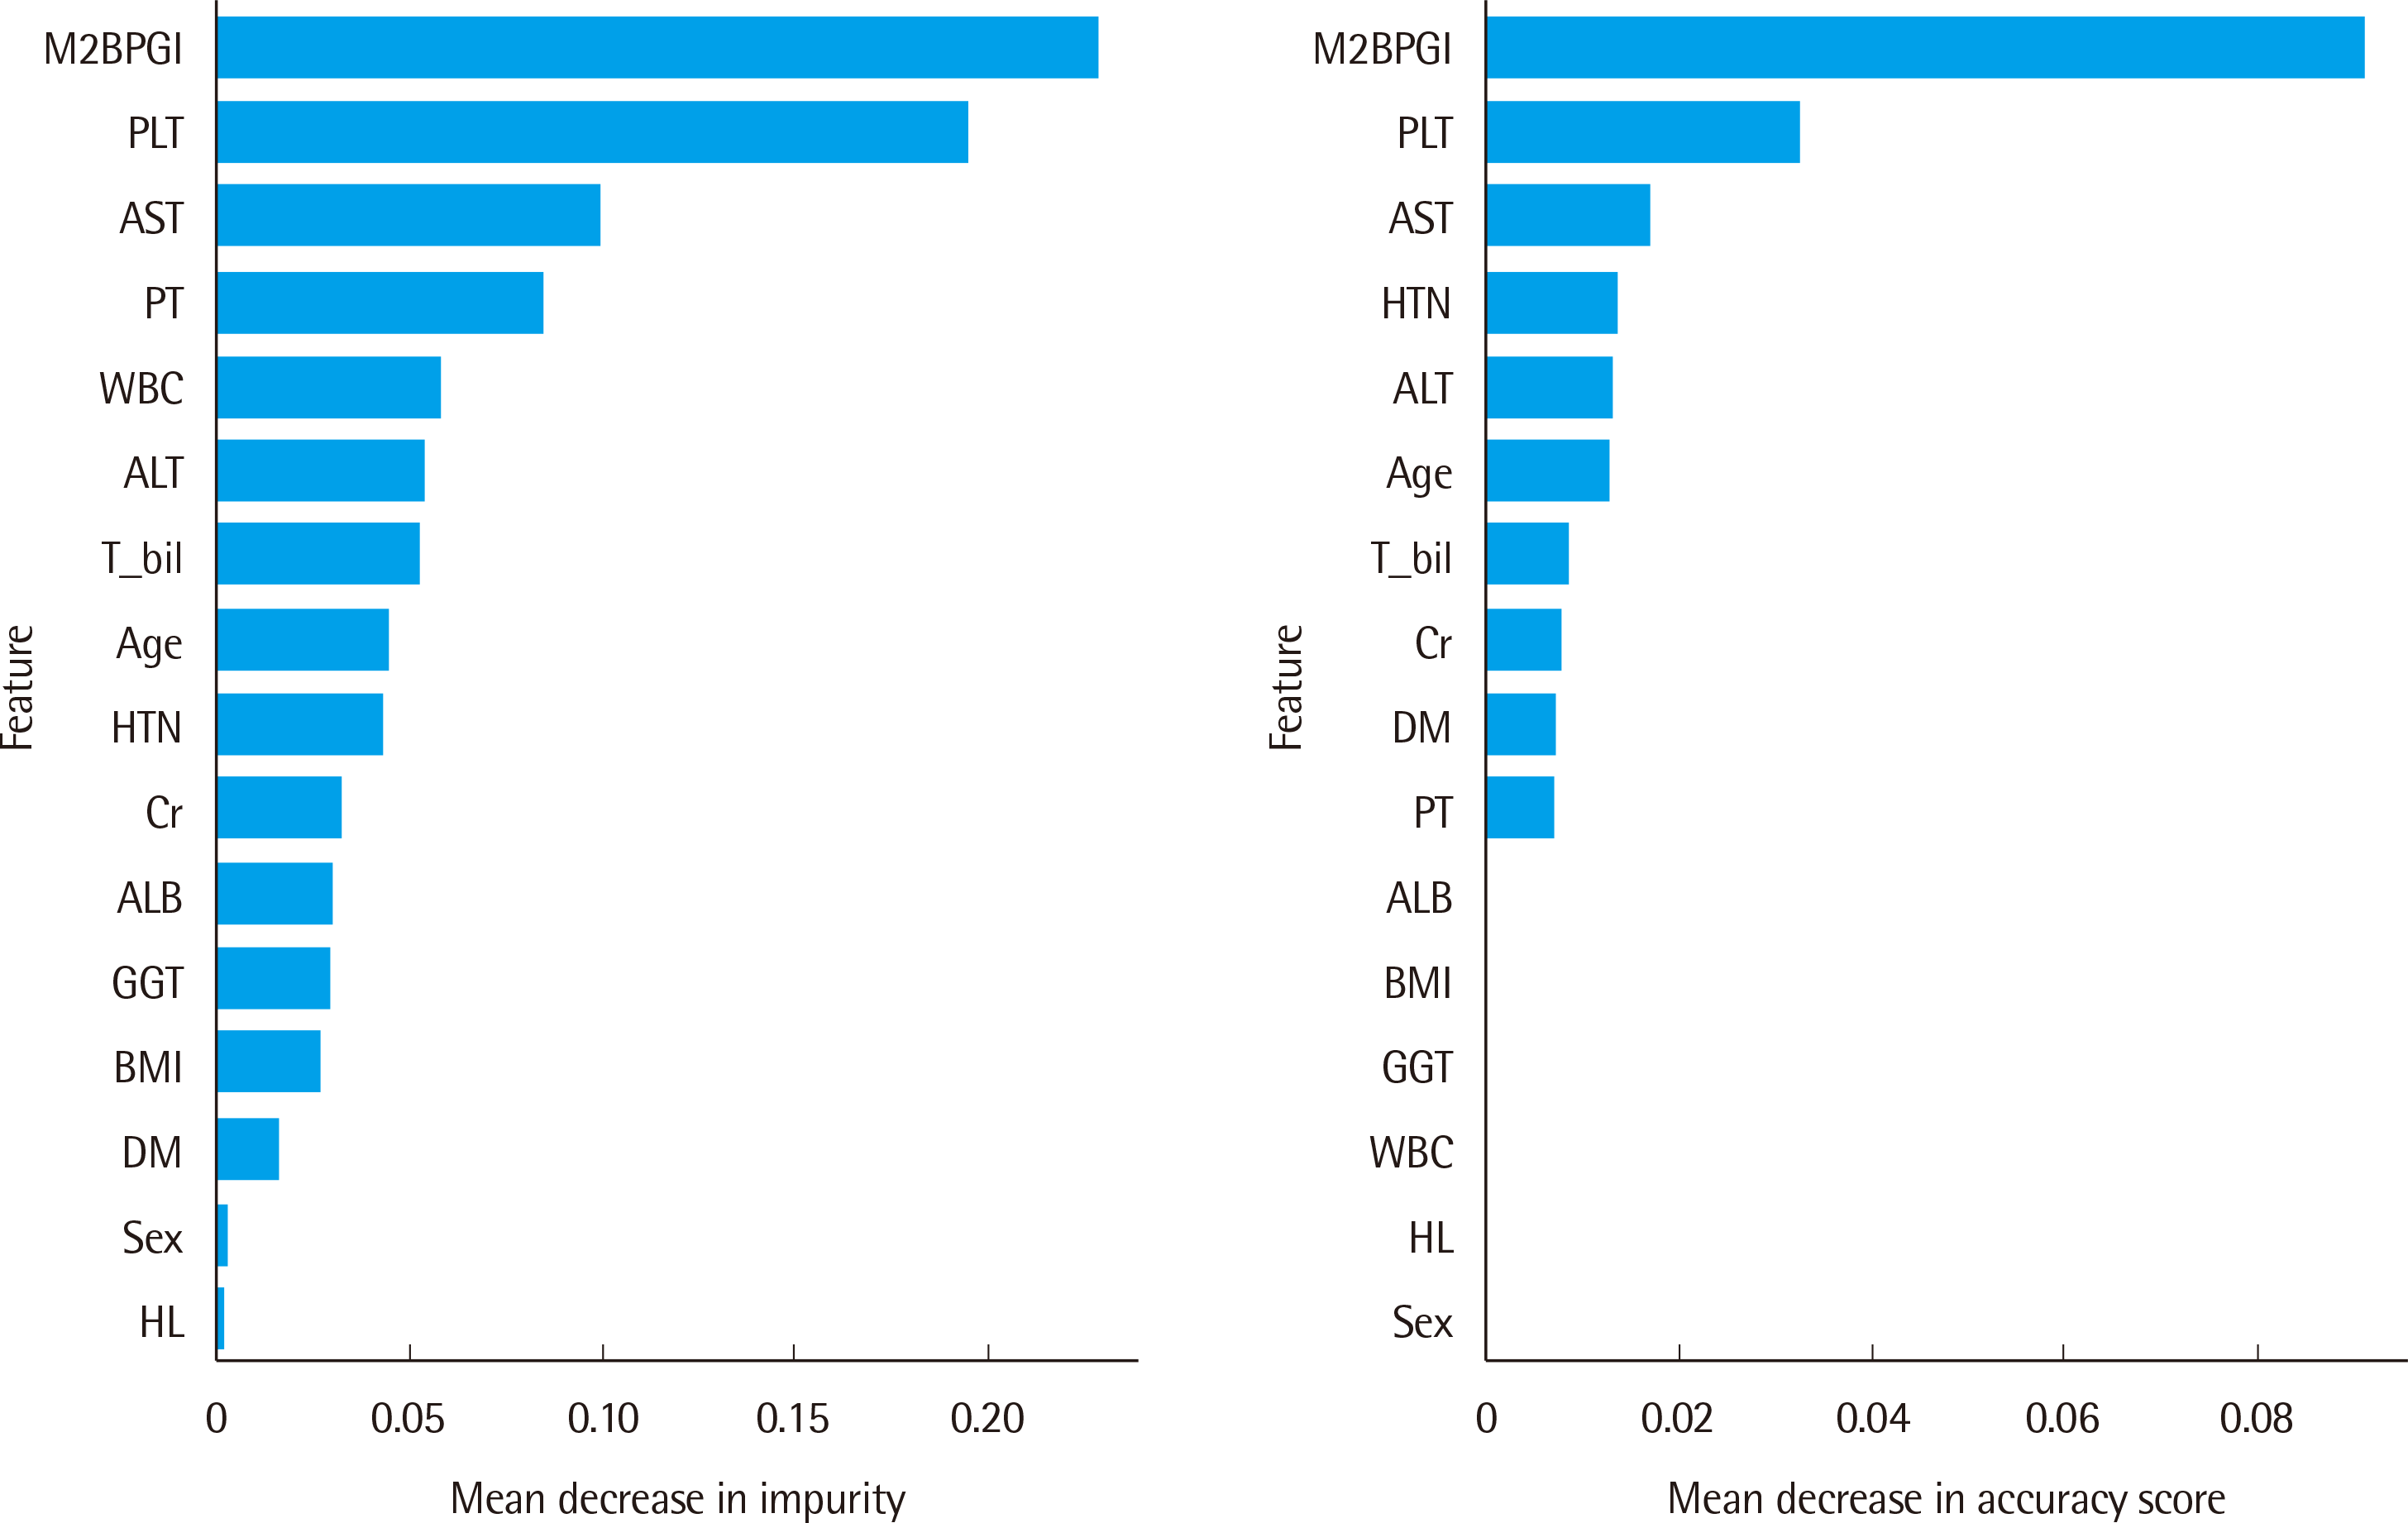
Fig. 1
Noninvasive fibrosis score distribution according to groups by FibroScan. Boxes designate the interquartile range (25–75 percentile), and the middle line represents the median. The error bar represents minimum and maximum values. Group 1 shows no or minimal fibrosis (<7 kPa), group 2 shows moderate fibrosis (7–10 kPa), and group 3 shows severe fibrosis (≥10 kPa). NFS: nonalcoholic fatty liver disease fibrosis score; APRI: AST (Aspartate transaminase)–platelet ratio index; FIB-4: fibrosis 4.
lmo-13-3-189-f1.tif
Fig. 2
Feature selection for differentiating between the three groups. The mean decrease in impurity (left panel) and permutation importance (right panel) were calculated to assess the importance of features.
Abbreviations: M2BPGi, Mac-2 binding protein glycosylation isomer; PLT, platelet count; AST, aspartate transaminase; PT, prothrombin time; WBC, whole blood cells; T_bil, total bilirubin; HTN, hypertension; Cr, creatinine; ALB, albumin; GGT, gamma-glutamyl transferase; BMI, body mass index; DM, diabetes mellitus; HL, hyperlipidemia.
lmo-13-3-189-f2.tif
Fig. 3
Five-fold cross-validation composite receiver operating characteristic (ROC) curves for predicting (A) moderate (≥7 kPa) and (B) severe fibrosis (≥10 kPa). Five-fold cross-validation separate ROC curves for predicting (C) moderate (≥7 kPa) and (D) severe fibrosis (≥10 kPa). The random forest and support vector machine are shown in the left and right panels, respectively.
Abbreviation: AUC, area under the curve.
lmo-13-3-189-f3.tif
Table 1
Clinical and laboratory characteristics comparing no or minimal (group 1), moderate (group 2), and severe fibrosis (group 3)
Variable Total Group 1 Group 2 Group 3 p-value
N 144 115 6 23
Age (yr) 55± 14 53± 12 66± 7 65± 15 < 0.001
Male (%) 57.6 58.3 50.0 56.5 0.826
BMI (kg/m2) 24.5 ± 2.7 24.2 ± 2.5 25.4 ± 2.0 25.6 ± 3.1 0.053
Medical histories
Hypertension (%) 22.9 13.0 50.0 65.2 < 0.001
Diabetes mellitus (%) 20.8 15.7 50.0 39.1 0.005
Hyperlipidemia (%) 36.8 41.7 16.7 17.4 0.019
Laboratory findings
AST (U/L) 25 (21–32) 23 (20–28) 29 (21–37) 37 (33–45) < 0.001
ALT (U/L) 22 (17–33) 22 (17–33) 30 (13–62) 22 (16–31) 0.691
GGT (U/L) 40 (21–79) 35 (20–69) 43 (18–75) 59 (41–132) 0.019
Total bilirubin (mg/dL) 0.80 (0.58–1.05) 0.75 (0.57–1.02) 0.99 (0.65–1.33) 0.94 (0.72–1.38) 0.035
Albumin (g/dL) 4.6 (4.4–4.9) 4.7 (4.5–4.9) 4.5 (4.4–4.7) 4.2 (3.7–4.5) < 0.001
Creatinine (mg/dL) 0.80 (0.68–0.95) 0.80 (0.66–0.95) 0.83 (0.61–1.00) 0.81 (0.70–0.93) 0.785
WBC (×109/L) 5.72 ± 1.40 5.91± 1.34 6.25 ± 1.15 4.66 ± 1.30 < 0.001
Platelet (×109/L) 227± 66 243± 54 232± 47 141± 61 < 0.001
PT, INR 1.08 (1.03–1.15) 1.06 (1.03–1.12) 1.10 (1.04–1.17) 1.15 (1.07–1.26) < 0.001
M2BPGi, COI 0.65 (0.47–0.88) 0.58 (0.43–0.76) 0.89 (0.66–1.04) 2.34 (1.31–3.39) < 0.001
Noninvasive scores
NFS -1.864± 1.806 -2.462± 1.206 -1.134± 0.857 0.934 ± 1.818 < 0.001
APRI 0.274 (0.211–0.364) 0.246 (0.201–0.327) 0.299 (0.204–0.508) 0.869 (0.495–0.962) < 0.001
FIB-4 1.254 (0.903–1.782) 1.114 (0.787–1.495) 1.591 (1.239–1.922) 4.556 (3.300–5.698) < 0.001
TE (kPa) 4.5 (3.6–6.5) 4.2 (3.4–4.8) 8.2 (7.7–9.6) 19.4 (14.2–37.0) < 0.001

Continuous variables are presented as mean±standard deviation, and non-normally distributed variables are presented as median with interquartile range.

Abbreviations: BMI, body mass index; AST, aspartate transaminase; ALT, alanine aminotransferase; GGT, gamma-glutamyl transferase; WBC, whole blood cells; PT, prothrombin time; M2BPGi, Mac-2 binding protein glycosylation isomer; COI, cutoff index; NFS, nonalcoholic fatty liver disease fibrosis score; APRI, AST-platelet ratio index; FIB-4, fibrosis 4; TE, transient elastography.

Table 2
The performance of the models, including area under the receiver operating characteristics curve (AUROC), sensitivity, and specificity for diagnosing moderate (≥7 kPa) or severe fibrosis (≥10 kPa)
Features ML Diagnostic criteria for fibrosis (kPa) AUROC (95% CI) Accuracy (%) Sensitivity (%) Specificity (%)
M2BPGi+PLT+AST RF ≥ 7 0.906 (0.836–0.976) 93.1 83.3 100
≥ 10 0.995 (0.995–0.995) 99.3 100 100
SVM ≥ 7 0.952 (0.909–0.995) 93.1 90.0 97.4
≥ 10 0.993 (0.990–0.997) 97.2 100 99.2
APRI ≥ 7 0.891 (0.809–0.973) 91.0 72.4 95.7
≥ 10 0.958 (0.917–1.000) 94.4 82.6 96.7
FIB-4 ≥ 7 0.910 (0.848–0.972) 88.9 75.9 93.0
≥ 10 0.943 (0.882–1.000) 91.0 87.0 92.6
NFS ≥ 7 0.913 (0.850–0.975) 91.0 72.4 95.7
≥ 10 0.933 (0.864–1.000) 92.4 82.6 94.2
M2BPGi ≥ 7 0.922 (0.860–0.985) 92.4 75.9 96.5
≥ 10 0.955 (0.903–1.000) 95.8 87.0 97.5

Abbreviations: ML, machine learning algorithm; CI, confidence interval; PLT, platelet counts; AST, aspartate transaminase; RF, random forest; SVM, support vector machine; APRI, AST–platelet ratio index; FIB-4, fibrosis 4; NFS, nonalcoholic fatty liver disease fibrosis score; M2BPGi, Mac-2 binding protein glycosylation isomer.

TOOLS
Similar articles