Introduction
Materials and Methods
1. Study design and study population
2. Procedures
3. Statistical analysis
Results
1. Patient characteristics
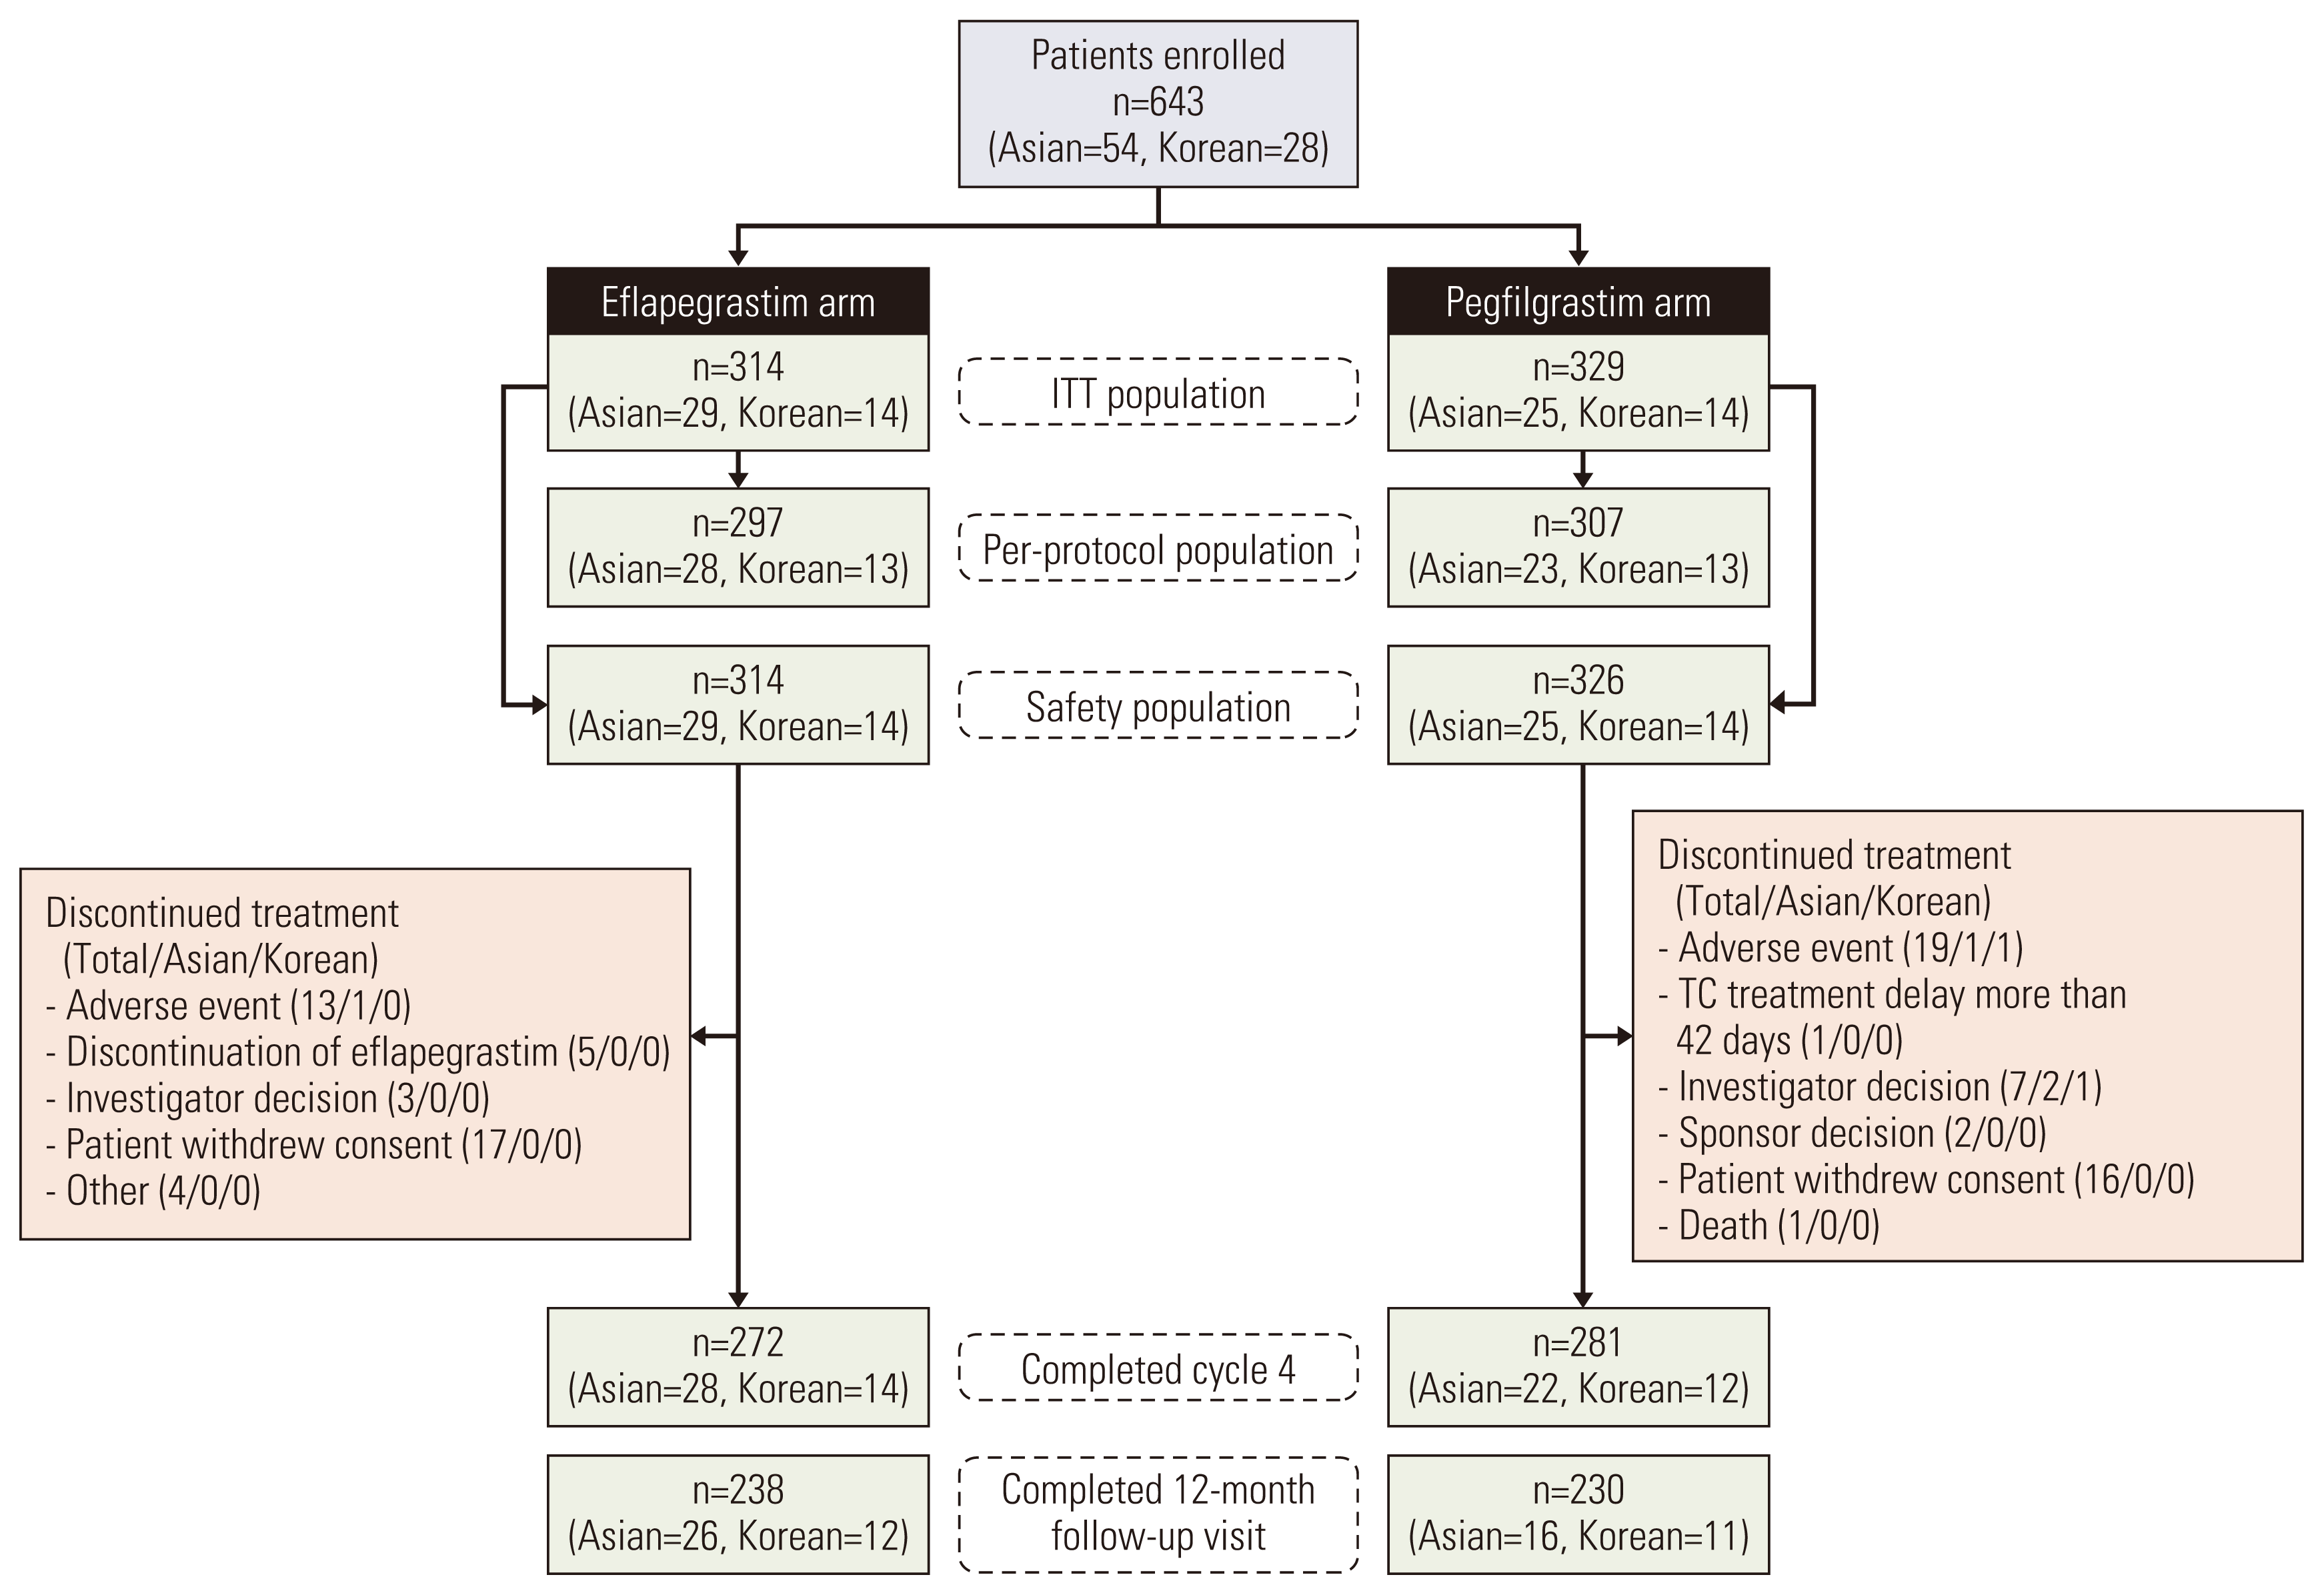
Fig. 2

Table 1
2. Efficacies
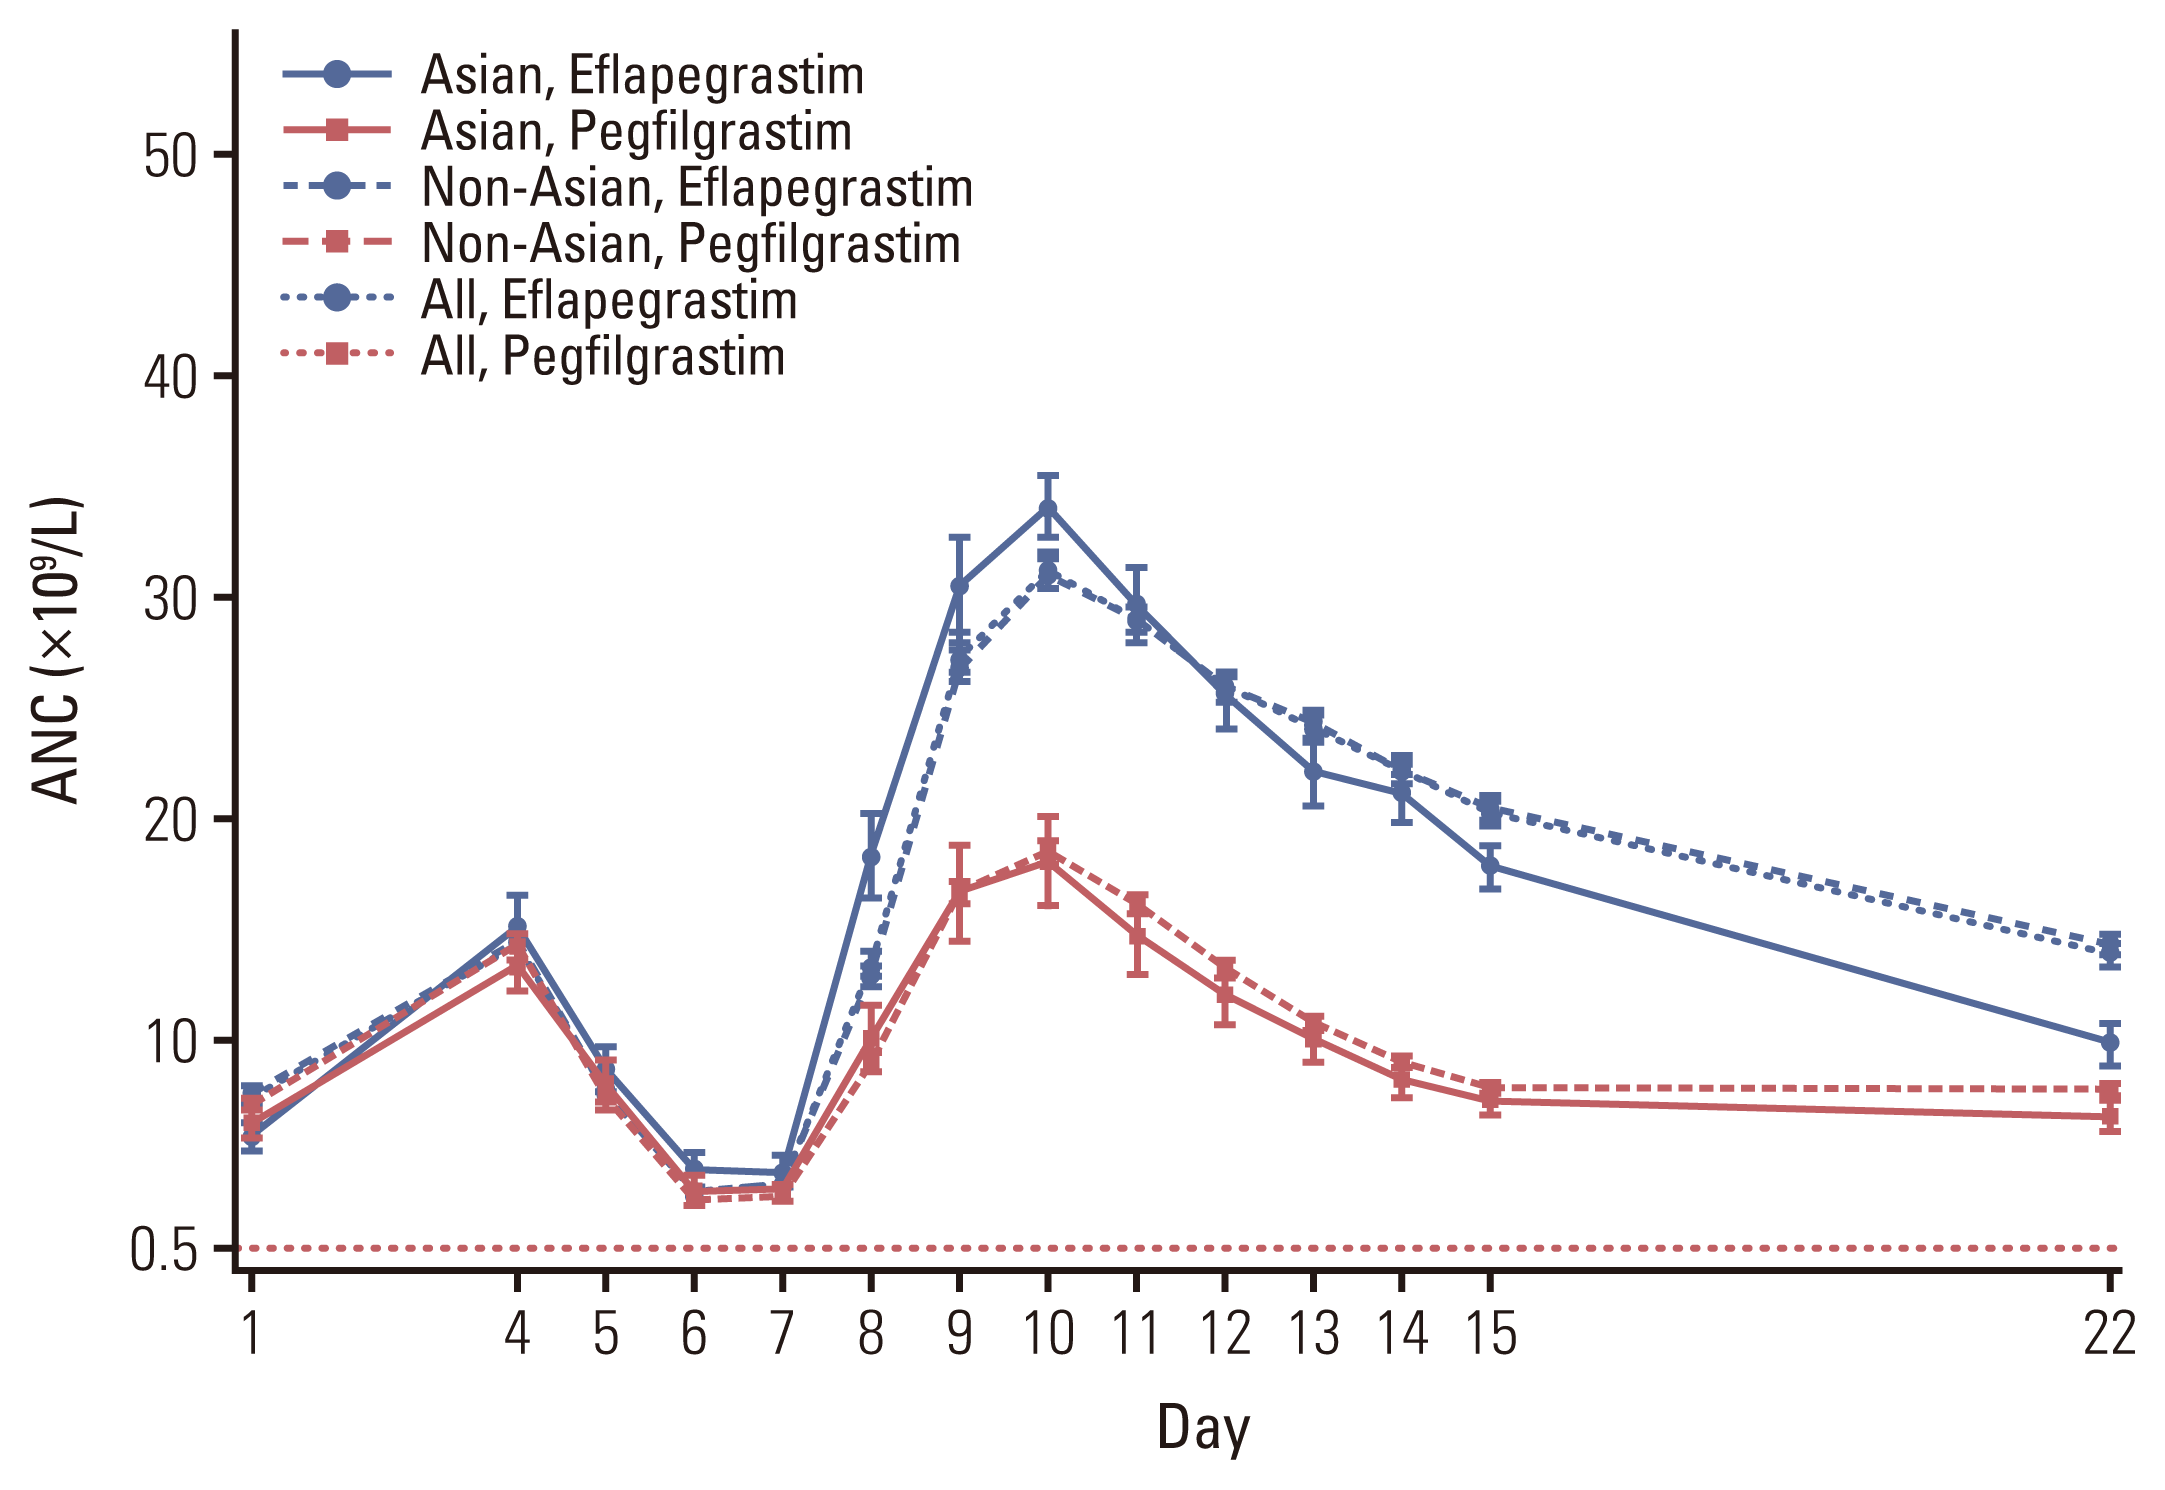
Fig. 3

Table 2
| ITT population | Korean | Asian | Non-Asian | All | ||||
|---|---|---|---|---|---|---|---|---|
|
|
|
|
|
|||||
| Eflapegrastim (n=14) | Pegfilgrastim (n=14) | Eflapegrastim (n=29) | Pegfilgrastim (n=25) | Eflapegrastim (n=285) | Pegfilgrastim (n=304) | Eflapegrastim (n=314) | Pegfilgrastim (n=329) | |
| DSN (day), n (%) | ||||||||
|
|
||||||||
| 0 | 12 (85.7) | 8 (57.1) | 26 (89.7) | 18 (72.0) | 233 (81.8) | 232 (76.3) | 259 (82.5) | 250 (76.0) |
|
|
||||||||
| 1 | 1 (7.1) | 5 (35.7) | 1 (3.4) | 5 (20.0) | 36 (12.6) | 47 (15.5) | 37 (11.8) | 52 (15.8) |
|
|
||||||||
| 2 | 1 (7.1) | 1 (7.1) | 2 (6.9) | 1 (4.0) | 13 (4.6) | 18 (5.9) | 15 (4.8) | 19 (5.8) |
|
|
||||||||
| 3 | 0 | 0 | 0 | 0 | 3 (1.1) | 6 (2.0) | 3 (1.0) | 6 (1.8) |
|
|
||||||||
| 4 | 0 | 0 | 0 | 1 (4.0) | 0 | 0 | 0 | 1 (0.3) |
|
|
||||||||
| 7 | 0 | 0 | 0 | 0 | 0 | 1 (0.3) | 0 | 1 (0.3) |
|
|
||||||||
| Mean±SD | 0.21±0.58 | 0.50±0.65 | 0.17±0.54 | 0.44±0.92 | 0.25±0.59 | 0.36±0.78 | 0.24±0.58 | 0.36±0.79 |
|
|
||||||||
| Median (range) | 0 (0 to 2) | 0 (0 to 2) | 0 (0 to 2) | 0 (0 to 4) | 0 (0 to 3) | 0 (0 to 7) | 0 (0 to 3) | 0 (0 to 7) |
|
|
||||||||
| Difference between groups (day)a) | −0.288 | −0.267 | −0.107 | −0.120 | ||||
|
|
||||||||
| 95% Confidence interval | −0.714 to 0.143 | −0.697 to 0.110 | −0.222 to 0.002 | −0.227 to −0.016 | ||||
Table 3
| ITT population | Korean | Asian | Non-Asian | All | ||||
|---|---|---|---|---|---|---|---|---|
|
|
|
|
|
|||||
| Eflapegrastim (n=14) | Pegfilgrastim (n=14) | Eflapegrastim (n=29) | Pegfilgrastim (n=25) | Eflapegrastim (n=285) | Pegfilgrastim (n=304) | Eflapegrastim (n=314) | Pegfilgrastim (n=329) | |
| Time to ANC recoverya) (day) in cycle 1 | ||||||||
|
|
||||||||
| Mean±SD | 3.43±4.22 | 4.14±3.74 | 3.10±3.84 | 3.08±4.03 | 3.36±3.60 | 3.47±3.61 | 3.33±3.62 | 3.44±3.64 |
|
|
||||||||
| Median (range)b) | 0 (0 to 11) | 7 (0 to 8) | 0 (0 to 11) | 0 (0 to 13) | 0 (0 to 14) | 0 (0 to 14) | 0 (0 to 14) | 0 (0 to 14) |
|
|
||||||||
| Difference between groupsc) | −0.714 | 0.023 | −0.109 | −0.103 | ||||
|
|
||||||||
| 95% CI | −5.627 to 4.198 | −3.536 to 3.583 | −1.101 to 0.882 | −1.059 to 0.852 | ||||
|
|
||||||||
| Depth of ANC nadir (×109/L) in cycle 1 | ||||||||
|
|
||||||||
| Mean±SD | 1.72±1.14 | 1.57±1.53 | 2.76±3.20 | 2.40±2.22 | 2.59±3.25 | 2.35±2.97 | 2.60±3.24 | 2.36±2.91 |
|
|
||||||||
| Median (range) | 1.67 (0.08 to 4.12) | 1.40 (0.11 to 5.40) | 1.74 (0.08 to 15.28) | 1.95 (0.11 to 9.24) | 1.55 (0.04 to 23.92) | 1.37 (0.01 to 22.31) | 1.58 (0.04 to 23.92) | 1.42 (0.01 to 22.31) |
|
|
||||||||
| Ratio over pegfilgrastim | 1.313 | 1.168 | 1.182 | 1.184 | ||||
|
|
||||||||
| 95% CI | 0.531 to 3.246 | 0.609 to 2.239 | 0.962 to 1.453 | 0.973 to 1.441 | ||||
|
|
||||||||
| p-value | 0.541 | 0.635 | 0.112 | 0.091 | ||||
|
|
||||||||
| Incidence of febrile neutropenia in cycle 1 | ||||||||
|
|
||||||||
| Incidence, n (%) | 0 | 1 (7.1) | 0 | 2 (8.0) | 5 (1.8) | 4 (1.3) | 5 (1.6) | 6 (1.8) |
|
|
||||||||
| Difference between groups (%)c) | −7.1 | −8.0 | 0.4 | −0.2 | ||||
|
|
||||||||
| 95% CI (%) | −45.0 to 32.3 | −34.0 to 18.6 | −7.6 to 8.5 | −8.0 to 7.5 | ||||
|
|
||||||||
| p-value | > 0.99 | 0.210 | 0.745 | > 0.99 | ||||
ANC, absolute neutrophil count; CI, confidence interval; ITT, intent-to-treat; SD, standard deviation.
a) Time to ANC recovery in cycle 1, defined as the time from chemotherapy administration until the patient’s ANC increases to ≥ 1.5×10⁹/L after the expected nadir. For patients with ANC value ≥ 1.5×10⁹/L at all times, Time to ANC recovery will be assigned to a value of 0,
b) Time to ANC recovery was 0 day in 6 patients, 7 days in 6 patients and 8 days in 2 patients for pegfilgrastim arm, whereas, it was 0 day in more than half (8 out of 14) of eflapegrastim treated Korean patients during the cycle 1. Thus it was calculated that the median time to ANC recovery was 7 days for pegfilgrastim arm versus 0 day for eflapegrastim in Korean patients during the cycle 1,
3. Adverse events
Table 4
Table 5
| Adverse event | Korean | Asian | Non-Asian | |||||||||
|---|---|---|---|---|---|---|---|---|---|---|---|---|
|
|
|
|
||||||||||
| Eflapegrastim (n=14) | Pegfilgrastim (n=14) | Eflapegrastim (n=29) | Pegfilgrastim (n=25) | Eflapegrastim (n=285) | Pegfilgrastim (n=301) | |||||||
|
|
|
|
|
|
|
|||||||
| Any grade | ≥ Grade 3 | Any grade | ≥ Grade 3 | Any grade | ≥ Grade 3 | Any grade | ≥ Grade 3 | Any grade | ≥ Grade 3 | Any grade | ≥ Grade 3 | |
| Musculoskeletal pain | ||||||||||||
|
|
||||||||||||
| Bone pain | 1 (7.1) | 0 | 0 | 0 | 6 (20.7) | 0 | 2 (8.0) | 0 | 97 (34.0) | 11 (3.9) | 110 (36.5) | 2 (0.7) |
|
|
||||||||||||
| Arthralgia | 0 | 0 | 0 | 0 | 2 (6.9) | 1 (3.4) | 0 | 0 | 45 (15.8) | 4 (1.4) | 33 (11.0) | 2 (0.7) |
|
|
||||||||||||
| Back pain | 0 | 0 | 1 (7.1) | 0 | 2 (6.9) | 1 (3.4) | 4 (16.0) | 0 | 41 (14.4) | 5 (1.8) | 25 (8.3) | 1 (0.3) |
|
|
||||||||||||
| Myalgia | 8 (57.1) | 0 | 7 (50.0) | 0 | 11 (37.9) | 1 (3.4) | 9 (36.0) | 0 | 36 (12.6) | 1 (0.4) | 21 (7.0) | 0 |
|
|
||||||||||||
| Subtotal | 9 (64.3) | 0 | 8 (57.1) | 0 | 21(72.4) | 3 (10.3) | 15 (60.0) | 0 | 219 (76.8) | 21 (7.4) | 189 (62.8) | 5 (1.7) |
|
|
||||||||||||
| Others | ||||||||||||
|
|
||||||||||||
| White blood cell count increaseda) | 0 | 0 | 0 | 0 | 0 | 0 | 0 | 0 | 34 (11.9) | 5 (1.8) | 18 (6.0) | 1 (0.3) |
|
|
||||||||||||
| Headache | 1 (7.1) | 0 | 1 (7.1) | 0 | 3 (10.3) | 0 | 4 (16.0) | 0 | 28 (9.8) | 1 (0.4) | 21 (7.0) | 2 (0.7) |
|
|
||||||||||||
| Fatigue | 0 | 0 | 0 | 0 | 1 (3.4) | 0 | 2 (8.0) | 0 | 23 (8.1) | 2 (0.7) | 30 (10.0) | 1 (0.3) |
|
|
||||||||||||
| Pain | 0 | 0 | 0 | 0 | 2 (6.9) | 0 | 2 (8.0) | 0 | 22 (7.7) | 1 (0.4) | 26 (8.6) | 3 (1.0) |
|
|
||||||||||||
| Nausea | 2 (14.3) | 0 | 1 (7.1) | 0 | 3 (10.3) | 0 | 1 (4.0) | 0 | 22 (7.7) | 0 | 13 (4.3) | 0 |
|
|
||||||||||||
| Diarrhea | 2 (14.3) | 1 (7.1) | 0 | 0 | 6 (20.7) | 1 (3.4) | 0 | 0 | 21 (7.4) | 1 (0.4) | 11 (3.7) | 1 (0.3) |
|
|
||||||||||||
| Pyrexia | 5 (35.7) | 0 | 1 (7.1) | 0 | 6 (20.7) | 1 (3.4) | 1 (4.0) | 0 | 17 (6.0) | 0 | 25 (8.3) | 1 (0.3) |
|
|
||||||||||||
| Pruritus | 2 (14.3) | 0 | 0 | 0 | 2 (6.9) | 0 | 0 | 0 | 5 (1.8) | 0 | 11 (3.7) | 0 |
|
|
||||||||||||
| Decreased appetite | 2 (14.3) | 0 | 0 | 0 | 2 (6.9) | 0 | 0 | 0 | 5 (1.8) | 0 | 5 (1.7) | 0 |
|
|
||||||||||||
| Vomiting | 2 (14.3) | 0 | 1 (7.1) | 0 | 3 (10.3) | 0 | 1 (4.0) | 0 | 3 (1.1) | 0 | 7 (2.3) | 1 (0.3) |
|
|
||||||||||||
| Abdominal pain, upper | 2 (14.3) | 0 | 0 | 0 | 2 (6.9) | 0 | 1 (4.0) | 0 | 1 (0.4) | 0 | 4 (1.3) | 0 |
|
|
||||||||||||
| Subtotal | 18 (128.6) | 1 (7.1) | 4 (28.6) | 0 | 30 (103.4) | 2 (6.9) | 12 (48.0) | 0 | 181(63.5) | 10 (3.5) | 171 (56.8) | 10 (3.5) |


 PDF
PDF Citation
 Print
Print


 XML Download