Introduction
Materials and Methods
1. Patients
2. Data collection and definitions
3. Statistical analysis
Results
1. Patient characteristics
Table 1
| Overall (unmatched) cohort | Matched cohort | |||||
|---|---|---|---|---|---|---|
|
|
|
|||||
| Observation (n=69) | Adjuvant chemotherapy (n=149) | p-value | Observation (n=57) | Adjuvant chemotherapy (n=57) | p-value | |
| Sex | ||||||
|
|
||||||
| Male | 39 (56.5) | 68 (45.6) | 0.177 | 31 (54.4) | 30 (52.6) | > 0.99 |
|
|
||||||
| Female | 30 (43.5) | 81 (54.4) | 26 (45.6) | 27 (47.4) | ||
|
|
||||||
| Age (yr), median (IQR) | 64 (58–70) | 61 (56–67) | 0.066 | 65 (57–70) | 66 (59–69) | 0.823 |
|
|
||||||
| ECOG PS at surgery | ||||||
|
|
||||||
| 0–1 | 65 (94.2) | 143 (96.0) | 0.729 | 56 (98.2) | 56 (98.2) | > 0.99 |
|
|
||||||
| ≥ 2 | 4 (5.8) | 6 (4.0) | 1 (1.8) | 1 (1.8) | ||
|
|
||||||
| Charlson Comorbidity Index (CCI), mean (range) | 0.7 (0–3) | 0.7 (0–6) | 0.882 | 0.6 (0–3) | 0.8 (0–6) | 0.499 |
|
|
||||||
| Charlson Age-Comorbidity Index (CACI), mean (range) | 2.6 (0–6) | 2.3 (0–8) | 0.167 | 2.5 (0–6) | 2.6 (0–8) | 0.567 |
|
|
||||||
| Tumor extent at the diagnosis | ||||||
|
|
||||||
| Resectable | 7 (10.1) | 15 (10.1) | 0.105 | 6 (10.5) | 5 (8.8) | 0.915 |
|
|
||||||
| BRPC | 39 (56.5) | 103 (69.6) | 35 (61.4) | 37 (64.9) | ||
|
|
||||||
| LAPC | 23 (33.3) | 30 (20.3) | 16 (28.1) | 15 (26.3) | ||
|
|
||||||
| Location of tumor | ||||||
|
|
||||||
| Head | 44 (63.8) | 114 (76.5) | 0.162 | 36 (63.2) | 38 (66.7) | 0.944 |
|
|
||||||
| Body | 12 (17.4) | 20 (13.4) | 10 (17.5) | 10 (17.5) | ||
|
|
||||||
| Tail | 12 (17.4) | 14 (9.4) | 10 (17.5) | 8 (14.0) | ||
|
|
||||||
| Multicentric | 1 (1.4) | 1 (0.7) | 1 (1.8) | 1 (1.8) | ||
|
|
||||||
| Tumor differentiation | ||||||
|
|
||||||
| Well | 4 (5.8) | 20 (13.9) | 0.213 | 4 (7.0) | 6 (10.7) | 0.674 |
|
|
||||||
| Moderate | 60 (87.0) | 114 (79.2) | 50 (87.7) | 46 (82.1) | ||
|
|
||||||
| Poor | 5 (7.2) | 10 (6.9) | 3 (5.3) | 4 (7.1) | ||
|
|
||||||
| Surgical type | ||||||
|
|
||||||
| PPPD/PD | 47 (68.1) | 113 (75.8) | 0.480 | 38 (66.7) | 37 (64.9) | > 0.99 |
|
|
||||||
| Distal pancreatectomy | 18 (26.1) | 30 (20.1) | 16 (28.1) | 16 (28.1) | ||
|
|
||||||
| Total pancreatectomy | 4 (5.8) | 6 (4.0) | 3 (5.3) | 4 (7.0) | ||
|
|
||||||
| Vascular resection | ||||||
|
|
||||||
| Vein resection | 37 (53.6) | 63 (42.3) | 0.157 | 31 (54.4) | 24 (42.1) | 0.261 |
|
|
||||||
| Artery resection | 10 (14.5) | 17 (11.4) | 0.673 | 6 (10.5) | 9 (15.8) | 0.579 |
|
|
||||||
| Pathological T category | ||||||
|
|
||||||
| Pathologic CR | 0 | 5 (3.4) | 0.410 | 51 (89.5) | 50 (87.7) | > 0.99 |
|
|
||||||
| ypT1–T2 | 61 (88.4) | 128 (85.9) | ||||
|
|
||||||
| ypT3–T4 | 8 (11.6) | 16 (10.7) | 6 (10.5) | 7 (12.3) | ||
|
|
||||||
| Pathological N category | ||||||
|
|
||||||
| ypN0 | 40 (58.0) | 85 (57.0) | 0.991 | 33 (57.9) | 31 (54.4) | 0.850 |
|
|
||||||
| ypN1 | 23 (33.3) | 51 (34.2) | 24 (42.1) | 26 (45.6) | ||
|
|
||||||
| ypN2 | 6 (8.7) | 13 (8.7) | ||||
|
|
||||||
| Pathologic tumor stage | ||||||
|
|
||||||
| Pathologic CR | 0 | 5 (3.4) | 0.552 | 0 | 2 (3.5) | 0.494 |
|
|
||||||
| Stage IA/IB | 37 (53.6) | 72 (48.3) | 31 (54.4) | 26 (45.6) | ||
|
|
||||||
| Stage IIA/IIB | 24 (34.8) | 54 (36.2) | 19 (33.3) | 23 (40.4) | ||
|
|
||||||
| Stage III | 8 (11.6) | 18 (12.1) | 7 (12.3) | 6 (10.5) | ||
|
|
||||||
| Lymphovascular invasion | ||||||
|
|
||||||
| Negative | 45 (65.2) | 87 (58.4) | 0.418 | 36 (63.2) | 36 (63.2) | > 0.99 |
|
|
||||||
| Positive | 24 (34.8) | 62 (41.6) | 21 (36.8) | 21 (36.8) | ||
|
|
||||||
| Perineural invasion | ||||||
|
|
||||||
| Negative | 25 (36.2) | 55 (36.9) | > 0.99 | 19 (33.3) | 25 (43.9) | 0.336 |
|
|
||||||
| Positive | 44 (63.8) | 94 (63.1) | 38 (66.7) | 32 (56.1) | ||
|
|
||||||
| Resection margin status | ||||||
|
|
||||||
| Resection margin negative | 58 (84.1) | 126 (84.6) | > 0.99 | 47 (82.5) | 46 (80.7) | > 0.99 |
|
|
||||||
| Resection margin positive | 11 (15.9) | 23 (15.4) | 10 (17.5) | 11 (19.3) | ||
|
|
||||||
| No. of cycles of neoadjuvant FOLFIRINOX, median (IQR) | 9 (7–10) | 7 (5–8) | < 0.001 | 8 (7–10) | 8 (6–9) | 0.801 |
|
|
||||||
| Best response to neoadjuvant FOLFIRINOX | ||||||
|
|
||||||
| Partial response | 21 (33.3) | 47 (32.4) | > 0.99 | 15 (28.8) | 20 (35.1) | 0.623 |
|
|
||||||
| Stable disease | 42 (66.7) | 98 (67.6) | 37 (71.2) | 37 (64.9) | ||
|
|
||||||
| Pathologic responsea) | ||||||
|
|
||||||
| 0–1 | 9 (13.2) | 14 (9.9) | 0.619 | 8 (14.3) | 5 (9.3) | 0.602 |
|
|
||||||
| ≥ 2 | 59 (86.8) | 128 (90.1) | 48 (85.7) | 49 (90.7) | ||
|
|
||||||
| Baseline CA 19-9 level | ||||||
|
|
||||||
| WNL | 24 (42.1) | 38 (30.4) | 0.169 | 19 (39.6) | 15 (33.3) | 0.682 |
|
|
||||||
| > UNL | 33 (57.9) | 87 (69.6) | 29 (60.4) | 30 (66.7) | ||
|
|
||||||
| Preoperative CA 19-9 level | ||||||
|
|
||||||
| WNL | 27 (51.9) | 68 (56.2) | 0.725 | 21 (50.0) | 24 (55.8) | 0.749 |
|
|
||||||
| > UNL | 25 (48.1) | 53 (43.8) | 21 (50.0) | 19 (44.2) | ||
|
|
||||||
| Postoperative CA 19-9 level | ||||||
|
|
||||||
| WNL | 48 (80.0) | 126 (86.3) | 0.356 | 38 (77.6) | 48 (85.7) | 0.407 |
|
|
||||||
| > UNL | 12 (20.0) | 20 (13.7) | 11 (22.4) | 8 (14.3) | ||
Values are presented as number (%) unless otherwise indicated. BRPC, borderline resectable pancreatic cancer; CA 19-9, cancer antigen 19-9; CR, complete response; ECOG PS, Eastern Cooperative Oncology Group performance score; IQR, interquartile range; LAPC, locally advanced pancreatic cancer; PD, pancreaticoduodenectomy; PPPD, pylorus-preserving pancreaticoduodenectomy; UNL, upper normal limit; WNL, within normal limits.
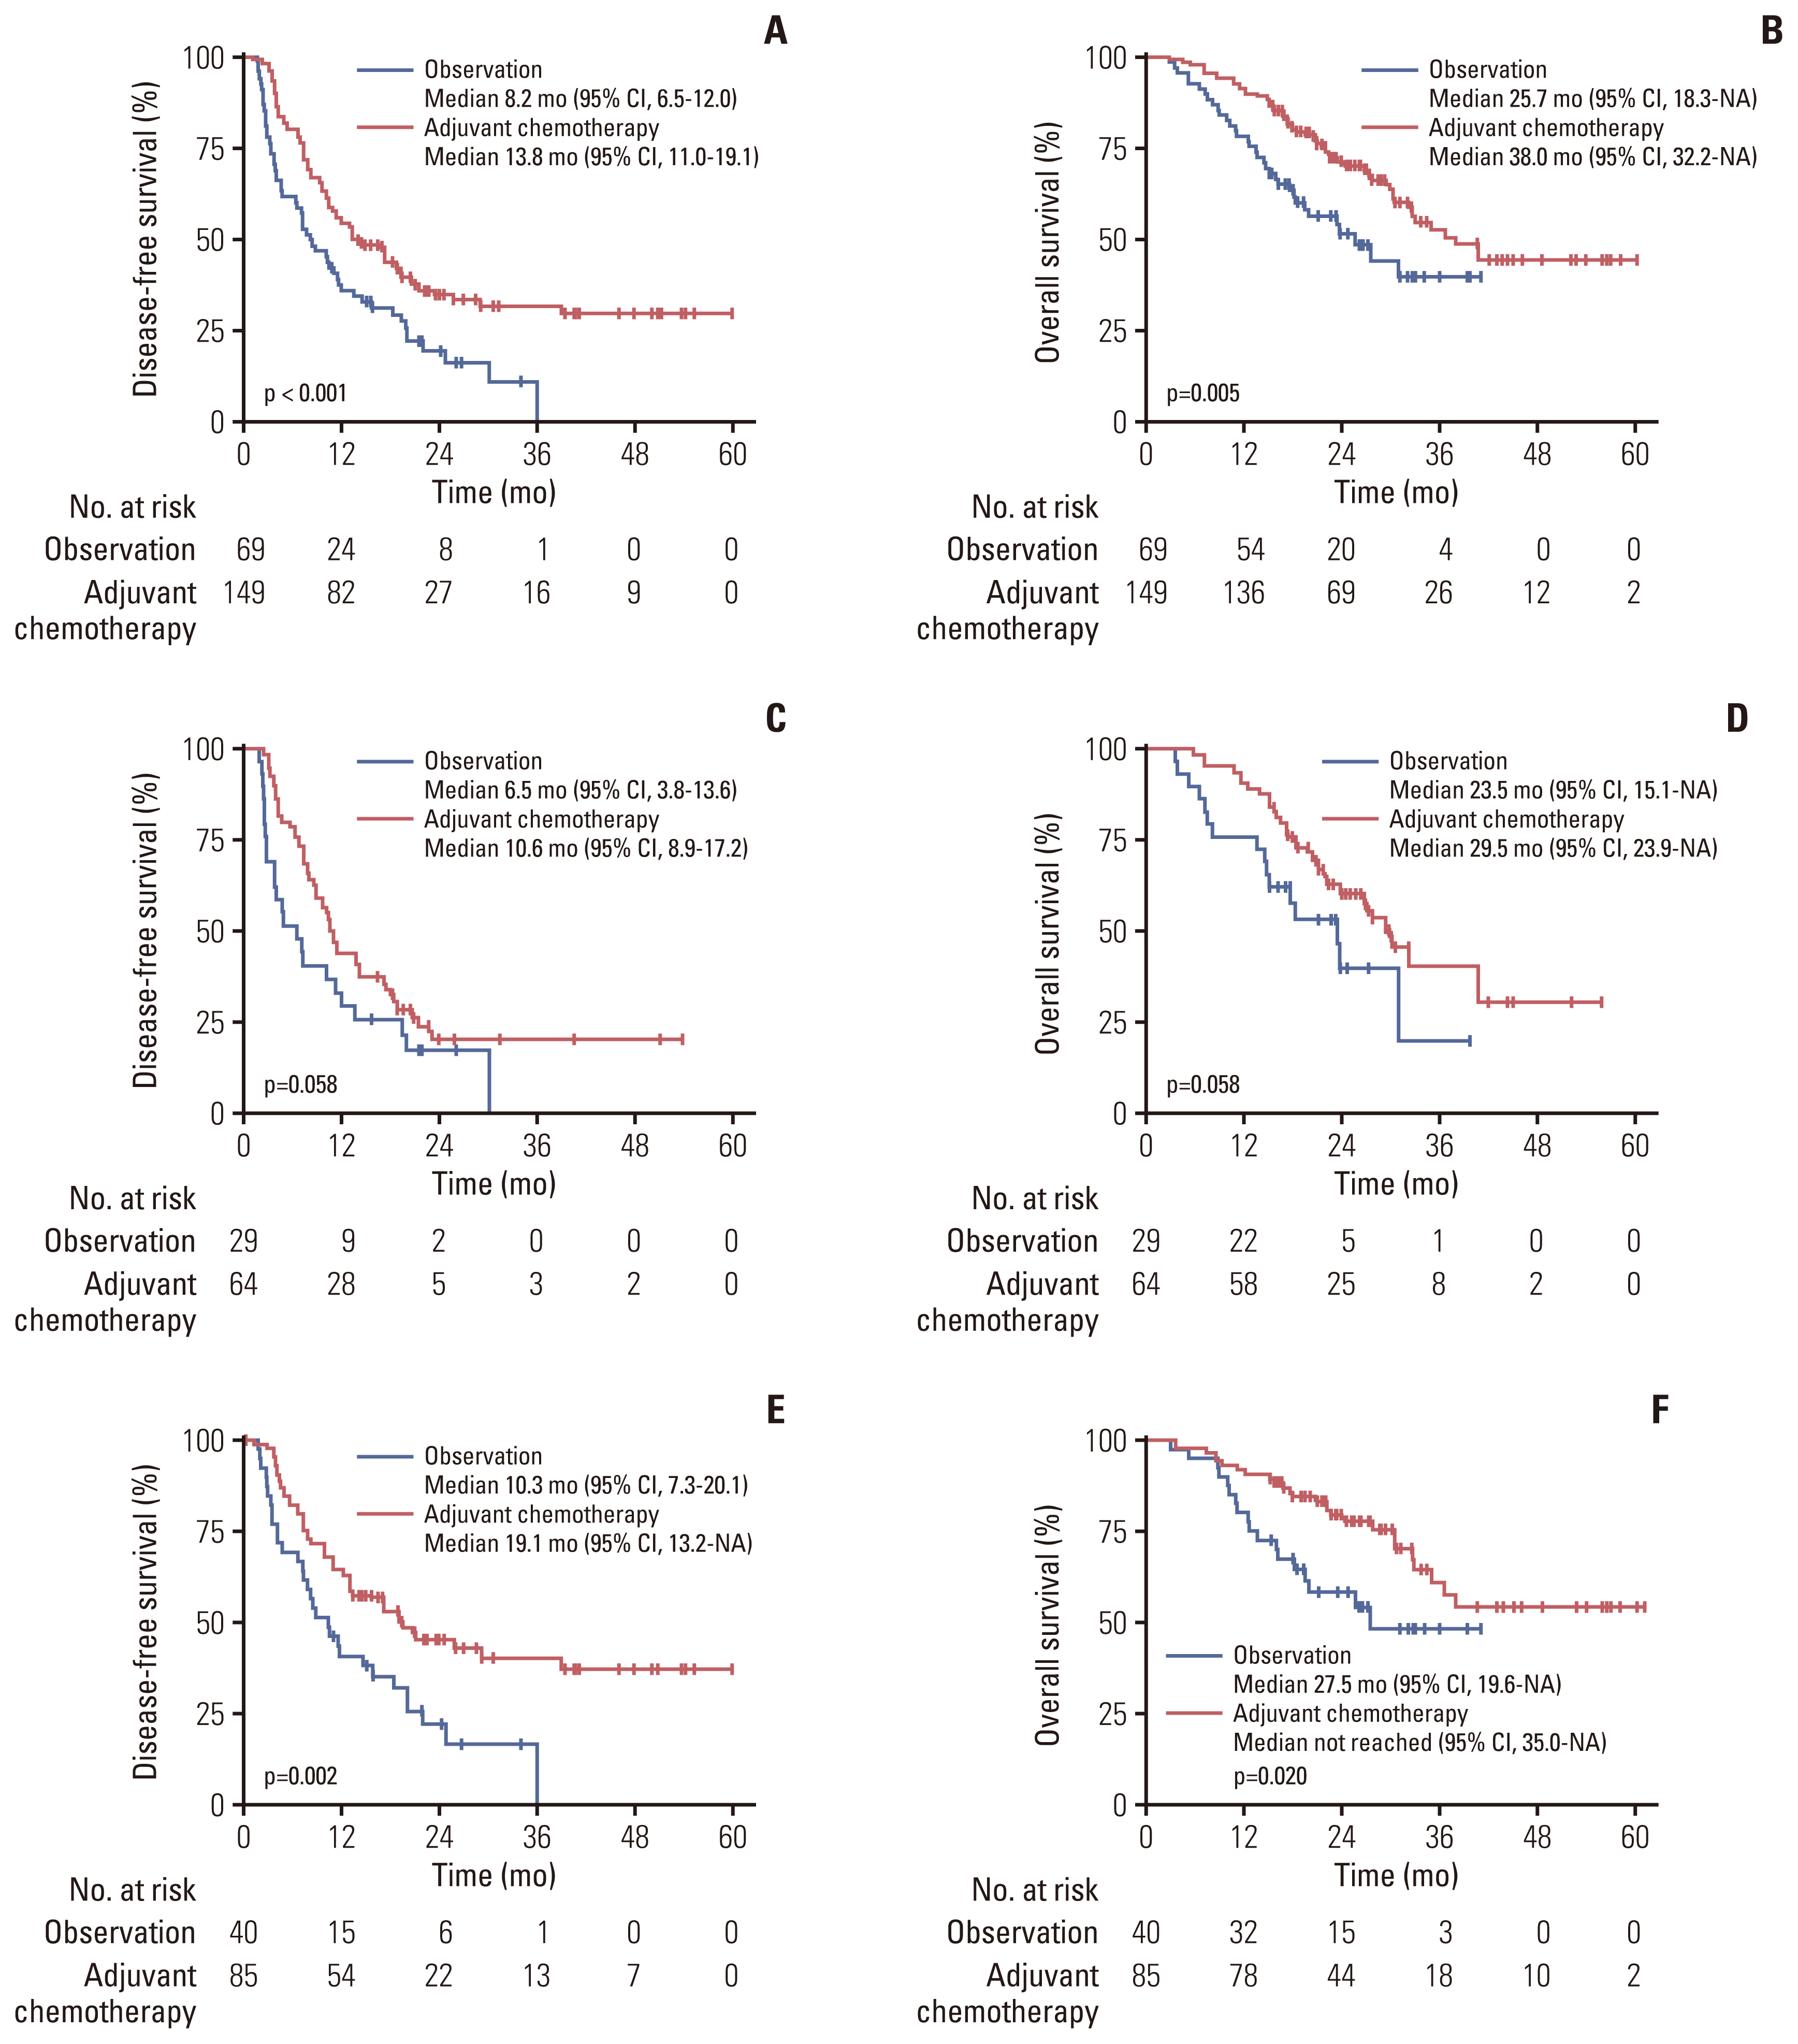
2. Survival outcomes of the overall cohort
Fig. 1

Table 2
BRPC, borderline resectable pancreatic cancer; CI, confidence interval; ECOG PS, Eastern Cooperative Oncology Group performance score; FOLFIRINOX, fluorouracil, leucovorin, irinotecan and oxaliplatin; HR, hazard ratio; LAPC, locally advanced pancreatic cancer; PD, pancreaticoduodenectomy; PPPD, pylorus-preserving pancreaticoduodenectomy.
Table 3
BRPC, borderline resectable pancreatic cancer; CA 19-9, cancer antigen 19-9; CI, confidence interval; ECOG PS, Eastern Cooperative Oncology Group performance score; FOLFIRINOX, fluorouracil, leucovorin, irinotecan and oxaliplatin; HR, hazard ratio; LAPC, locally advanced pancreatic cancer; PD, pancreaticoduodenectomy; PPPD, pylorus-preserving pancreaticoduodenectomy.
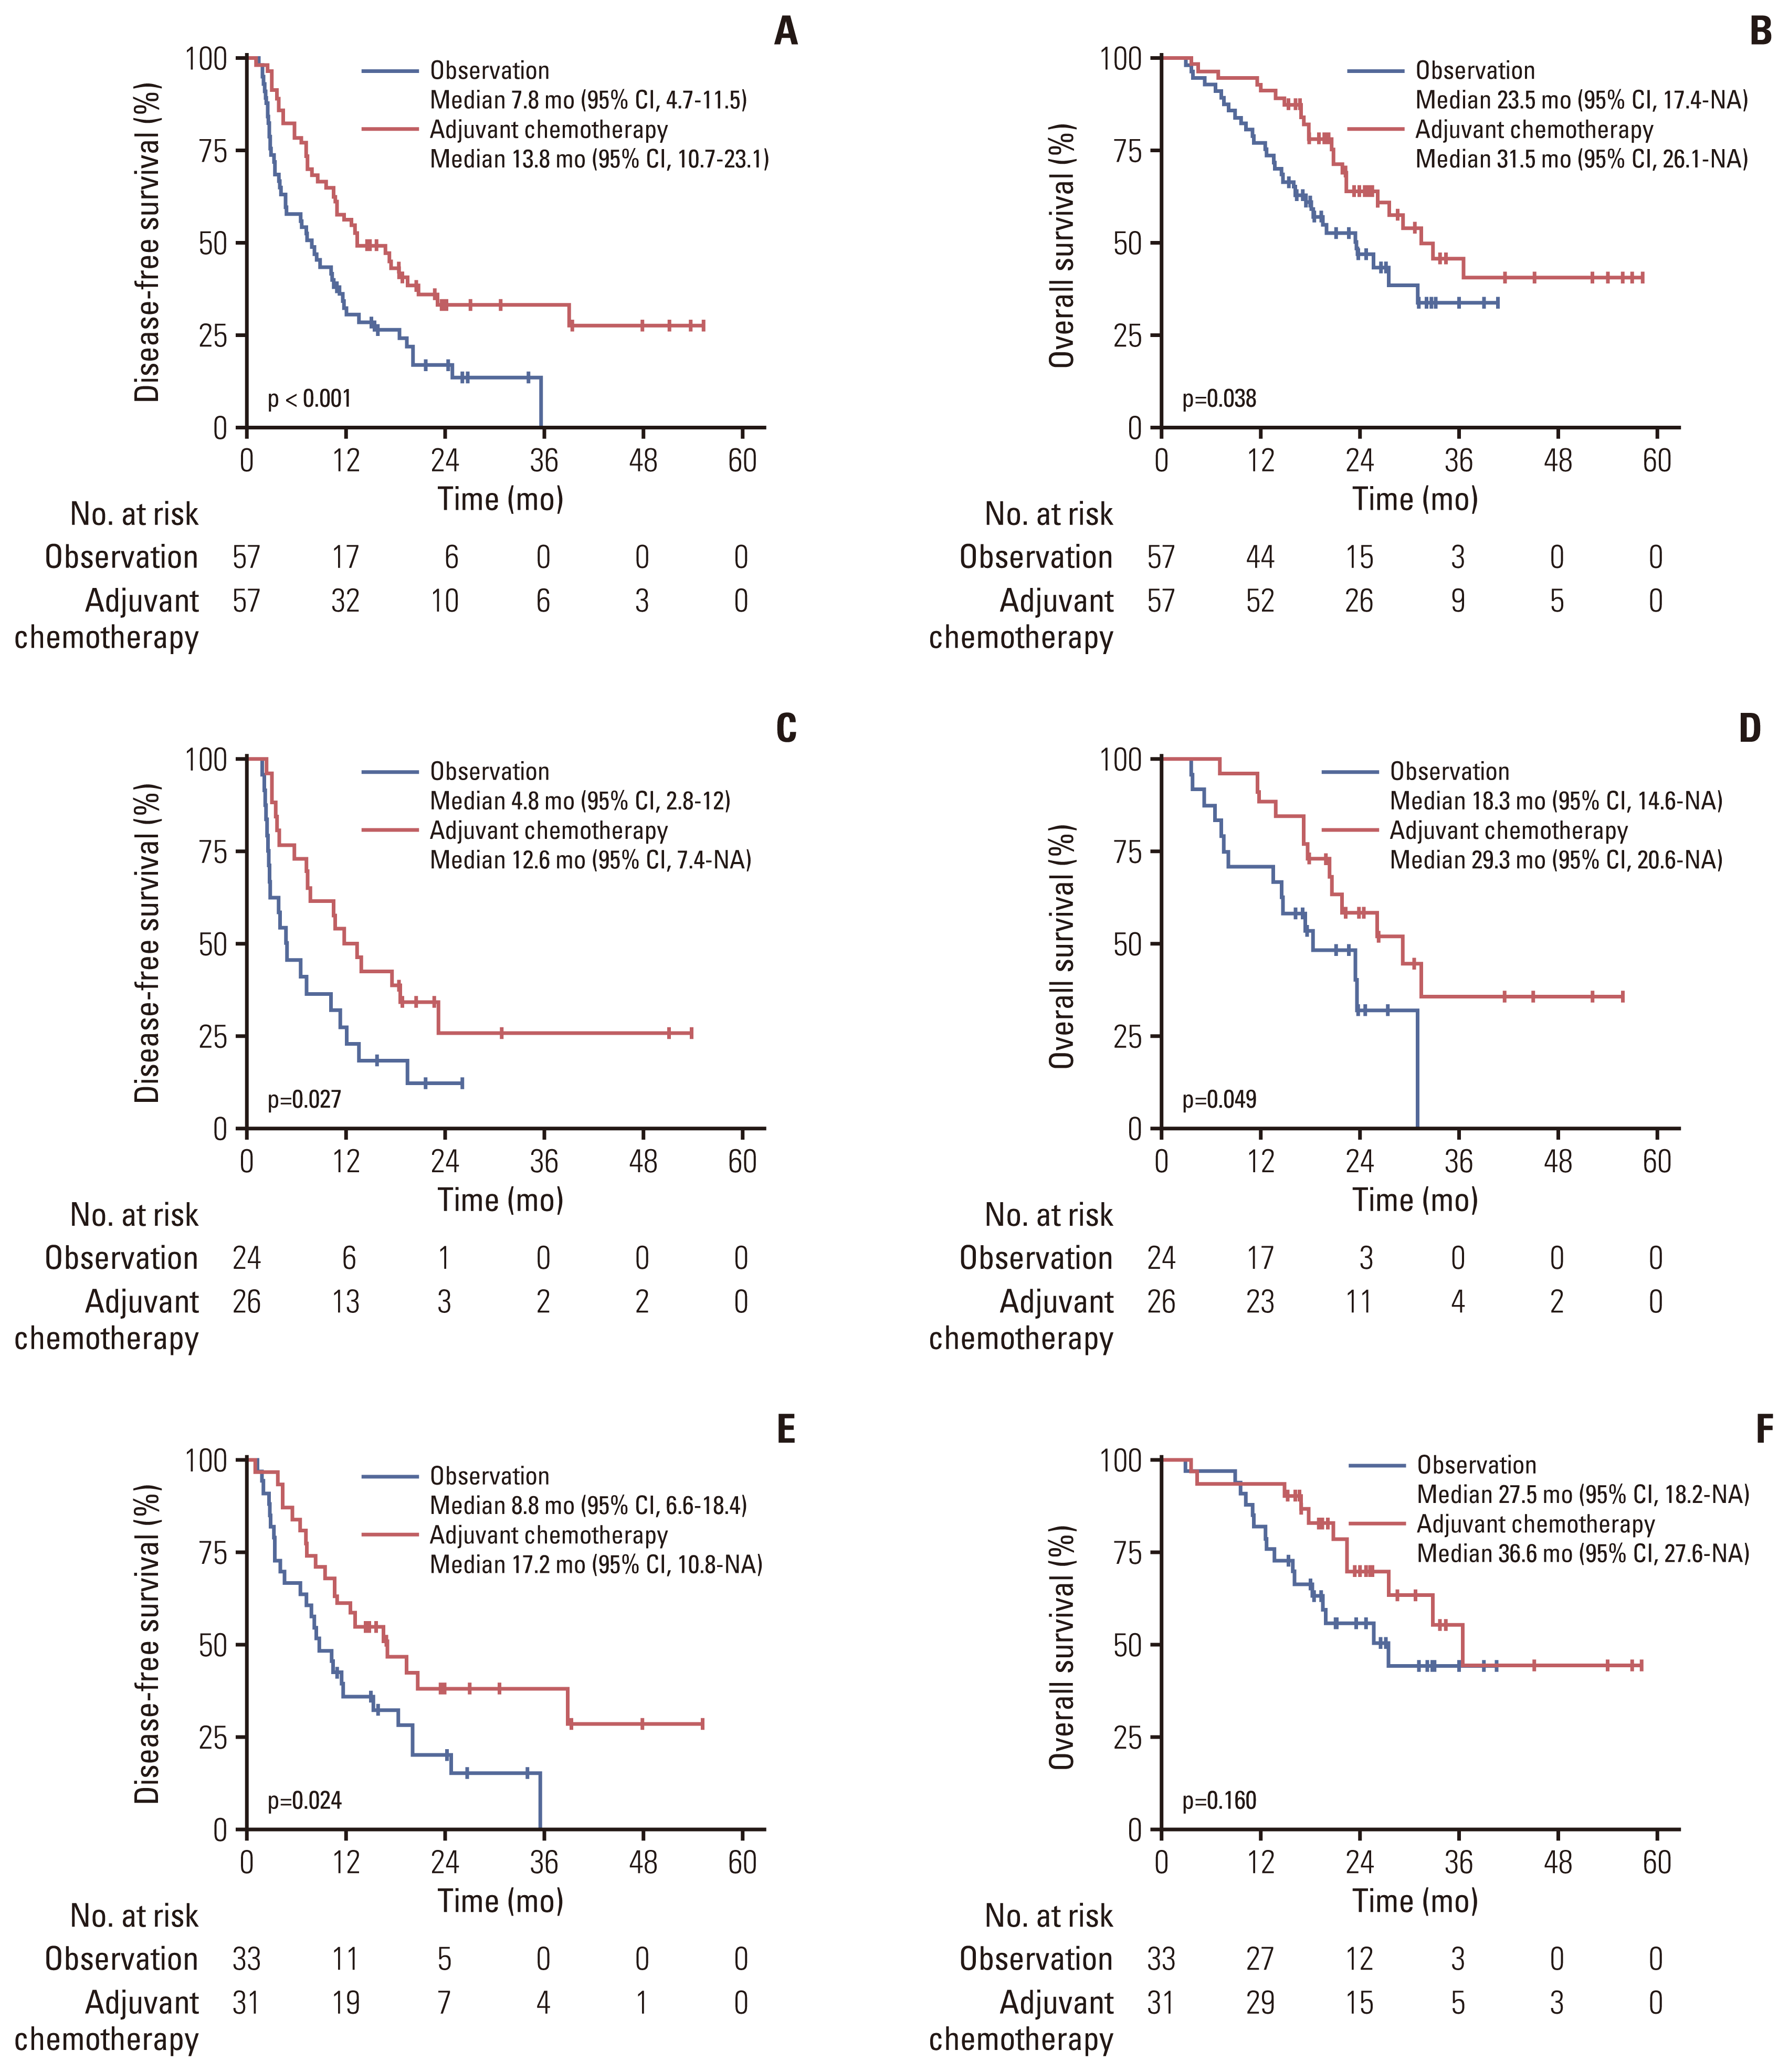
3. Survival outcomes of the PSM cohort
Fig. 2


 PDF
PDF Citation
 Print
Print


 XML Download