Abstract
Purpose
This study aimed to evaluate the participation and follow-up test compliance rates and key performance indicators of the National Cancer Screening Program (NCSP) for colorectal cancer (CRC) from 2004 to 2017.
Materials and Methods
The overall outcomes of the NCSP for CRC were analyzed using the NCSP data collected from 2004 to 2017 and the Korean Central Cancer Registry for CRC from 2005 to 2017. We cross-sectionally analyzed the participation and follow-up test compliance rates and performance indicators for each year. The trend of participation rates as an annual percentage change was assessed, and other statistical analyses were performed.
Results
The screening participation rates increased from 7.3% in 2004 to 30.5% in 2017. Additionally, the screening rates were higher among individuals aged 60–69 years and National Health Insurance Service beneficiaries of low-income status. However, the adherence to the follow-up test decreased from 63% in 2004 to 32% in 2017. The follow-up tests using the double-contrast barium enema method decreased from 42.2% in 2004 to 0.3% in 2017. However, follow-up tests by colonoscopy increased from 21.0% in 2004 to 31.8% in 2017. Furthermore, the positivity, false-positive, and interval CRC rates decreased, whereas the specificity increased from 2004 to 2016, indicating improved performance of CRC.
According to the 2017 Global Burden of Disease study, colorectal cancer (CRC) is the third most common cancer globally [1] and ranks fourth in the years of life lost [2]. In Korea, the incidence rate of CRC has decreased since 2011; however, it remained the fourth common cancer in 2019, with an incidence rate of 56.5 cases per 100,000 population, following stomach, lung, and thyroid cancers. In addition, CRC ranked third in mortality (17.3 per 100,000), following lung and liver cancers [3].
CRC screening reduces the incidence and mortality rates of CRC [4–7], and the fecal occult blood test (FOBT), a noninvasive and simple test, has been widely adopted as a national screening tool [8,9]. Moreover, the Korean National Cancer Screening Program (NCSP) for CRC was launched in 2004 and offers an annual fecal immunochemical test (FIT) for free as a primary examination for people aged > 50 years. In addition, either colonoscopy or double-contrast barium enema (DCBE) is provided free of charge as an additional follow-up examination for FIT-positive individuals [10].
Analyzing the accumulated NCSP data and evaluating its performance are necessary for further development of the NCSP. Furthermore, high participation in screening, adherence to follow-up tests after a positive primary test, and high-quality screening programs are essential to ensure the effectiveness of the NCSP. Therefore, this study examined the participation and follow-up test compliance rates and key performance indicators of the NCSP for CRC from 2004 to 2017. We also investigated if the overall outcome parameters were differed based on the demographic and socioeconomic statuses of the participants.
We analyzed the overall outcomes of the NCSP for CRC using the NCSP data collected from 2004 to 2017, which include information on men and women aged > 50 years who were invited to participate in the program. The NCSP database contains information on sex, age, type of insurance, screening methods used, and screening results. Additionally, the Korean Central Cancer Registry for CRC was merged with the NCSP data from 2005 to 2017 to analyze the performance of the screening tests. Performance indicators are only available a year after date of CRC screening, therefore we could not add performance data for CRC screening cases that occurred throughout 2017 due to lack of availability of data. CRC was identified based on the International Classification of Disease 10th Revision codes C18–20 within 1 year after screening.
Furthermore, the age of the participants was grouped by 10-year intervals, and the health insurance status of the participants, which was used as a proxy for socioeconomic status, was classified as Medical Aid Program (MAP) recipients, National Health Insurance Service (NHIS) beneficiaries of low-income status (lower 50%), and NHIS beneficiaries of high-income status (higher 50%).
We analyzed the participation and follow-up test compliance rates and performance indicators, including cancer detection rate (CDR), positivity rate, sensitivity, specificity, positive predictive value (PPV), false-positive rate (FPR), and interval cancer rate (ICR). The participation rate was calculated as the proportion of those who participated in the CRC screening from those who were eligible for the NCSP for CRC. Moreover, the Joinpoint Regression Program was used to assess the trend of participation rates as an annual percentage change (APC) with 95% confidence intervals (CIs). For this analysis, a linear model with a maximum number of two joint points was used. The follow-up test compliance rate was calculated as the proportion of colonoscopies or DCBEs performed among FIT-positive cases within the same year (e.g., from 1/1 to 31/12 in 2005). The CDR was obtained as the proportion of true positive CRC cases detected from the total screened population. Additionally, the number of positive cases divided by the number of screened participants was defined as the positivity rate, whereas the number of positive results among confirmed participants with CRC was defined as FIT sensitivity. In contrast, the number of negative results among those with no confirmed CRC was defined as FIT specificity. Furthermore, the PPV was interpreted as the probability that a CRC-positive participant really had cancer. In other words, it is defined as the number of true positive cancer cases divided by the total number of positive test results (including false-positive results). The probability of obtaining a positive test result when the participant was CRC-negative was determined as FPR. In addition, the ICR was calculated as the number of interval cancers diagnosed within 1 year (equal to the CRC screening interval) divided by the number of negative test results.
All statistical analyses were performed using the SAS ver. 9.4 (SAS Institute Inc., Cary, NC) and Joinpoint Regression Program ver. 4.9.0.0 – March 2021 (Statistical Methodology and Applications Branch, Surveillance Research Program, National Cancer Institute).
The number of participants screened and invited to undergo CRC screening increased from 6,046,304 and 441,392 in 2004 to 18,929,321 and 5,770,617 in 2017. Screening participation rates increased steadily annually from 7.3% in 2004 to 32.7% in 2011. It decreased to 24.7% in 2012; however, it increased again to 30.5% in 2017. The NCSP participants and screening rates from 2004 to 2017 are summarized in S1 and S2 Tables. The joinpoint regression analysis showed an overall increasing trend, with APCs of 3.88 between 2004 and 2010 and 1.18 between 2013 and 2017. The screening rates were similar between women and men (Fig. 1). According to age group, the screening rates were highest among participants aged 60–69 years and lowest among participants aged > 80 years (Fig. 2). MAP recipients generally showed the lowest screening rate because the participants were grouped according to their income status (Fig. 3).
Table 1 shows the performance of the NCSP for CRC from 2004 to 2016. Approximately 1.1–1.6 CRCs were detected per 1,000 screenings. FIT sensitivity and specificity were between 53.1% and 63.2% and between 92.4% and 95.6%, respectively. Furthermore, the positivity rate (from 7.7% to 4.5%) and FPR (from 7.6% to 4.4%) showed a decreasing trend, and the PPV increased from 1.6% to 2.4%–2.6%. The ICR for CRC had decreased from 1.2 to 0.8 per 1,000 negative FIT cases.
FIT-positive individuals were guided to undergo either colonoscopy or DCBE as a follow-up screening test according to the NCSP protocol. Fig. 4 shows the trend in the follow-up rates for colonoscopy and DCBE from 2004 to 2017. Overall, approximately 63% of FIT-positive participants underwent follow-up tests by either colonoscopy or DCBE in 2004, and the follow-up rate decreased to 32% in 2017 (Fig. 4A). There was no significant difference in the follow-up rates between men and women (Fig. 4B). The follow-up rates were higher among those aged 50–69 years than those aged > 70 years (Fig. 4C). The follow-up rates among NHIS beneficiaries of high-income status decreased by approximately 50% since 2004, whereas those among MAP recipients decreased by approximately 5% (Fig. 4D).
Moreover, the number of follow-up screening tests by DCBE decreased from 14,009/33,173 FIT-positive cases (42.2%) in 2004 to 732/229,779 FIT-positive cases (0.3%) in 2017. On the contrary, the number of follow-up screening tests by colonoscopy increased from 6,966/33,173 FIT-positive cases (21.0%) in 2004 to 73,056/229,779 FIT-positive cases (31.8%) in 2017. DCBE was performed more frequently than colonoscopy in 2004 and 2005; however, colonoscopy has been selected more than DCBE since 2006, and 99% of the follow-up screening tests were performed using colonoscopy in 2017 (732 vs. 73,056 participants) (Fig. 5, S3 Table). The number of participants who selected colonoscopy as a follow-up test increased 10-fold over the 14 years.
This study demonstrated the screening and follow-up rates after a positive FIT result and the performance of FIT from 2004 to 2017 in a population-based nationwide CRC screening program in Korea. From 2004 to 2017, the participation rates in the NCSP for CRC have steadily increased, except for an abrupt decrease in 2012, which is possibly due to the increase in the number of eligible participants (increased denominator) and the participant’s unawareness of their eligibility (decreased numerator) as the interval for the FOBT changed from 2 years to 1 year in 2012. Regarding the follow-up test after a positive FOBT, the number of participants who selected colonoscopy as a follow-up test in 2017 increased 10-fold compared with 2004. Overall, the NCSP’s quality for CRC screening has improved, based on the trends in the performance indicators from 2004 to 2016. The positivity rate, FPR, and ICR decreased, whereas the specificity increased.
Although the participation rate has steadily increased, participation rates in Korea remain lower than those observed in other countries. CRC screening in the United States is largely opportunistic. The U.S. Preventive Services Task Force recommends CRC screening for adults aged 50–75 years with grade A and adults aged 45–49 years with grade B through any of the following options: (1) annual FIT, (2) sigmoidoscopy every 10 years and annual FIT, (3) colonoscopy every 10 years, or (4) computed tomography colonography every 5 years [11]. Additionally, the screening rate in the United States for participants aged > 50 years was approximately 63% in 2015, and 60.3% of the participants were screened with endoscopy [12]. In Europe, most countries provide population-based organized screening programs [13], and screening rates with FIT are approximately 25% in France, 37% in Hungary, 46% in Italy, and 55% in the United Kingdom [14].
The overall low participation rates in Korea can be attributed to analysis of NCSP data only; we could not include patients who underwent private screenings. In Korea, CRC screening tests are available as opportunistic screening options, and individuals must pay for all costs related to the procedure if screened in an opportunistic screening program. Since the NCSP does not provide endoscopy as the primary modality of CRC screening, individuals can decide not to participate in the NCSP and be screened with a private screening program if they prefer colonoscopy, despite the costs. Moreover, colonoscopy is easily accessible at a low cost, and experienced colonoscopists are widely available in Korea; thus, there are limited obstacles to colonoscopy for CRC screening if the participants are willing to pay out-of-pocket expenses [15]. In fact, in a previous study conducted in 2017, the screening rate with recommendations both through the organized and opportunistic cancer screening programs reported was 56.8% [16], which is significantly higher than that in our study (30.5% in 2017). Although a direct comparison of screening rates from each study is difficult because different data sources were used, the examination rate found in the previous study was remarkably higher than that in our study. Furthermore, the difference can be interpreted as screening performed with colonoscopy through opportunistic screening programs [17]. The recent low follow-up rate could also possibly be because the colonoscopy was performed at the patient’s own expense through a medical treatment rather than through the screening process [17].
Additionally, a recent study in Korea found that 68.7% of 396 respondents preferred colonoscopy over FIT as a primary CRC screening technique because of its accuracy and ability to provide therapeutic options [18]. They also found that participants with a higher-income level preferred colonoscopy. Interestingly, our study also demonstrated that participation rates were lower among NHIS beneficiaries of high-income status than those with lower income status. This is possibly because NHIS beneficiaries of higher-income status selected to undergo colonoscopy through a private screening program, instead of participating in the NCSP. The preference for colonoscopy was also reflected in the trends of the follow-up test type. We found that colonoscopy was significantly more often selected as a follow-up test than DCBE, and this trend has become remarkably more pronounced in recent years, with the number of individuals undergoing colonoscopy being 99 times the number of individuals undergoing DCBE. Considering the preference for colonoscopy, the colonoscopy screening pilot study was launched in 2009 to evaluate the feasibility and effectiveness of colonoscopy as the primary method for organized CRC screening, the results of which may be revealed in approximately 5 years [19].
Participation rates were highest among those in their 60s and lowest among those in their 80s and above. Since the Korean guidelines for CRC screening [20] recommend screening for those between aged 45 and 80 years, the low screening rate in participants in their 80s seems adequate. However, since 2011, the participation rate among those in their 50s has been significantly lower than those participants aged between 60 and 79 years. This is because participants in their 50s tend to feel that they are not susceptible to CRC and do not need to be screened. As shown in previous studies, perceived low susceptibility to CRC may be associated with low participation in screening in a similar context in which no family history or absence of symptoms is a barrier to CRC screening [21].
Our study showed that participation rates are lower in MAP recipients than in NHIS beneficiaries, and this difference can contribute to the health disparity in patients with CRC. A previous study reported that participants with lower socioeconomic status had a significantly higher risk of being diagnosed at a later stage of CRC, with an estimated odds ratio of 1.29 (95% CI, 1.03 to 1.61) [22]. Given that CRC screening programs are provided free of charge to everyone in Korea, the cost of testing may not be a barrier to screening participation in this context. The presence of substantial differences in participation according to socioeconomic differences may be partially explained by differences in social cognition variables, such as knowledge, risk awareness, beliefs, and attitudes. In addition, lack of time, life difficulties, or physical disability associated with lower socioeconomic status [23] may also be barriers to screening participation apart from the cost. Therefore, strategies to intervene in patient-centered and system-related barriers should be implemented to improve screening rates for those with lower socioeconomic status.
At the beginning of each calendar year, all eligible individuals in the target population of the NCSP receive an invitation letter from the NHIS along with information on CRC screening and the locations of the screening units to raise awareness about CRC and the importance of screening. Although our findings indicate that the trajectories of participation rates differ by participant characteristics, the strategies currently applied to increase participation rates do not differ according to the participants’ characteristics. Targeted interventions are required to reduce the disparities in cancer screening success.
Ensuring the quality of screening is a key factor in achieving the goal of the screening program. The results of our study indicate that the quality of screening of the NCSP for CRC in Korea has improved since 2004; the positivity rate and FPR have decreased, whereas the sensitivity, specificity, and PPV have increased simultaneously. These results indicate that the screening accuracy has improved, and missed cancer diagnoses have occurred less frequently. These improvements might be due to diverse efforts to improve the quality of the NCSP. The quality guidelines for cancer screening were developed, and the National Quality Improvement Program (NQIP) for NCSP was implemented in 2008. According to the NQIP, the screening quality of its units was evaluated every 3 years, and feedback was provided to the screening units to improve the quality of the screening services. To evaluate and improve the screening quality, early outcomes and long-term impact indicators need to be assessed. In addition, determining the optimum cutoff level of each performance indicator in future studies is necessary to ensure the quality control of the NCSP.
This study has some limitations. First, we were unable to include opportunistic screenings performed outside the NCSP. Second, we were not able to explore why a patient did not undergo an initial or follow-up screening test and why a patient decided to undergo either colonoscopy or DCBE for the follow-up test due to the limited information provided by the NCSP database. However, this study investigated the outcome of the NCSP for CRC over 14 years using the largest dataset containing all information related to the NCSP.
Overall, the participation rates and performance of the NCSP for CRC steadily improved from 2004 to 2017. In addition, there was rapid growth in colonoscopy volume as a follow-up test. Continued efforts will be required to reduce the disparity in screening, improve adherence to follow-up tests, and ultimately enhance the long-term effects of screening.
Electronic Supplementary Material
Supplementary materials are available at Cancer Research and Treatment website (https://www.e-crt.org).
Notes
Ethical Statement
This study was approved by the Institutional Review Board of the National Cancer Center in Korea (approval number: NCCNCS08129).
Acknowledgments
This study was supported by a Grant-in-Aid for Cancer Research and Control from the National Cancer Center of Korea (2210773-1).
References
1. Bray F, Ferlay J, Soerjomataram I, Siegel RL, Torre LA, Jemal A. Global cancer statistics 2018: GLOBOCAN estimates of incidence and mortality worldwide for 36 cancers in 185 countries. CA Cancer J Clin. 2018; 68:394–424.

2. Global Burden of Disease Cancer Collaboration, Fitzmaurice C, Abate D, Abbasi N, Abbastabar H, Abd-Allah F, et al. Global, regional, and national cancer incidence, mortality, years of life lost, years lived with disability, and disability-adjusted life-years for 29 cancer groups, 1990 to 2017: a systematic analysis for the Global Burden of Disease Study. JAMA Oncol. 2019; 5:1749–68.
3. Kang MJ, Won YJ, Lee JJ, Jung KW, Kim HJ, Kong HJ, et al. Cancer statistics in Korea: incidence, mortality, survival, and prevalence in 2019. Cancer Res Treat. 2022; 54:330–44.

4. Siegel R, Desantis C, Jemal A. Colorectal cancer statistics, 2014. CA Cancer J Clin. 2014; 64:104–17.
5. Levin B, Lieberman DA, McFarland B, Andrews KS, Brooks D, Bond J, et al. Screening and surveillance for the early detection of colorectal cancer and adenomatous polyps, 2008: a joint guideline from the American Cancer Society, the US Multi-Society Task Force on Colorectal Cancer, and the American College of Radiology. Gastroenterology. 2008; 134:1570–95.

6. Smith RA, von Eschenbach AC, Wender R, Levin B, Byers T, Rothenberger D, et al. American Cancer Society guidelines for the early detection of cancer: update of early detection guidelines for prostate, colorectal, and endometrial cancers. Also: update 2001--testing for early lung cancer detection. CA Cancer J Clin. 2001; 51:38–75.

7. Whitlock EP, Lin JS, Liles E, Beil TL, Fu R. Screening for colorectal cancer: a targeted, updated systematic review for the U.S. Preventive Services Task Force. Ann Intern Med. 2008; 149:638–58.

8. Chiu HM, Chang LC, Hsu WF, Chou CK, Wu MS. Non-invasive screening for colorectal cancer in Asia. Best Pract Res Clin Gastroenterol. 2015; 29:953–65.

9. Schreuders EH, Ruco A, Rabeneck L, Schoen RE, Sung JJ, Young GP, et al. Colorectal cancer screening: a global overview of existing programmes. Gut. 2015; 64:1637–49.

10. Kim Y, Jun JK, Choi KS, Lee HY, Park EC. Overview of the National Cancer Screening Programme and the cancer screening status in Korea. Asian Pac J Cancer Prev. 2011; 12:725–30.
11. Final recommendation statement. Colorectal cancer: screening. Clinical considerations [Internet]. Rockville, MD: U.S. Preventive Services Task Force;2017. [cited 2020 Oct 27]. Available from: https://www.uspreventiveservicestaskforce.org/Page/Document/RecommendationStatementFinal/colorectal-cancer-screening2#consider.
12. Colorectal cancer facts & figures 2017–2019 [Internet]. Atlanta, GA: American Cancer Society;2020. [cited 2020 Oct 27]. Available from: https://www.cancer.org/content/dam/cancer-org/research/cancer-facts-and-statistics/colorectal-cancer-facts-and-figures/colorectal-cancerfacts-and-figures-2017-2019.pdf.
13. Segnan N, Patnick J, von Karsa L. European guidelines for quality assurance in colorectal cancer screening and diagnosis. Luxembourg: Publications Office of the European Union;2010.
14. Colorectal cancer screening. IARC Handbooks of Cancer Prevention. 17:[Internet]. Lyon: International Agency for Research on Cancer;2019. [cited 2020 Oct 27]. Available from: https://publications.iarc.fr/Book-And-Report-Series/Iarc-Handbooks-Of-Cancer-Prevention/Colorectal-Cancer-Screening-2019.
15. Choi JH, Cha JM, Yoon JY, Kwak MS, Jeon JW, Shin HP. The current capacity and quality of colonoscopy in Korea. Intest Res. 2019; 17:119–26.
16. Hong S, Lee YY, Lee J, Kim Y, Choi KS, Jun JK, et al. Trends in cancer screening rates among Korean men and women: results of the Korean National Cancer Screening Survey, 2004–2018. Cancer Res Treat. 2021; 53:330–8.

17. Kim YJ, Shim JI, Park E, Kang M, Kang S, Lee J, et al. Adherence to follow-up examination after positive fecal occult blood test results affects colorectal cancer mortality: a Korea population-based cohort study. Dig Liver Dis. 2021; 53:631–8.

18. Cho YH, Kim DH, Cha JM, Jeen YT, Moon JS, Kim JO, et al. Patients’ preferences for primary colorectal cancer screening: a survey of the National Colorectal Cancer Screening Program in Korea. Gut Liver. 2017; 11:821–7.

19. Park B, Jun JK, Kim BC, Choi KS, Suh M; The Expert Advisory Committee, et al. Korean colonoscopy screening pilot study (K-cospi) for screening colorectal cancer: study protocol for the multicenter, community-based clinical trial. BMC Gastroenterol. 2021; 21:36.

20. Sohn DK, Kim MJ, Park Y, Suh M, Shin A, Lee HY, et al. The Korean guideline for colorectal cancer screening. J Korean Med Assoc. 2015; 58:420–32.

21. Jones RM, Devers KJ, Kuzel AJ, Woolf SH. Patient-reported barriers to colorectal cancer screening: a mixed-methods analysis. Am J Prev Med. 2010; 38:508–16.
Fig. 1
Trends of participation rates from 2004 to 2017 in the National Cancer Screening Program for colorectal cancer by sex: total (A), male (B), and female (C) annual percent change (APC). a)The slope is significantly different from zero at the alpha value of 0.05.
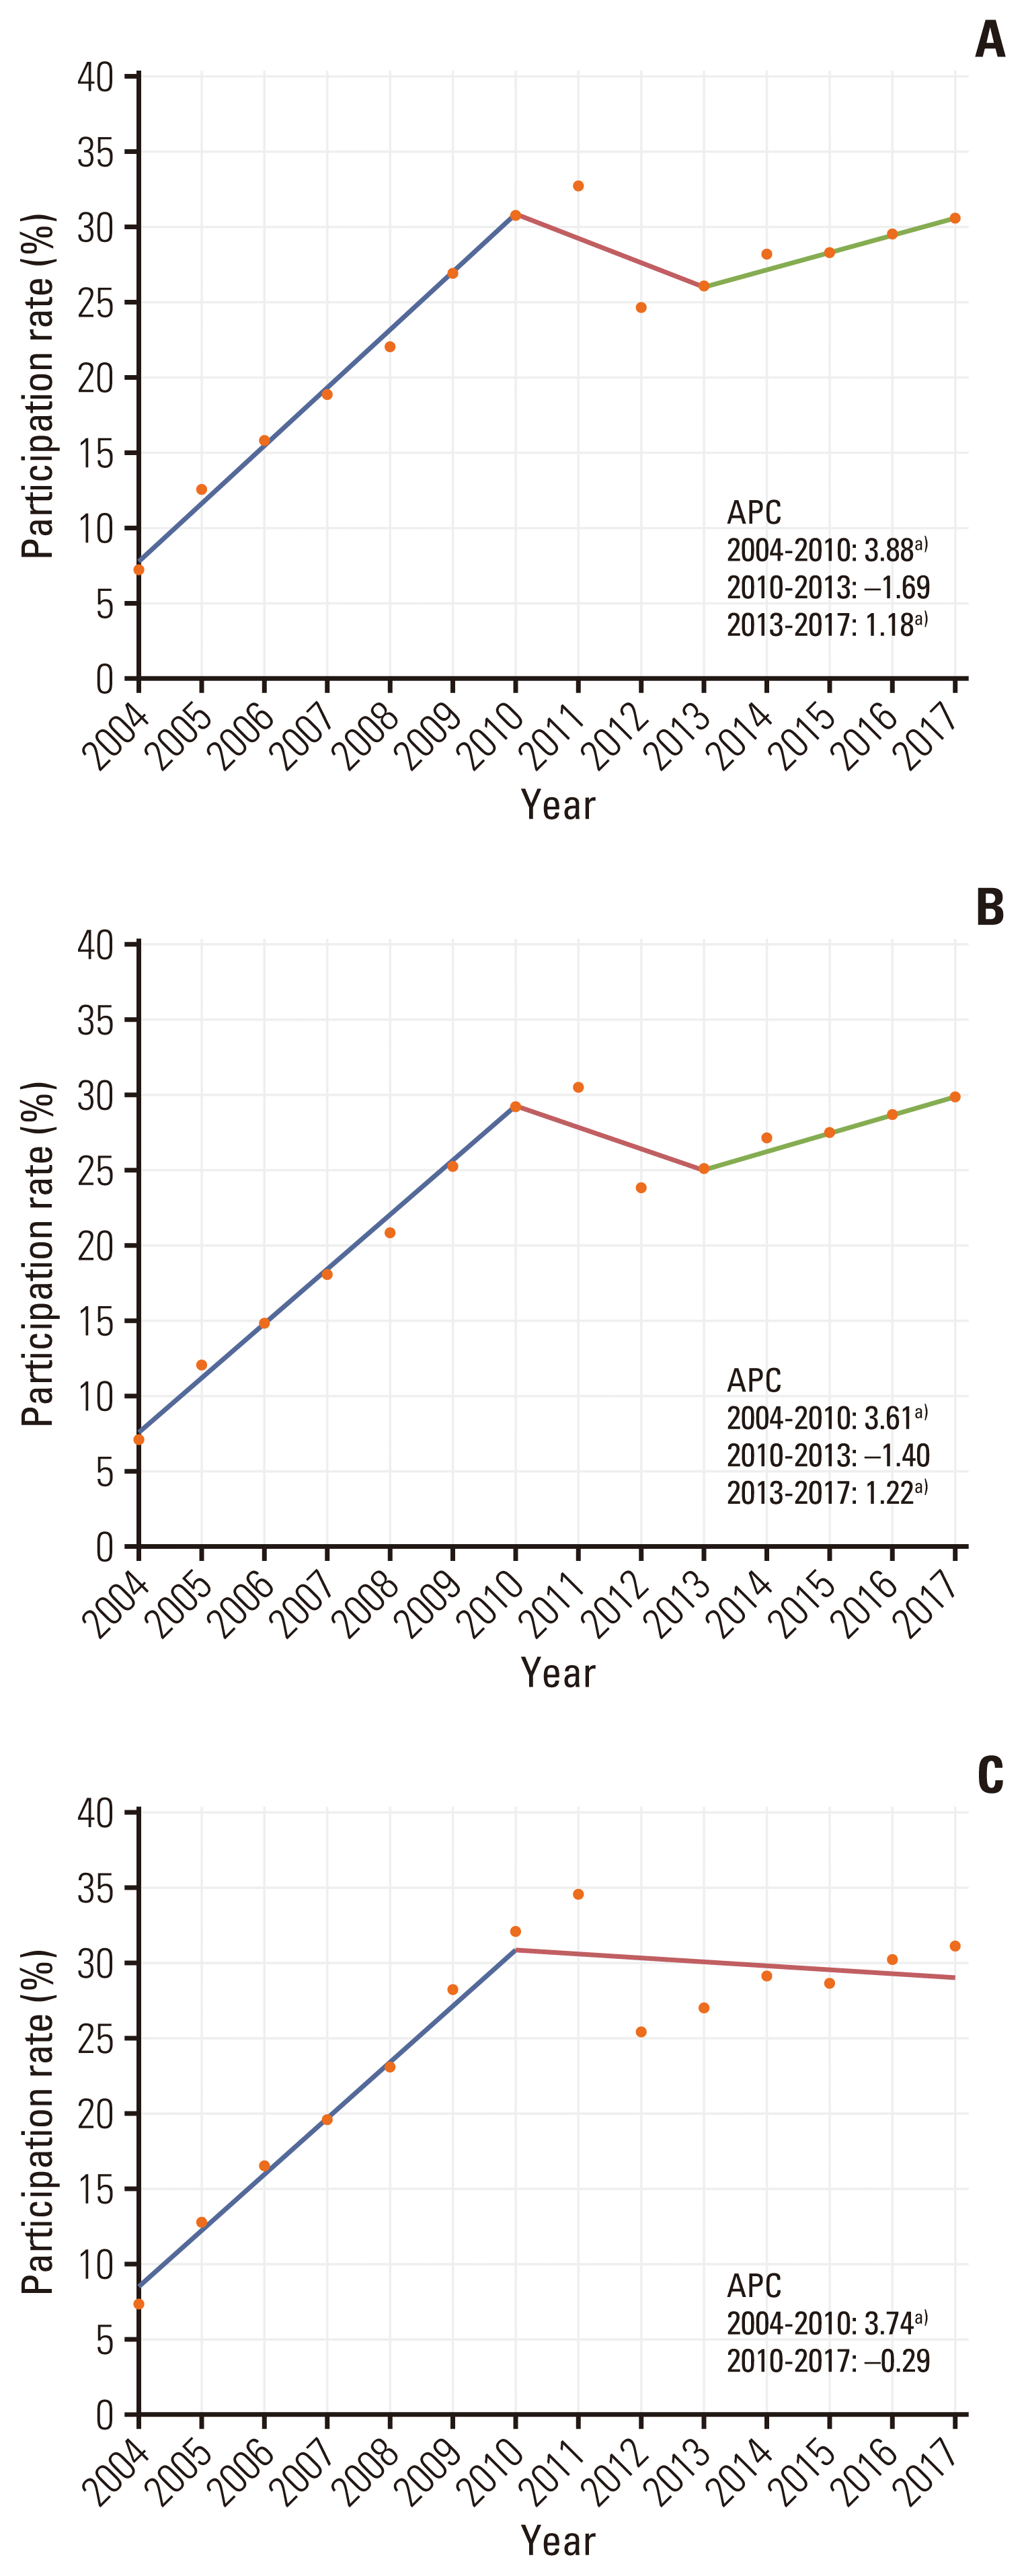
Fig. 2
Trends of participation rates from 2004 to 2017 in the National Cancer Screening Program for colorectal cancer by age group: 50–59 (A), 60–69 (B), 70–79 (C), and > 80 years (D) annual percent change (APC). a)The slope is significantly different from zero at the alpha value of 0.05.
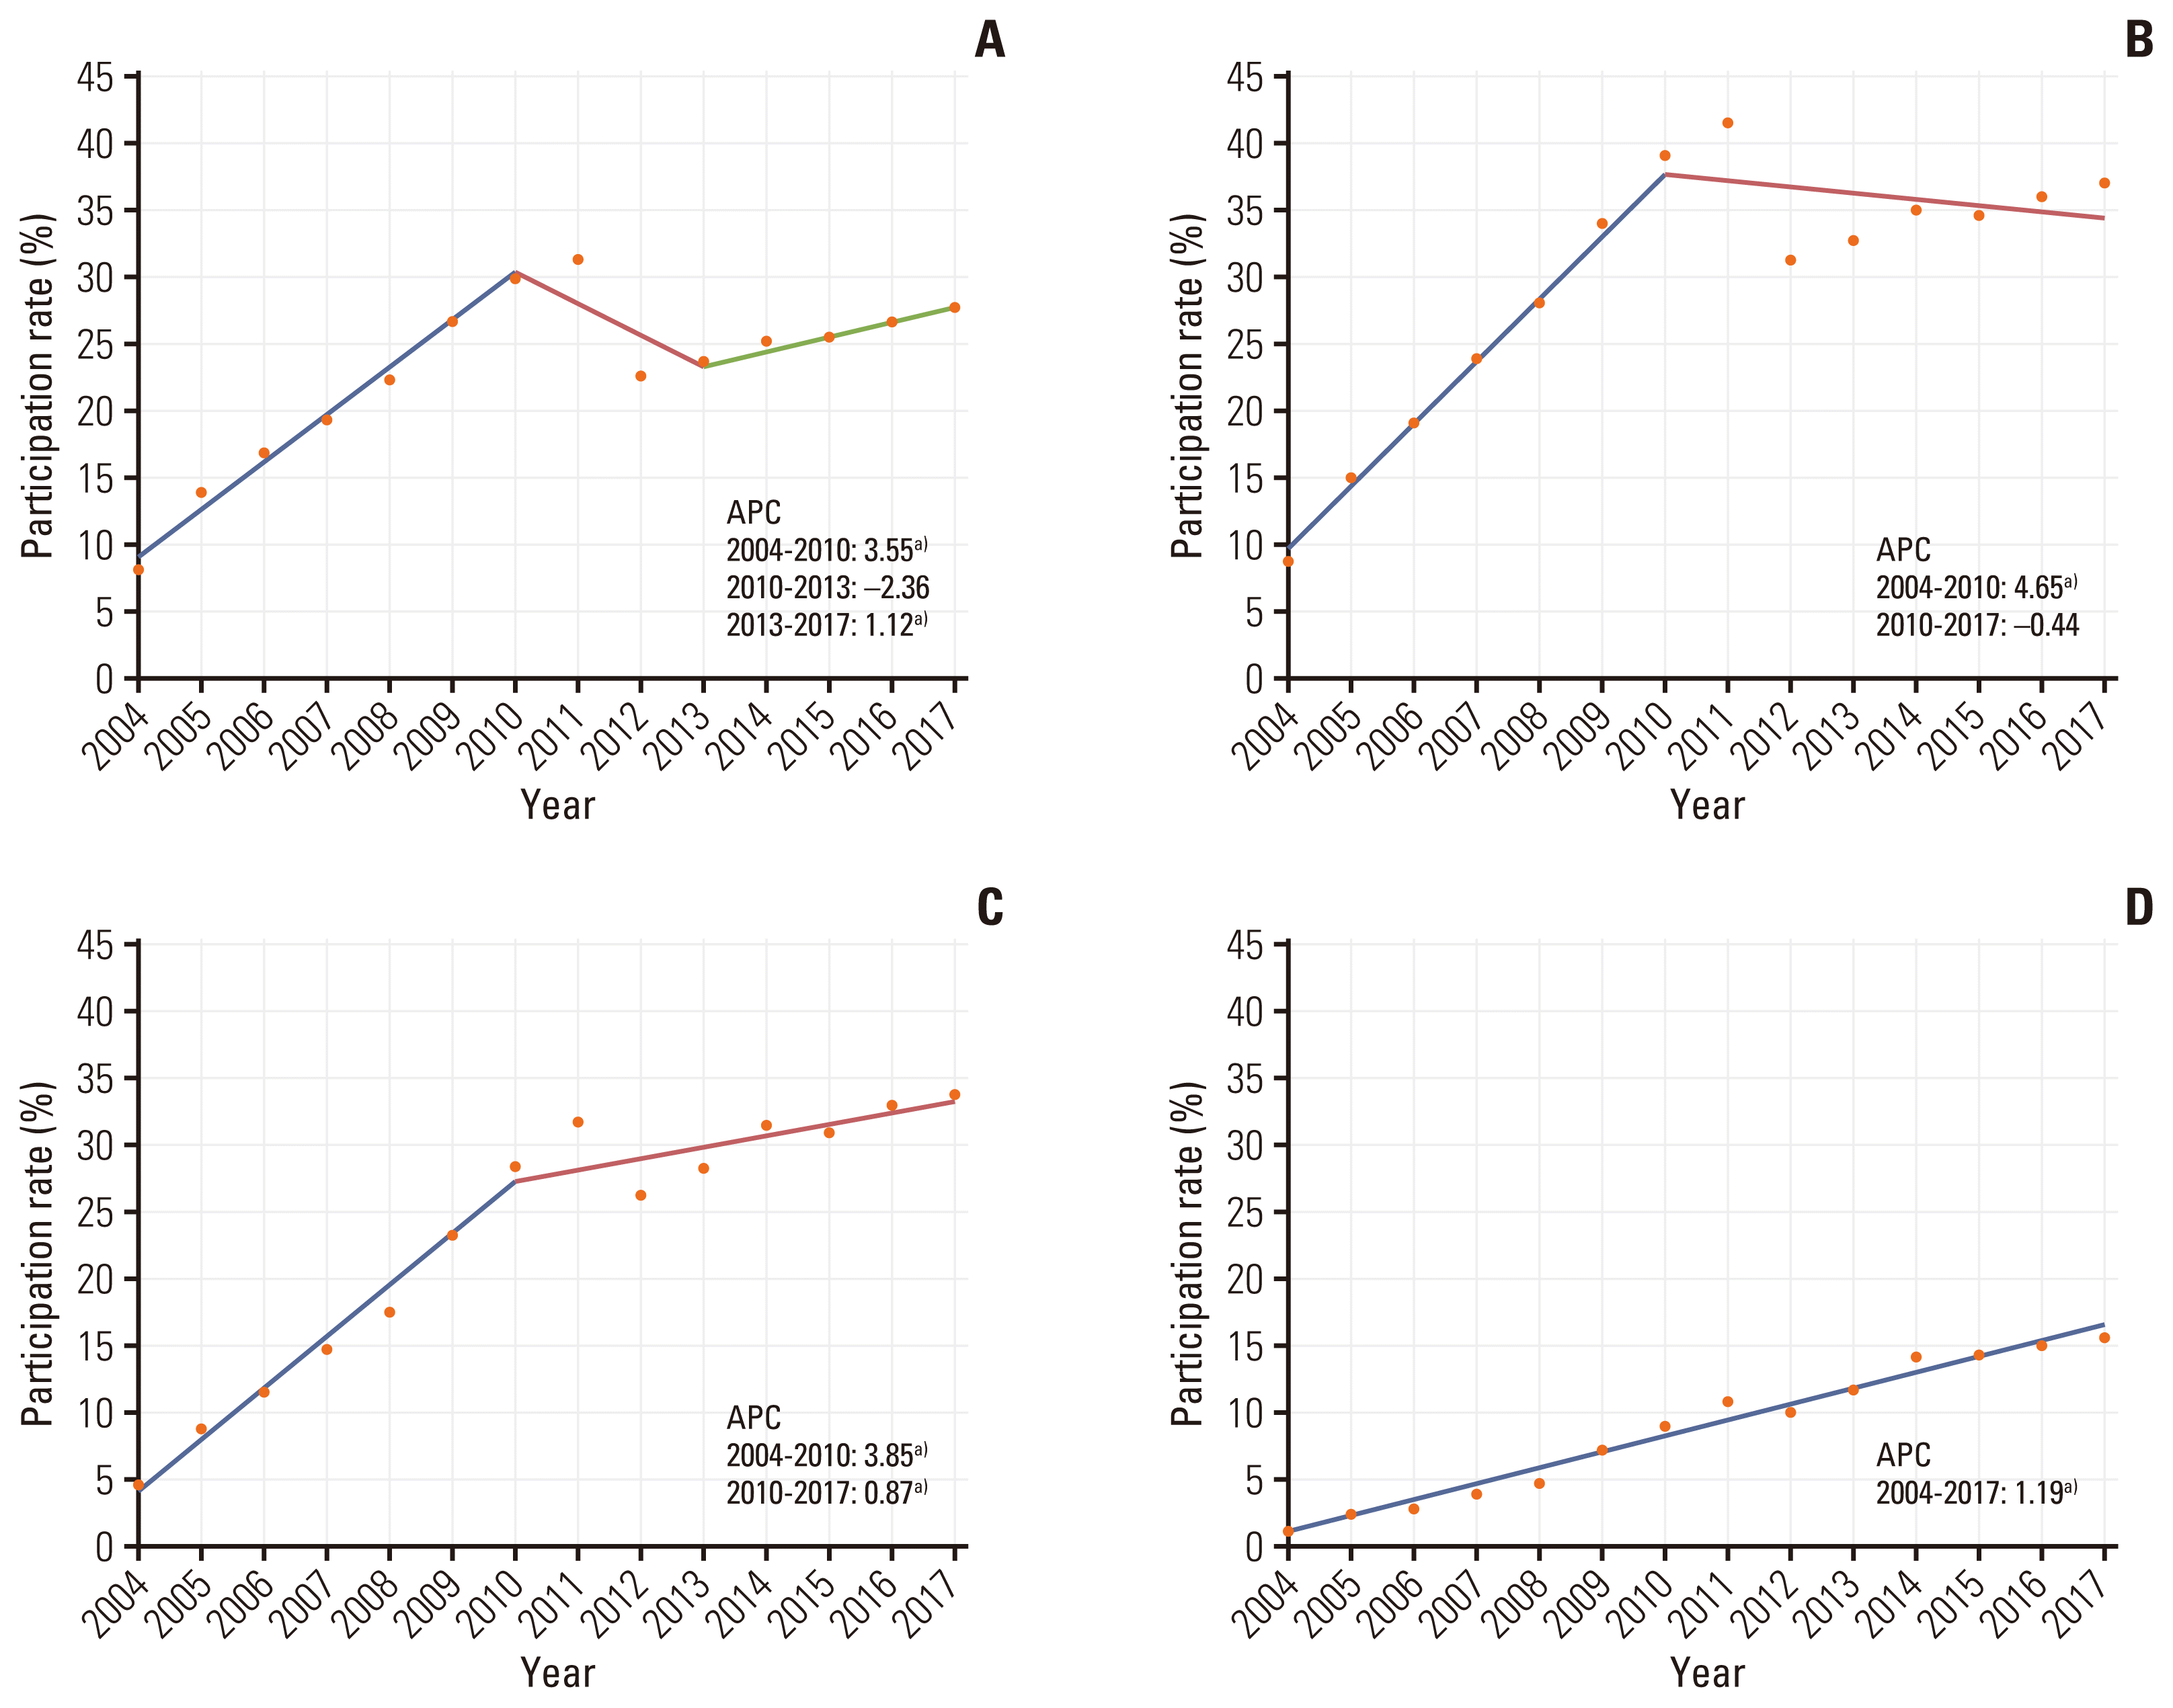
Fig. 3
Trends of participation rates from 2004 to 2017 in the National Cancer Screening Program for colorectal cancer by type of insurance. National Health Insurance Service beneficiaries of high-income status (A), National Health Insurance Service beneficiaries of low-income status (B), and Medical Aid Program recipients (C) annual percent change (APC). a)The slope is significantly different from zero at the alpha value of 0.05.
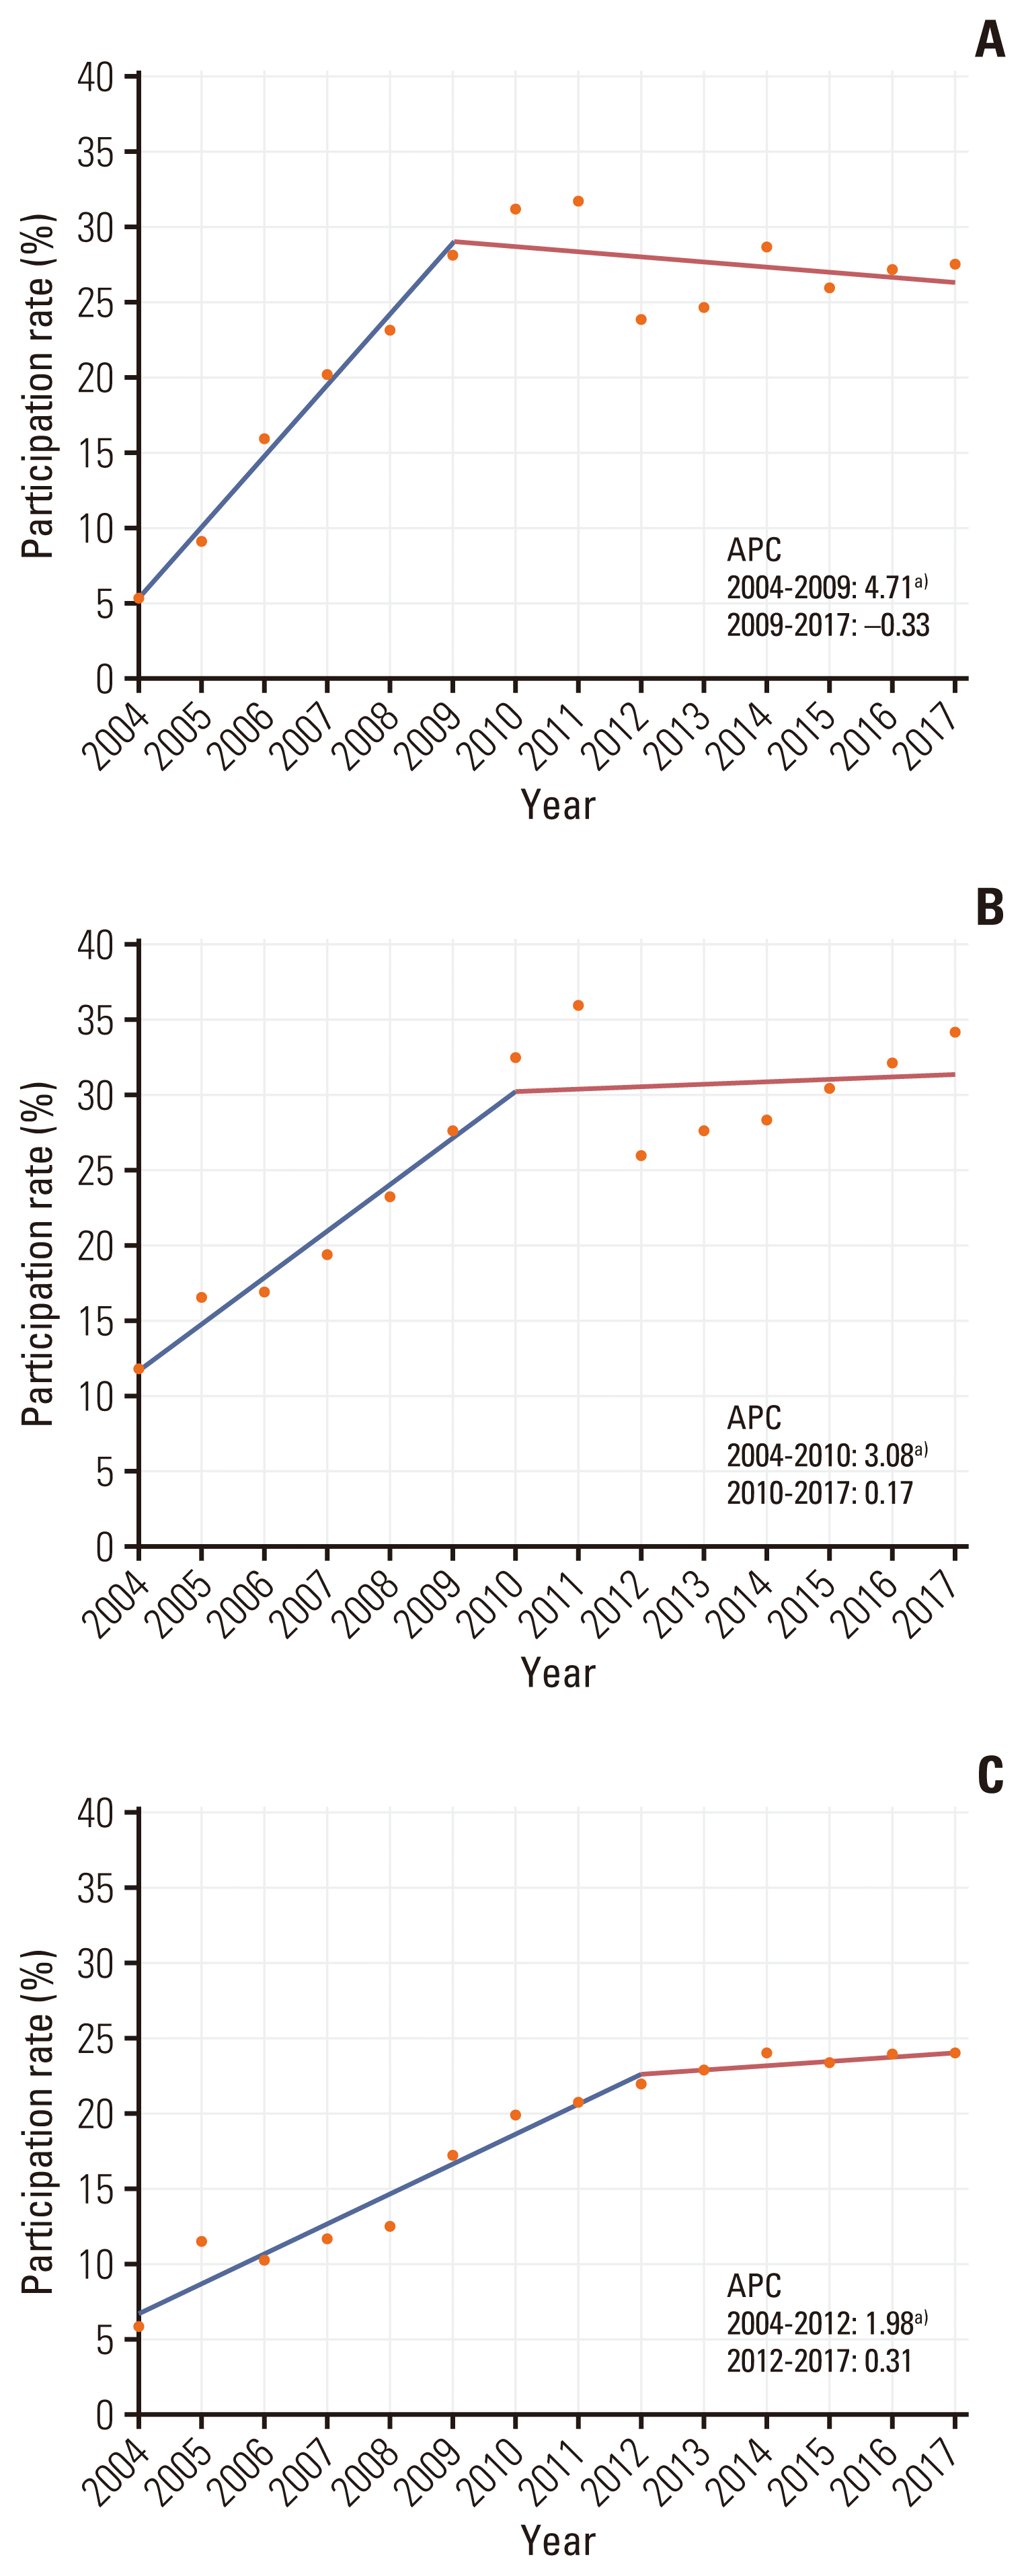
Fig. 4
Trends of follow-up rates from 2004 to 2017 in the National Cancer Screening Program for colorectal cancer. (A) Total, (B) by sex, (C) by age group, and (D) by type of insurance. The follow-up rate was calculated as follows: number of colonoscopies or double-contrast barium enema test performed/number of positive fecal immunochemical test results. MAP, Medical Aid Program; NHIS, National Health Insurance Service.
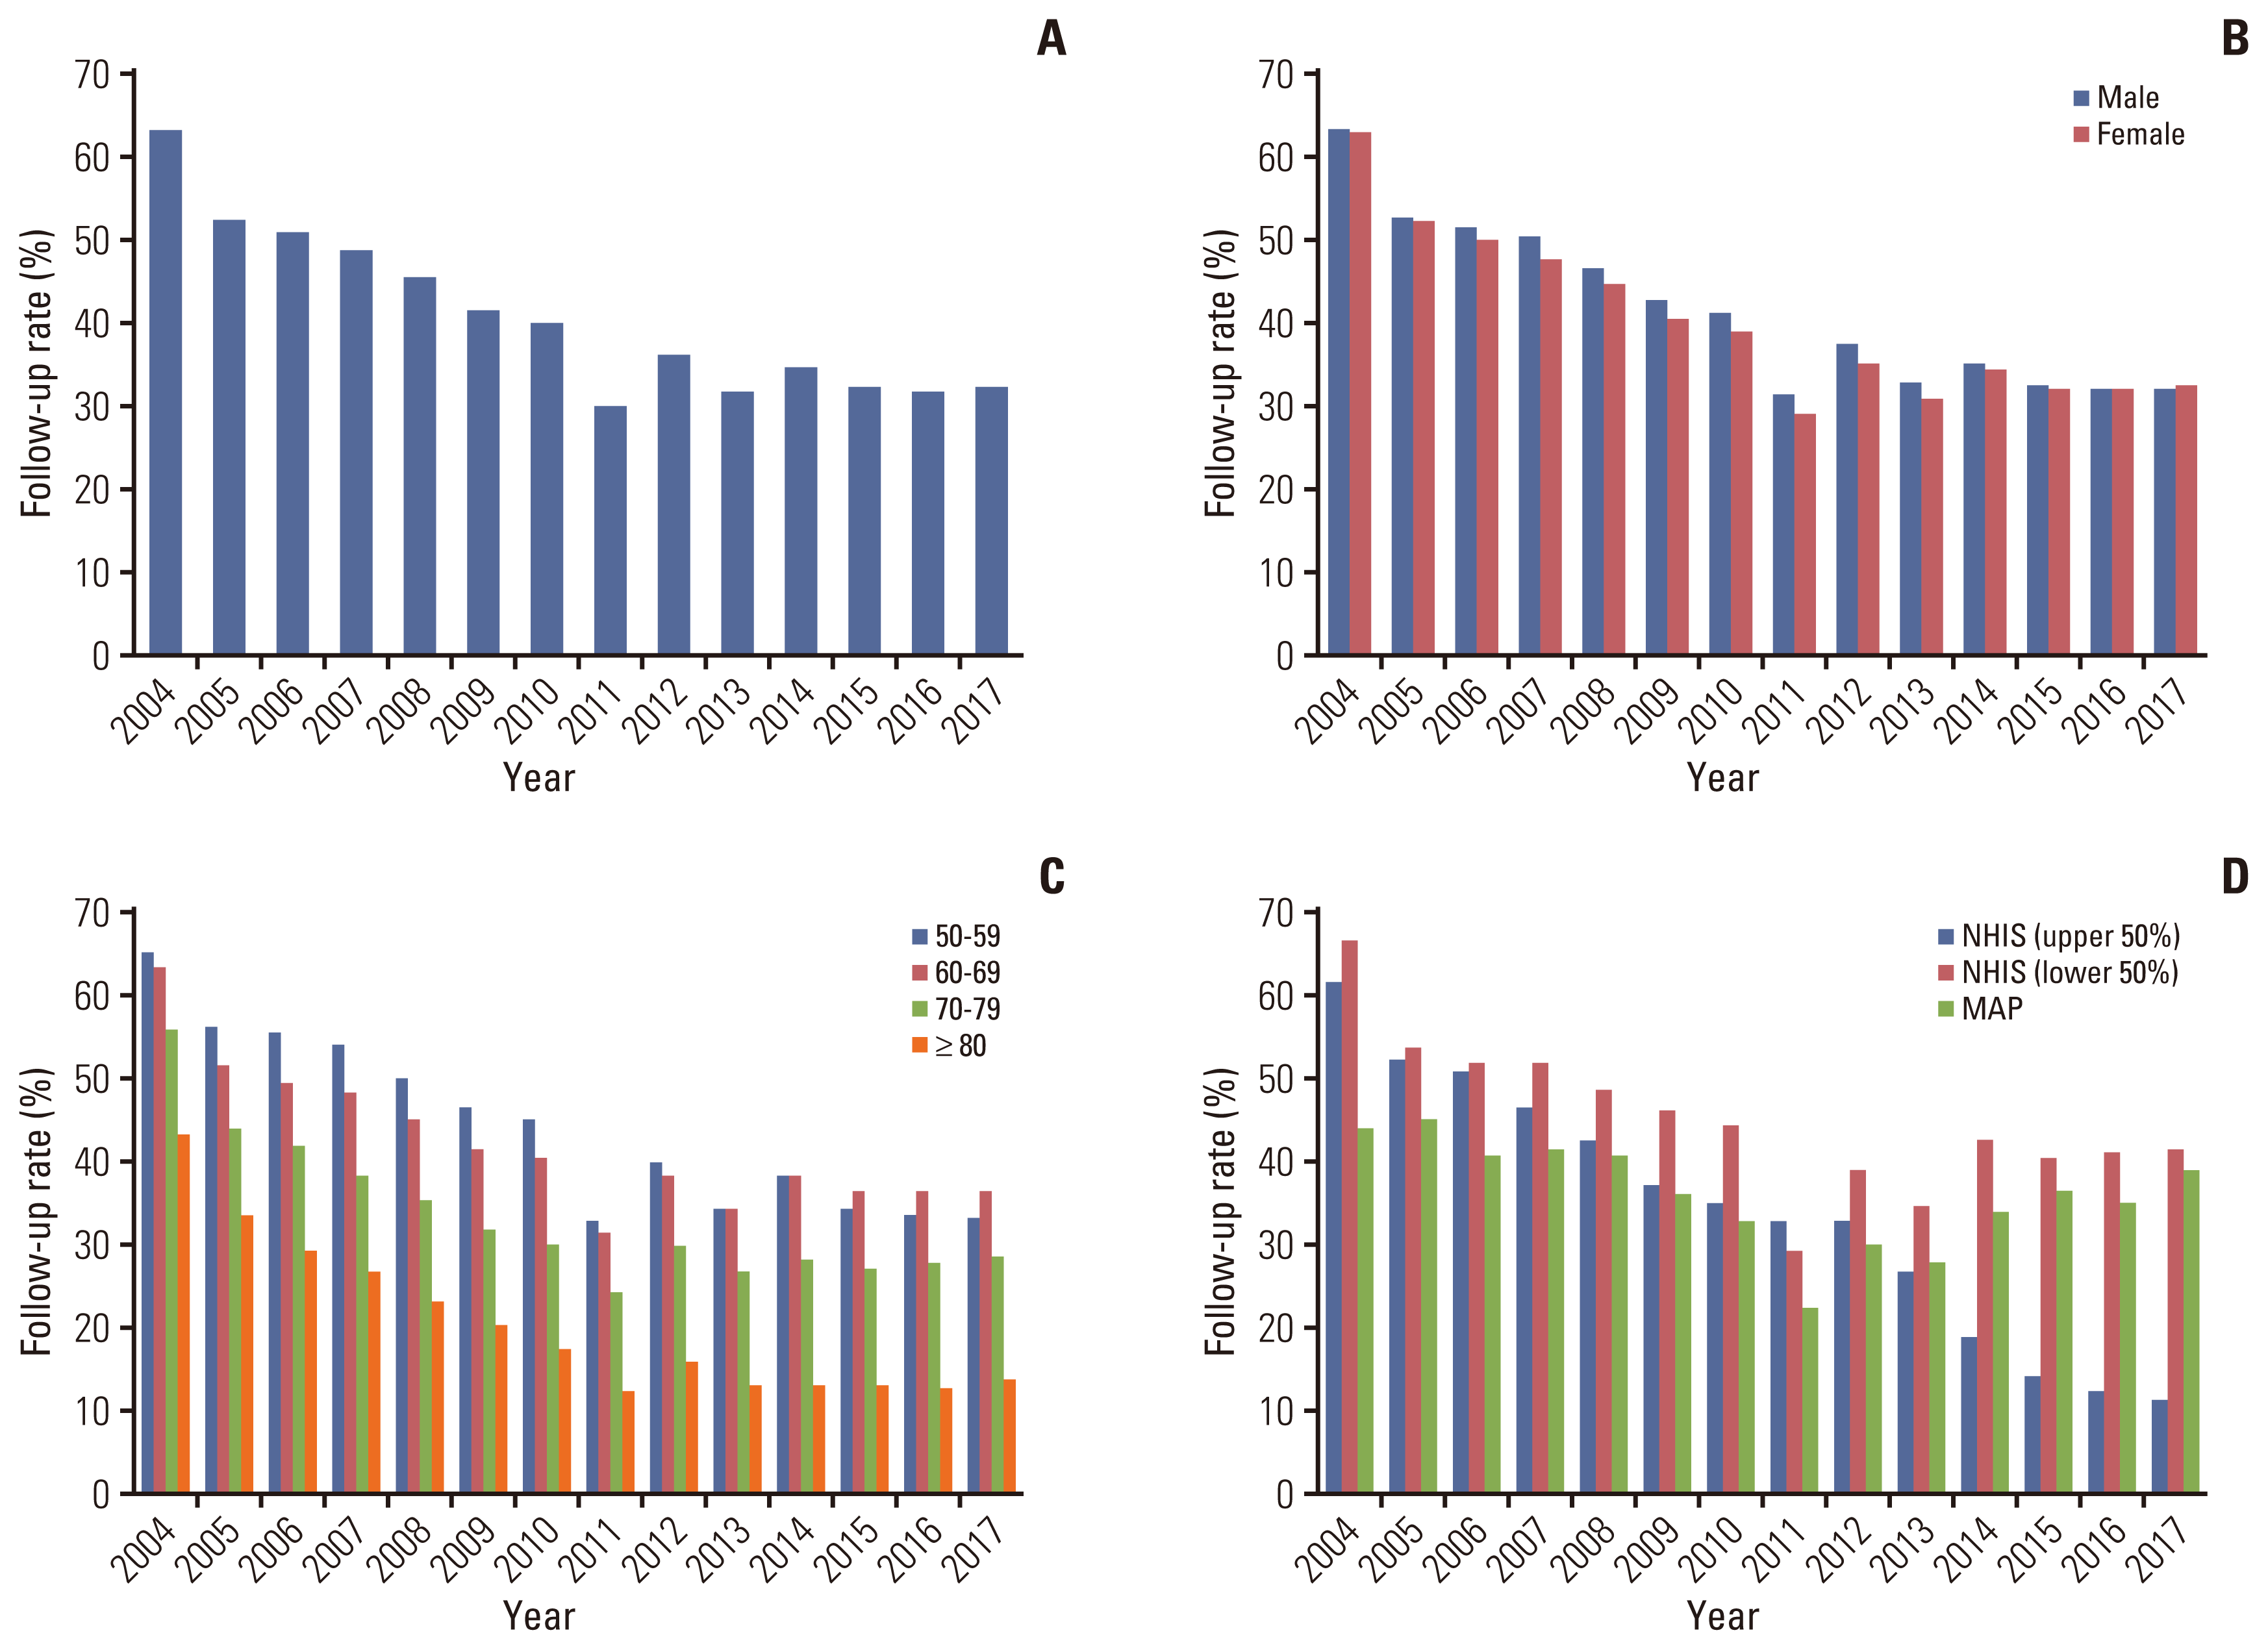
Fig. 5
Trends of follow-up testing performed by either colonoscopy or double-contrast barium enema (DCBE) test from 2004 to 2017 in the National Cancer Screening Program for colorectal cancer.
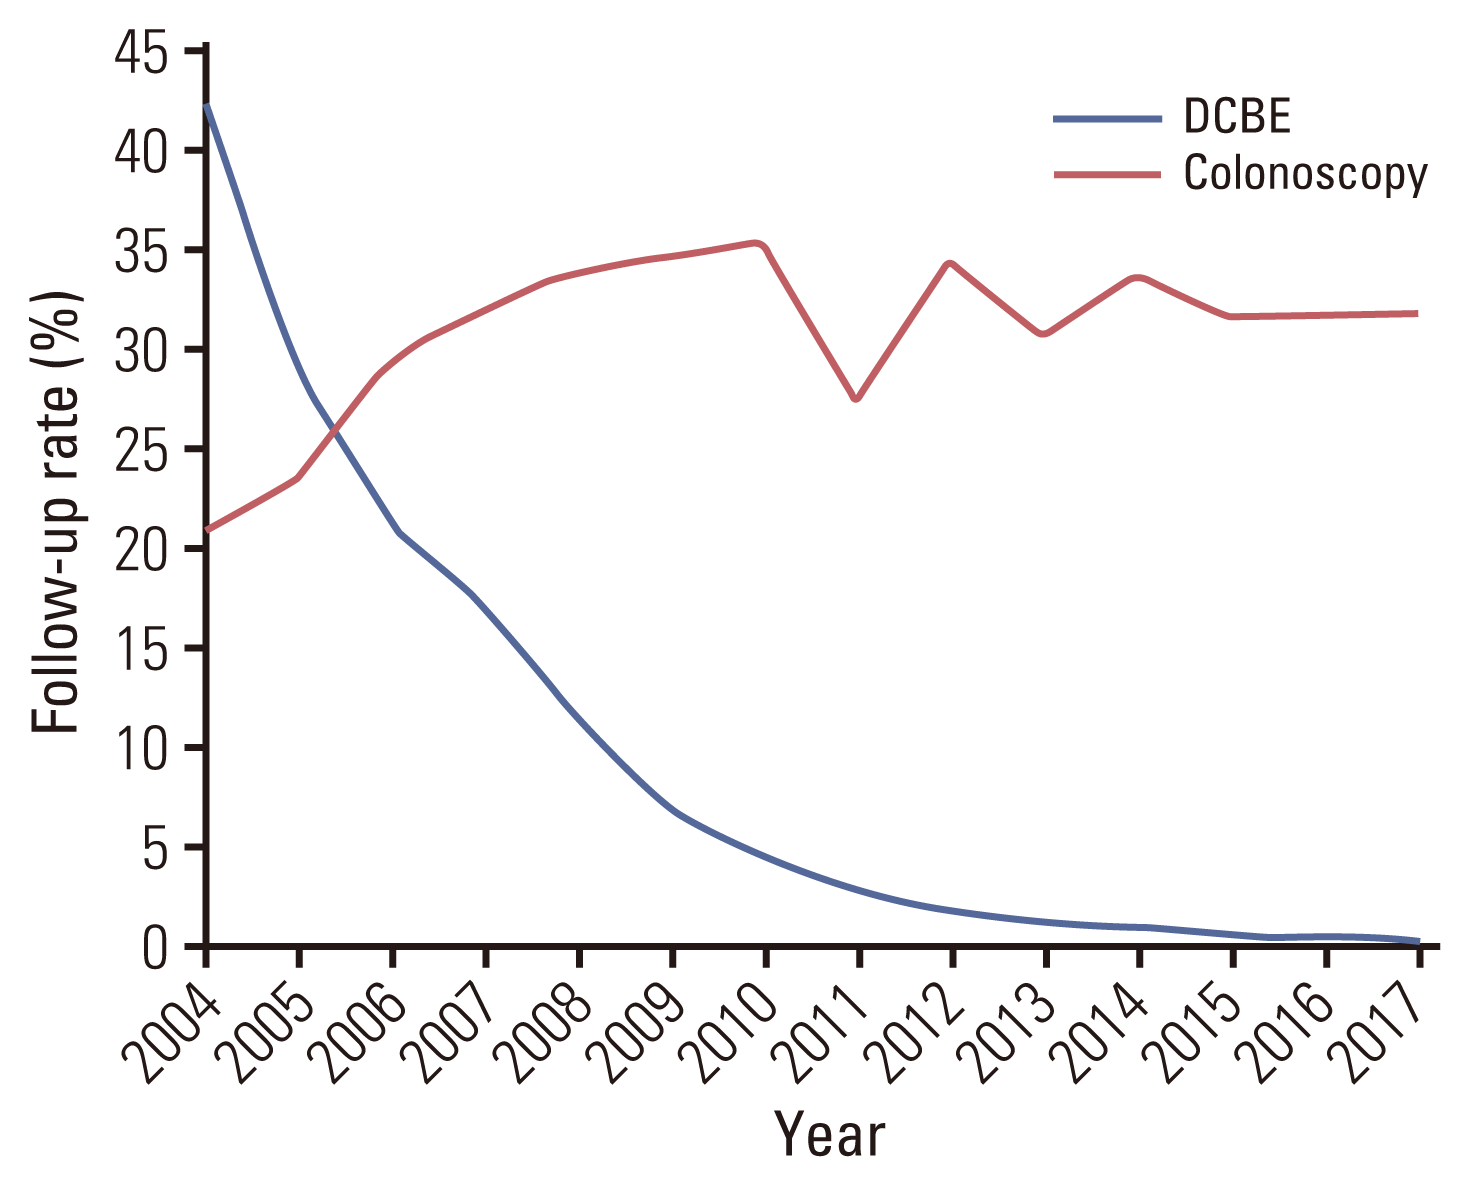
Table 1
Performance of fecal immunochemical test for colorectal cancer screening in Korea, 2004–2016
| 2004 | 2005 | 2006 | 2007 | 2008 | 2009 | 2010 | 2011 | 2012 | 2013 | 2014 | 2015 | 2016 | |
|---|---|---|---|---|---|---|---|---|---|---|---|---|---|
| Positivity ratea) | 7.7 | 7.6 | 7.6 | 7.6 | 6.6 | 5.9 | 6.0 | 5.8 | 5.2 | 5.3 | 5.2 | 5.3 | 4.5 |
| Cancer detection rateb) | 1.2 | 1.4 | 1.4 | 1.5 | 1.6 | 1.6 | 1.5 | 1.5 | 1.4 | 1.4 | 1.3 | 1.2 | 1.1 |
| Positive predictive valuea) | 1.6 | 1.8 | 1.9 | 2.2 | 2.4 | 2.7 | 2.6 | 2.6 | 2.6 | 2.5 | 2.4 | 2.3 | 2.4 |
| Sensitivitya) | 53.1 | 58.1 | 59.8 | 61.7 | 62.0 | 62.1 | 63.2 | 61.1 | 57.0 | 60.4 | 62.7 | 62.0 | 59.6 |
| Specificitya) | 92.4 | 92.5 | 92.5 | 93.1 | 93.6 | 94.3 | 94.2 | 94.3 | 94.9 | 94.8 | 94.9 | 94.8 | 95.6 |
| False-positive ratea) | 7.6 | 7.5 | 7.5 | 6.9 | 6.4 | 5.7 | 5.8 | 5.7 | 5.1 | 5.2 | 5.1 | 5.2 | 4.4 |
| Interval colorectal cancerc) | 1.2 | 1.1 | 1.0 | 1.0 | 1.0 | 1.0 | 0.9 | 1.0 | 1.1 | 0.9 | 0.8 | 0.8 | 0.8 |


 PDF
PDF Citation
 Print
Print


 XML Download