Introduction
Materials and Methods
1. Study patients
2. Procedure
3. Diagnostic standards
4. Statistical analyses
Results
1. Baseline characteristics
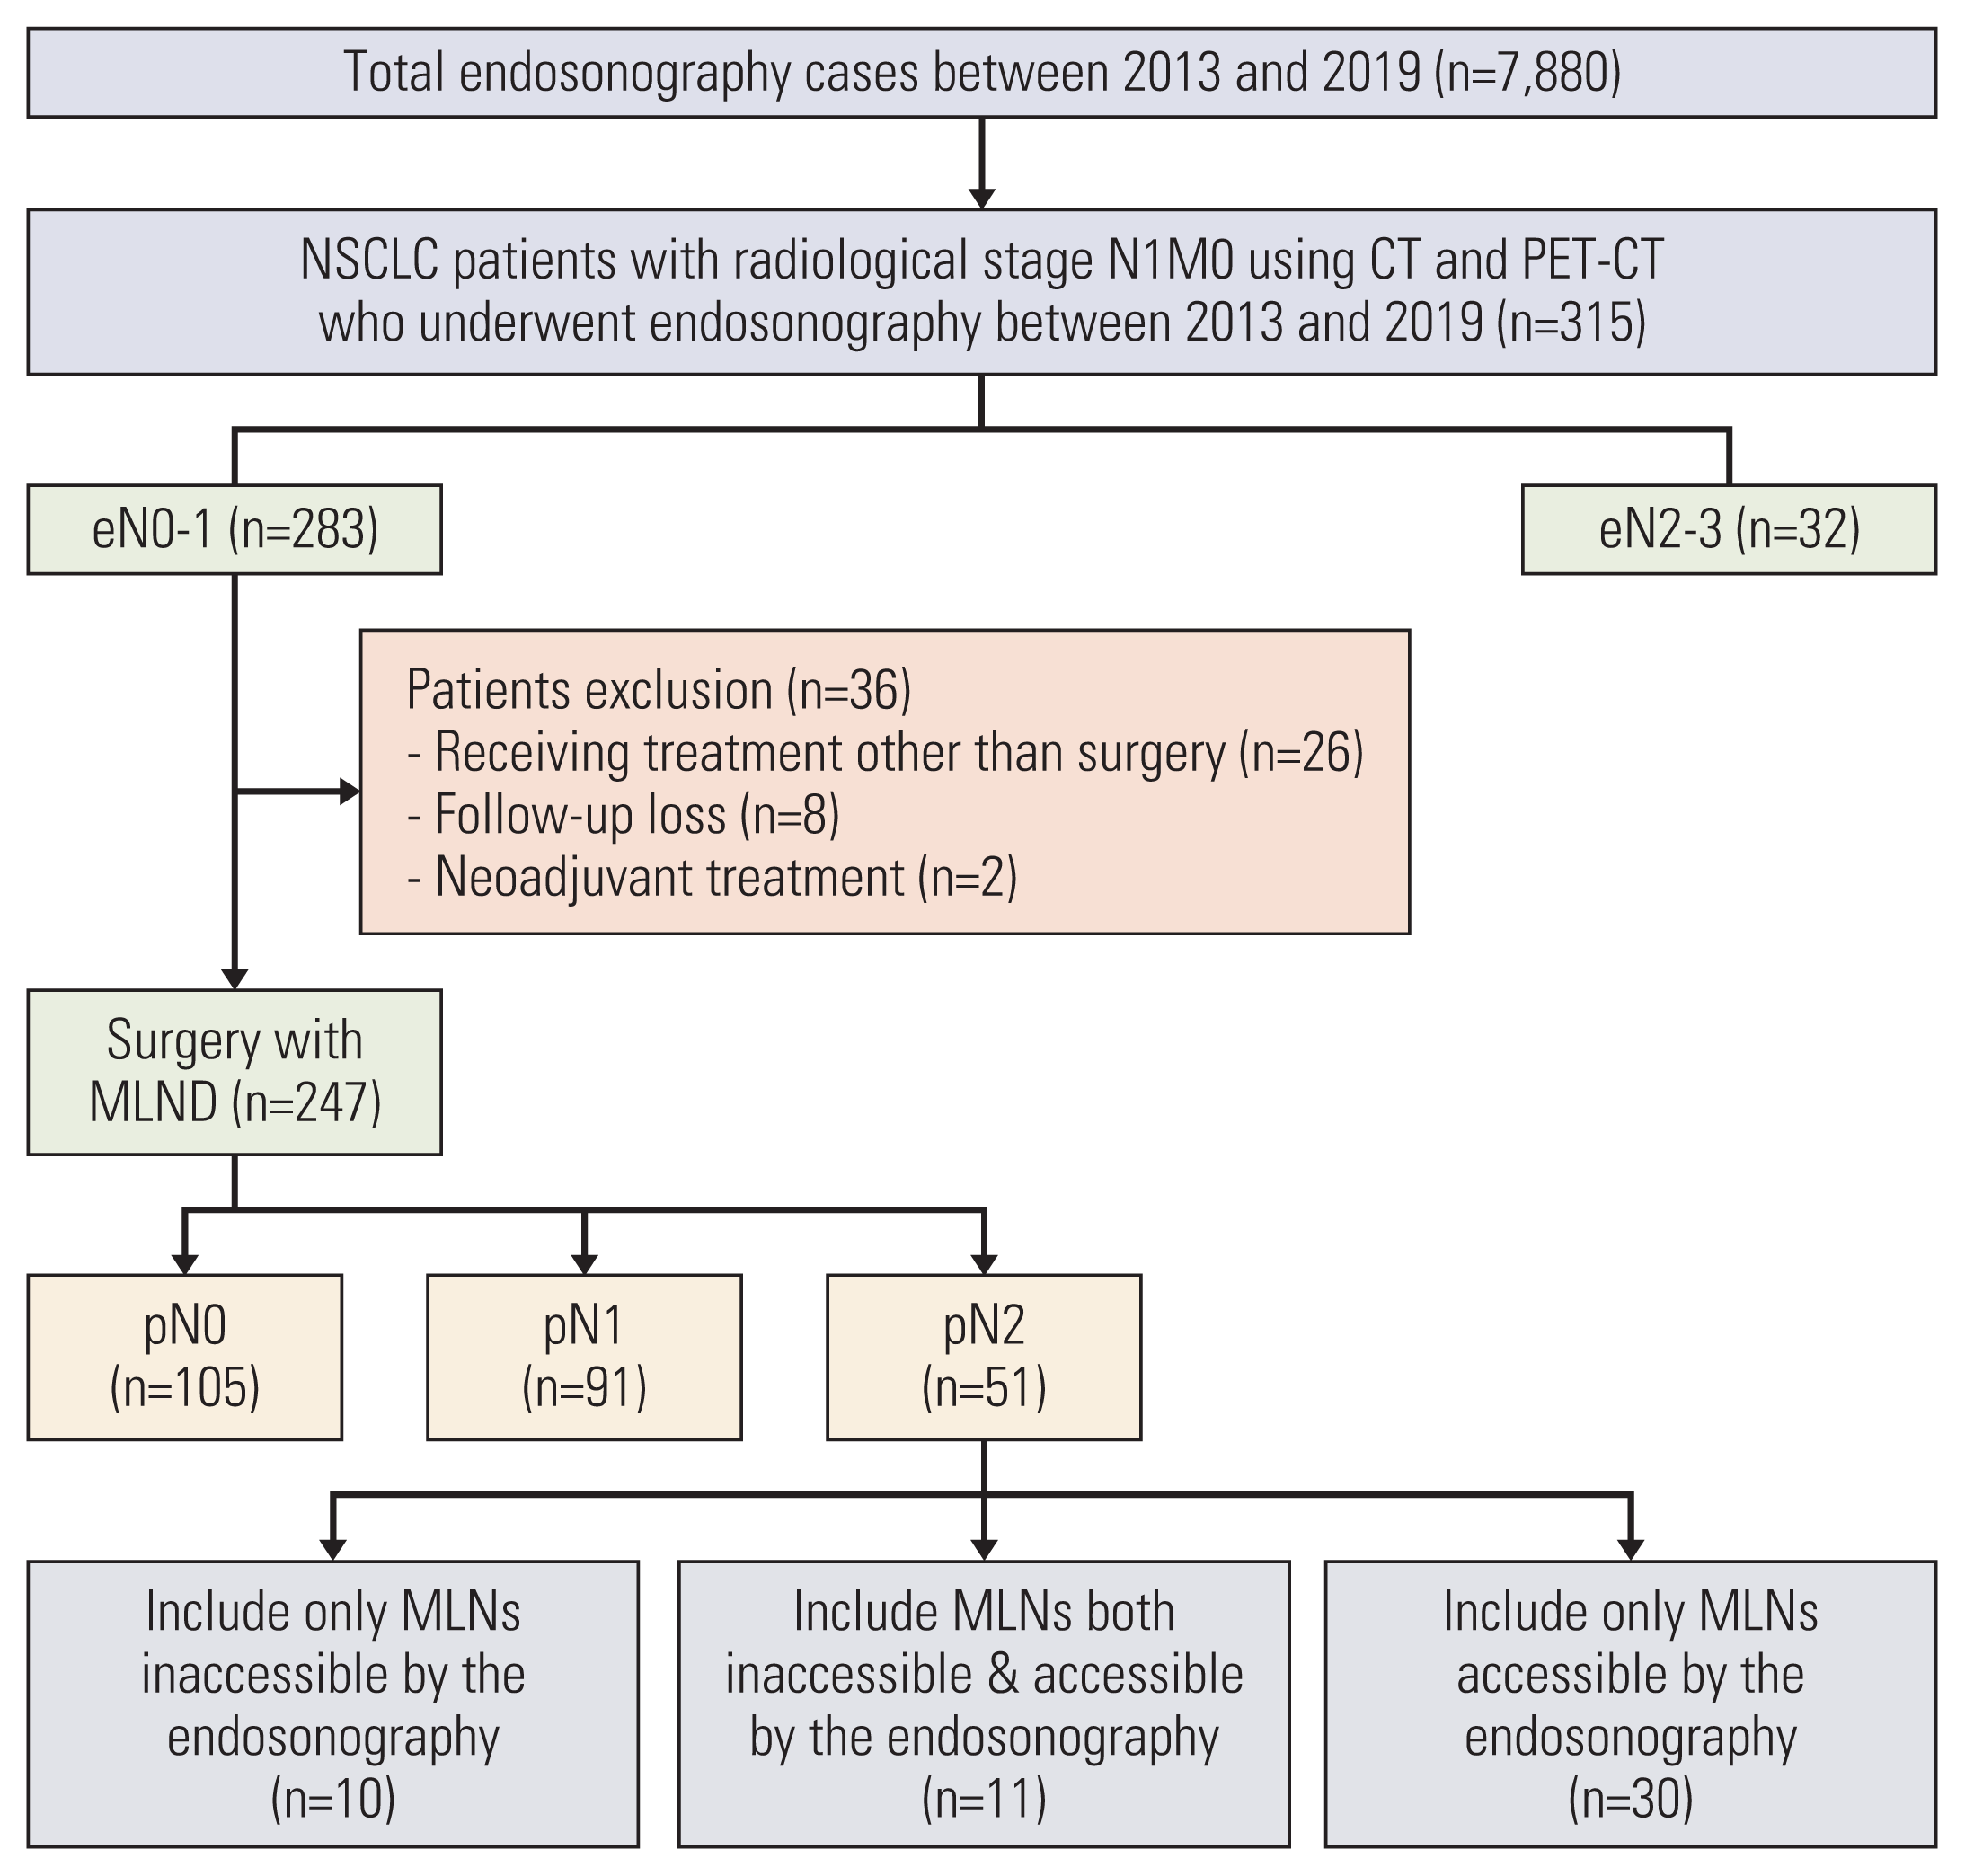
Fig. 1

Table 1
| Variable | No. (%) (n=315) |
|---|---|
| Male sex | 234 (74.3) |
| Age (yr), median (IQR) | 66 (60–73) |
| Smoking status | |
| Never | 85 (27.0) |
| Ex-smoker | 129 (41.0) |
| Current | 101 (32.1) |
| Pulmonary comorbidity | |
| COPD/Asthma | 46 (14.6) |
| History of pulmonary TB | 36 (11.4) |
| Interstitial lung disease | 18 (5.7) |
| Bronchiectasis | 4 (1.3) |
| NTM | 4 (1.3) |
| Tumor diameter in CT (mm) | 37 (27–49) |
| Radiological T categorya) | |
| T1a | 1 (0.3) |
| T1b | 30 (9.5) |
| T1c | 55 (17.5) |
| T2a | 71 (22.5) |
| T2b | 55 (17.5) |
| T3 | 70 (22.2) |
| T4 | 33 (10.5) |
| Lobar locationa) | |
| RUL | 86 (27.3) |
| RML | 17 (5.4) |
| RLL | 73 (23.2) |
| LUL | 66 (21.0) |
| LLL | 73 (23.2) |
| Synchronous lung cancer, yes | 10 (3.2) |
| Spatial location | |
| Central | 168 (53.3) |
| Peripheral | 147 (46.7) |
| Tumor attenuation on CT | |
| Solid | 289 (91.7) |
| Part-solid | 26 (8.3) |
| Histologic type | |
| Adenocarcinoma | 182 (57.8) |
| Squamous cell carcinoma | 122 (38.7) |
| Otherb) | 11 (3.5) |
| Characteristics of N1 node | |
| Met CT criteriac) only | 9 (2.9) |
| Met PET-CT criteriad) only | 122 (38.7) |
| Met both CT & PET-CT criteria | 184 (58.4) |
COPD, chronic obstructive pulmonary disease; CT, computed tomography; IQR, interquartile range; LLL, left lower lobe; LUL, left upper lobe; NSCLC, non–small cell lung cancer; NTM, non-tuberculous mycobacteria; PET-CT, positron emission tomography integrated with computed tomography; RLL, right lower lobe; RML, right middle lobe; RUL, right upper lobe; TB, tuberculosis.
a) In the case of synchronous lung cancer, the T category and lobar location of the main lesion were indicated,
2. Diagnostic performance of endosonography
Table 2
AUC ROC was calculated as 0.69 (95% CI, 0.62 to 0.77). Endosonographic results were non-diagnostic in three lymph nodes (two patients). They underwent surgical resection for lung cancer with mediastinal lymph node dissection and were finally confirmed as pN2 negative. AUC ROC, area under the receiver operating curve; CI, confidence interval; NSCLC, non–small cell lung cancer.
3. Factors associated with MLN metastases
Table 3
| Variable | Univariable analysis | Multivariable analysis | ||
|---|---|---|---|---|
|
|
|
|||
| OR (95% CI) | p-value | OR (95% CI) | p-value | |
| Age ≤ 65 yr | 1.31 (0.78–2.19) | 0.303 | - | - |
|
|
||||
| Female sex | 1.75 (1.00–3.06) | 0.050 | - | - |
|
|
||||
| Pulmonary comorbidity, yes | 0.68 (0.37–1.26) | 0.217 | - | - |
|
|
||||
| Tumor location, central | 1.80 (1.07–3.04) | 0.028 | 2.05 (1.15–3.68) | 0.016 |
|
|
||||
| Tumor diameter > 3 cm | 0.86 (0.51–1.46) | 0.577 | - | - |
|
|
||||
| Tumor attenuation, solid | 11.44 (1.52–86.05) | 0.018 | 10.24 (1.32–79.49) | 0.026 |
|
|
||||
| Tumor histology, adenocarcinoma | 1.92 (1.10–3.35) | 0.022 | 3.01 (1.63–5.55) | < 0.001 |
|
|
||||
| Characteristics of N1 node | ||||
|
|
||||
| Met CT criteriaa) only or PET-CT criteriab) only | Reference | - | - | |
|
|
||||
| Met both CT & PET-CT criteria | 1.98 (1.15–3.40) | 0.014 | 1.72 (0.97–3.05) | 0.062 |
Table 4
Except for the AUC ROC, data are reported as percentages with actual numbers over the total in parentheses. AUC ROC, area under the receiver operating curve; CI, confidence interval; N/A, not available; NPV, negative predictive value; NSCLC, non–small cell lung cancer; PPV, positive predictive value.


 PDF
PDF Citation
 Print
Print


 XML Download