Introduction
Materials and Methods
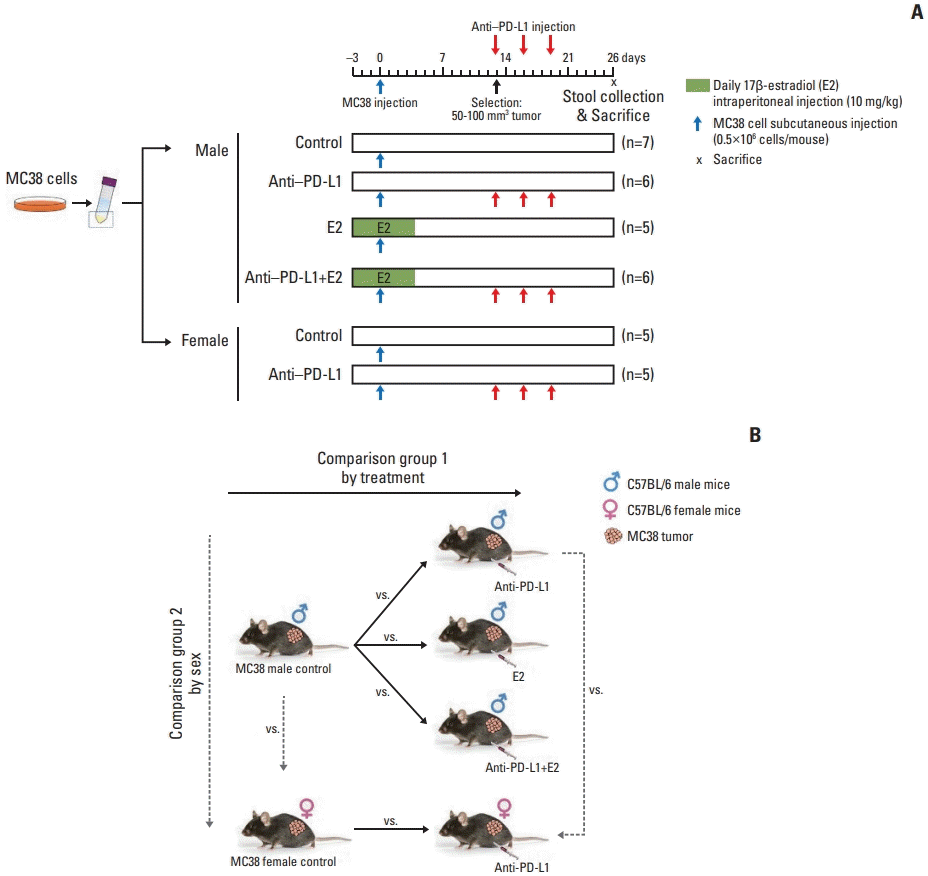 | Fig. 1Experimental design to evaluate the effects of anti–PD-L1 antibody and/or E2 on gut microbiome in the MC38 colon tumor mouse model. (A) Experimental design. A total of 5×10⁵ MC38 cells resuspended in 100 μL DPBS were injected subcutaneously into the right flank of 8-week-old C57BL/6 male mice. E2 (10 mg/kg) was intraperitoneally administered daily for 1 week from 3 days before injection of MC38 cells. Male and female mice bearing tumors (50–100 mm3) were selected and anti–PD-L1 or isotype control antibody was administered intraperitoneally at a dose of 10 mg/kg every 3 days for a total of three injections. Mice were sacrificed at day 26 after injection of MC38 cells. (B) Data analysis scheme. Investigation of changes in the gut microbiome composition according to treatment by comparing the gut microbiome in the MC38 males in the following groups: male control, anti–PD-L1–treated males, E2-treated males, males co-treated with anti–PD-L1 and E2. This analysis was used to examine the effect of anti–PD-L1 and/or E2 on the gut microbiome composition. Furthermore, sex-specific differences in the gut microbiome composition were analyzed by comparing the gut microbiome between male and female mice in the following groups: male control and female control, and anti–PD-L1 treated male and female groups. Based on this analysis, sex-specific changes in the gut microbiome composition were examined in MC38 colon tumor model. DPBS, Dulbecco’s phosphate-buffered saline; E2, 17β-estradiol; PD-L1, programmed death-ligand 1. |
1. Reagents
2. MC38 cell culture
3. Mouse housing condition
4. Establishment of a syngeneic MC38 colon tumor mouse model and fecal DNA extraction
5. Metagenome sequencing
6. Data processing and analysis
7. Gut microbial diversity analysis
8. Determination of anti–PD-L1 and/or E2-specific and sex-specific gut microbiome
9. Statistical analysis
10. Data availability
Results
1. Changes in microbial composition following anti–PD-L1 and/or E2 supplementation in MC38 colon cancer mice
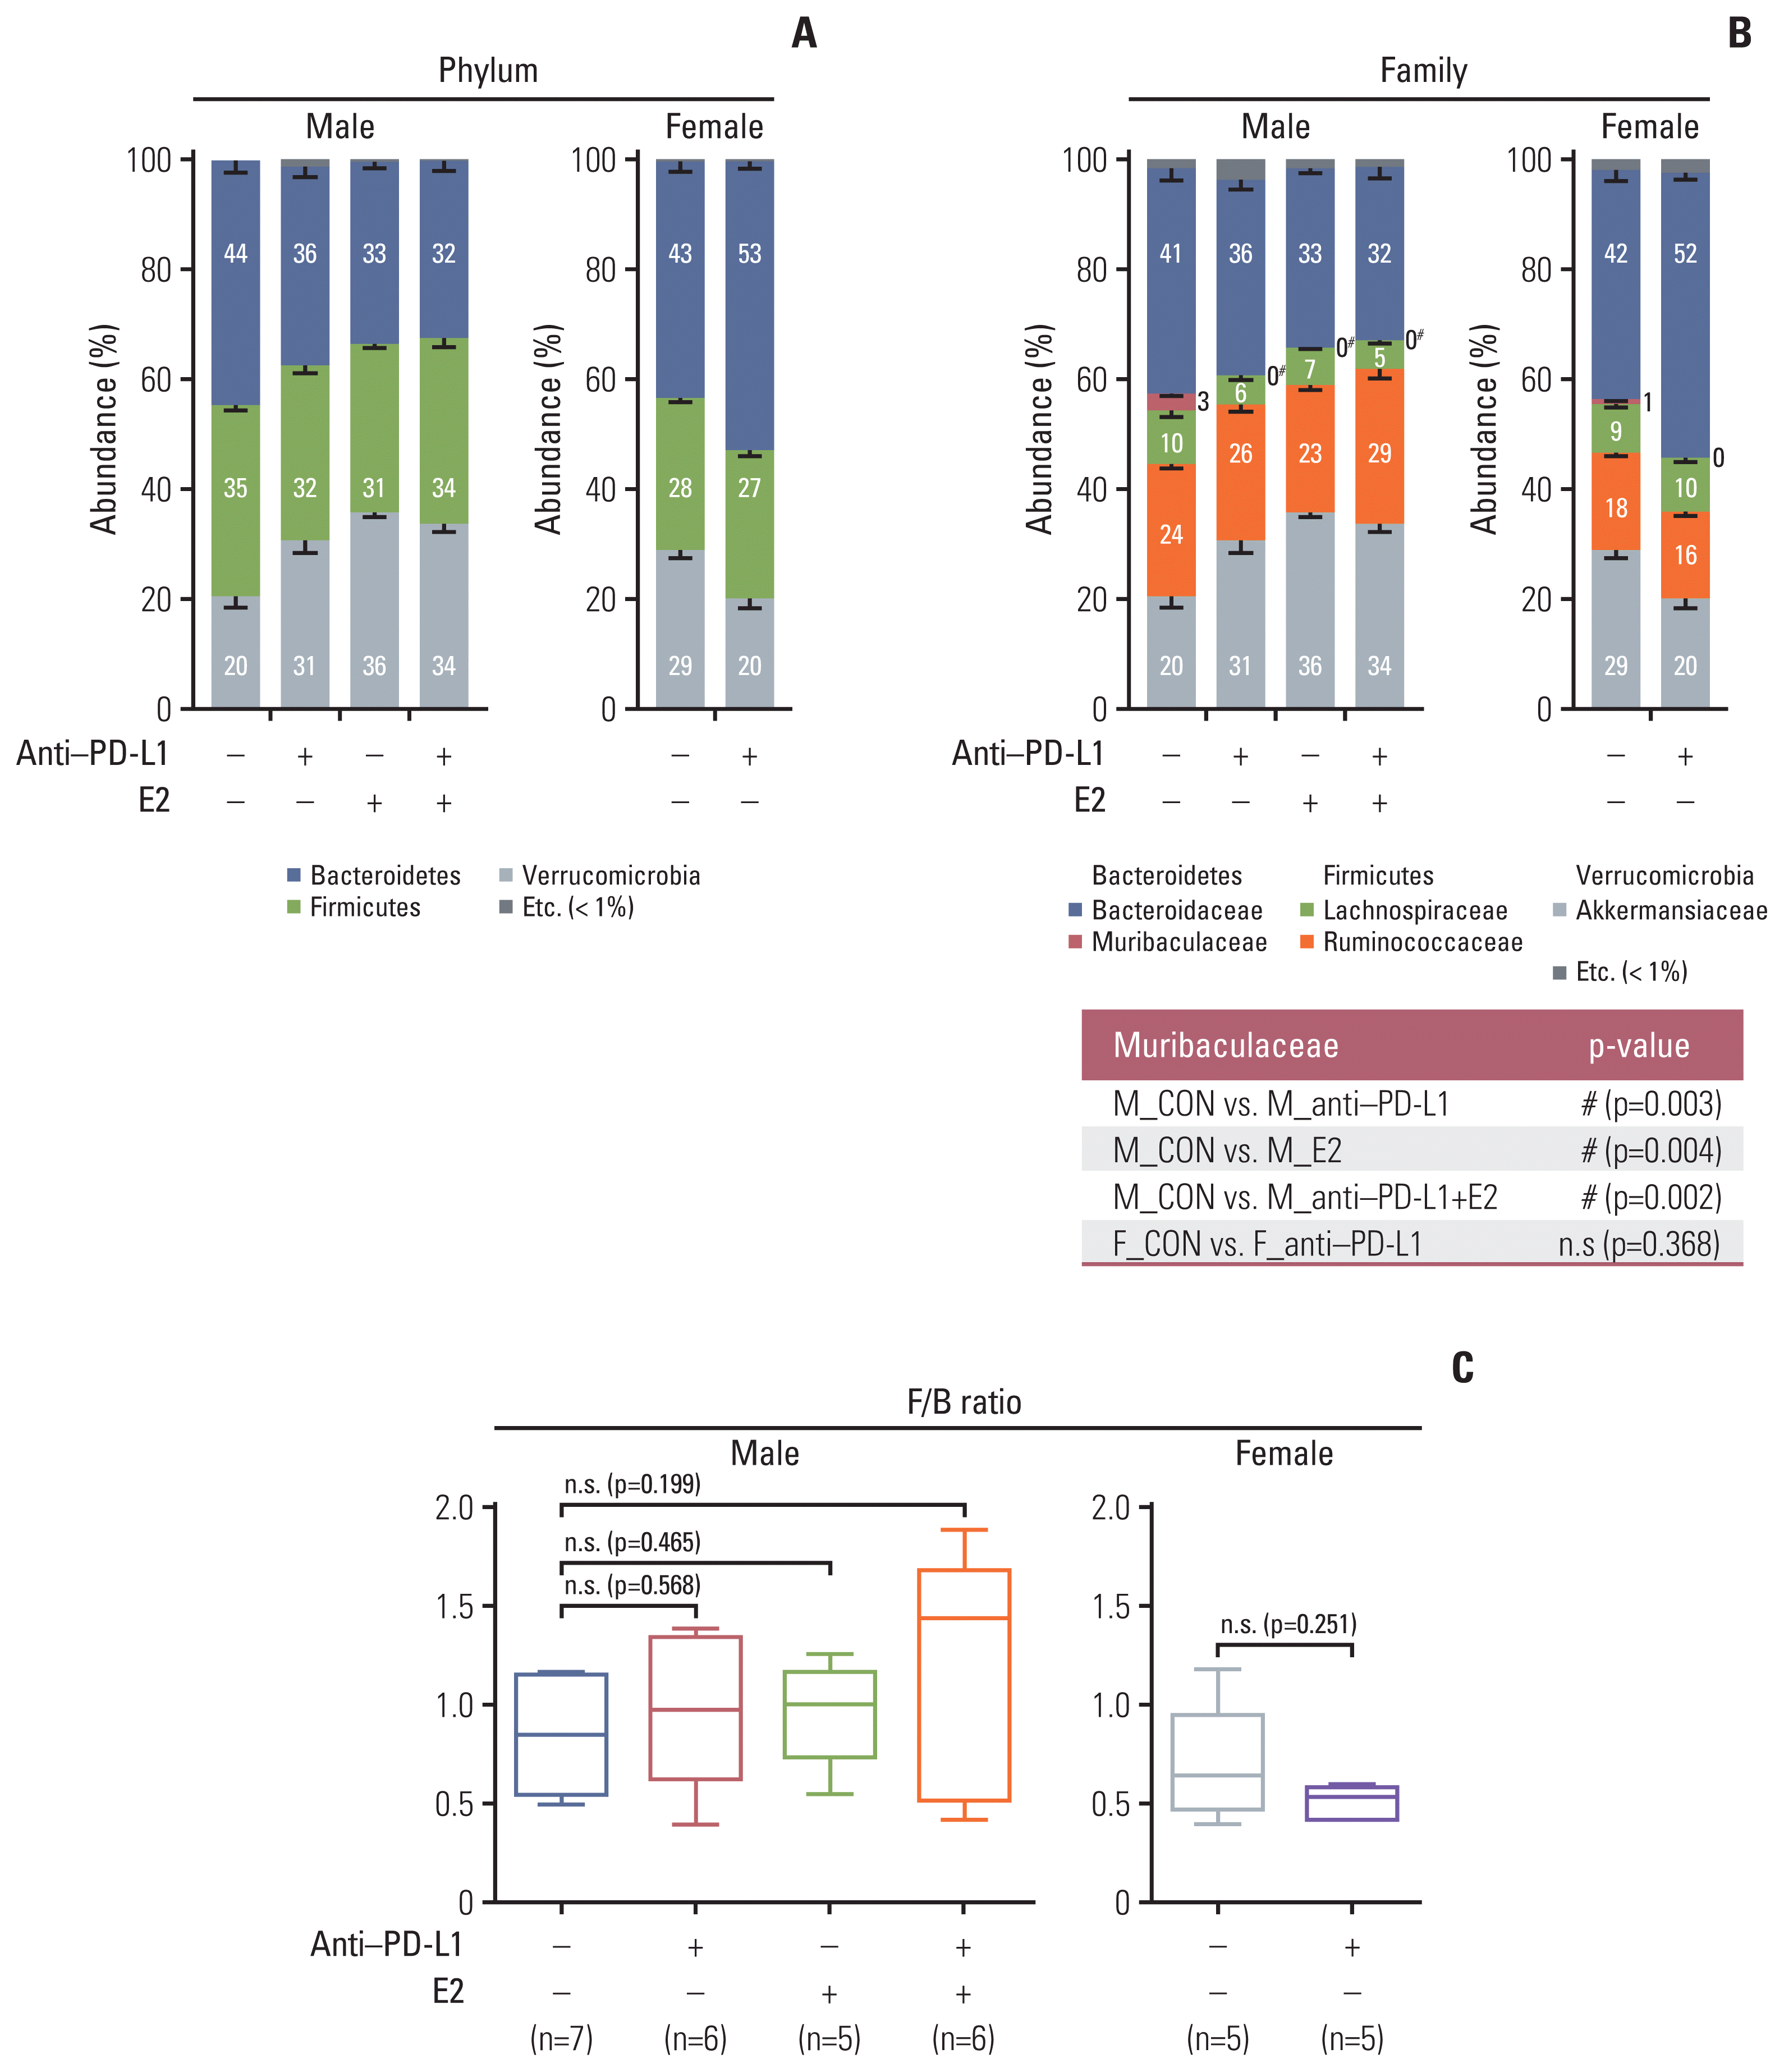 | Fig. 2Taxonomic composition. (A) Gut microbiota compositions at the phylum level in MC38 male (left) and female (right) groups. (B) Gut microbiota compositions at the family level in MC38 males (left) and females (right). Mann-Whitney U test was used for comparison of differences between two independent groups. The p-value for Muribaculaceae, which showed significance in the comparison between groups, is presented as a table under the figure. #p < 0.05, male control vs. anti–PD-L1–treated male, male control vs. E2-treated male, and male control vs. male co-treated with anti–PD-L1 and E2. (C) F/B ratio in MC38 males and females. Data are expressed as the mean±SEM. Whiskers show the minimum and maximum values. The p-values were calculated using the Mann-Whitney U test for comparison difference between independent two groups. E2, 17β-estradiol; F/B, Firmicutes/Bacteroidetes; n.s., not significant; PD-L1, programmed death-ligand 1; SEM, standard error of the mean. |
2. Effect of anti–PD-L1 and/or E2 on individual bacterial communities in MC38 colon cancer mice
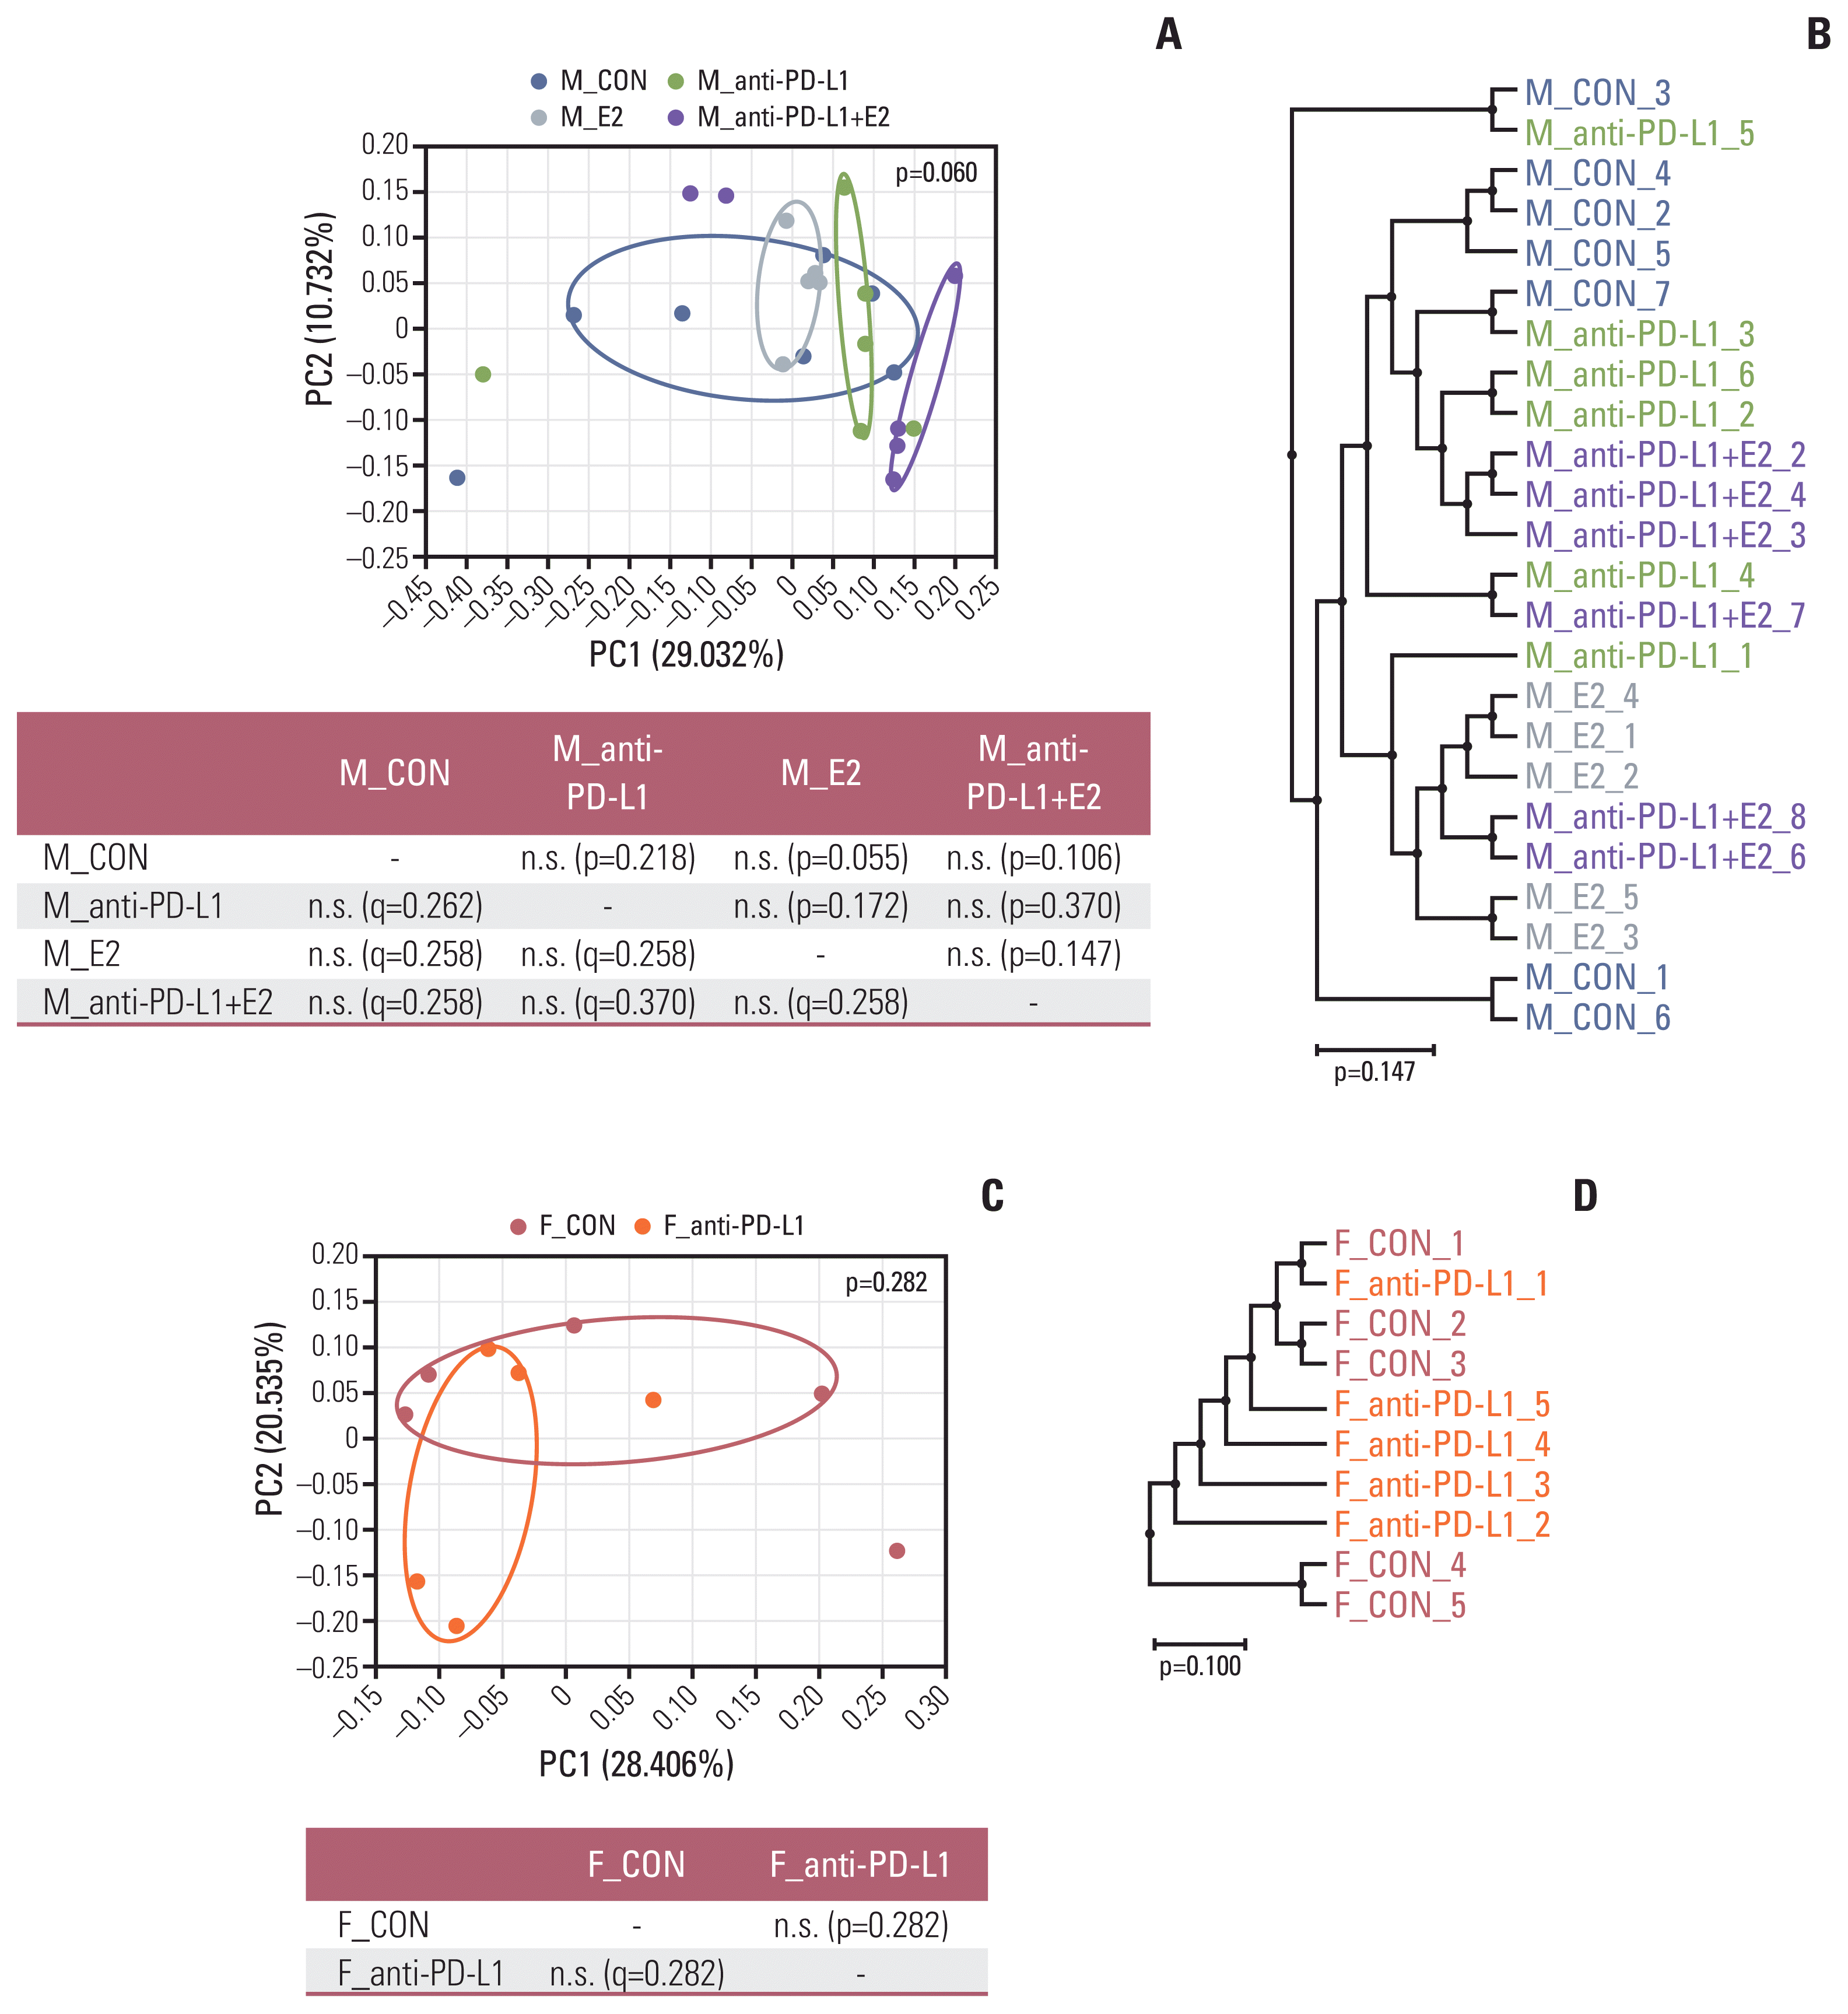 | Fig. 3Beta diversity of gut microbiota. (A, B) Sample clustering using UniFrac-based PCoA and UPGMA tree at the species level in MC38 male groups. (C, D) Sample clustering using UniFrac-based PCoA and UPGMA tree at the species level in MC38 female groups. MC38 male and female samples were clustered using the Generalized UniFrac method at the species level. Significance of similarity of bacterial population structure was analyzed using PERMANOVA. The clustering and phylogenetic tree of each group are marked with a different color: M_CON, blue; M_anti-PD-L1, green; M_E2, grey; M_anti-PD-L1+E2, purple; F_CON, red; F_anti-PD-L1, orange color. CON, control; E2, 17β-estradiol; F, female; M, male; PCoA, principal coordinates analysis; PD-L1, programmed death-ligand 1; PERMANOMA, permutational multivariate analysis of variance; UPGMA, unweighted pair group method with arithmetic mean. |
3. Identification of anti–PD-L1 or E2-specific microbiota in MC38 colon cancer mice
 | Fig. 4Identification of specific gut microbiome for anti–PD-L1 and/or E2 in MC38 colon tumor model. (A–D) LEfSe analysis. Bar plots of the LEfSe results, which were obtained based on the following criteria: (1) alpha value for the factorial Kruskal-Wallis test among classes < 0.05; (2) the alpha value for the pairwise Wilcoxon test between subclasses < 0.05; (3) threshold on the logarithmic LDA score for discriminative features < 2.0; and (4) a multi-class analysis set as all-against-all. Bacterial characteristics were classified as “commensal bacteria,” “opportunistic pathogens” and “uncharacterized” according to previous reports. The color bars show the LDA score (log10) of species that enriched in indicated conditions; (A–C) blue bar (male control), (A) block bar (anti–PD-L1–treated male), (B) green bar (E2-treated male), (C) purple bar (male co-treated with anti–PD-L1 and E2), (D) red bar (female control), gray bar (anti–PD-L1–treated female). The color on the species name indicates the characteristics of each species: yellow for commensal bacteria, orange for opportunistic pathogens, and no color for not characterized bacteria. (E, F) Venn diagrams based on LEfSe data. (E) Identification of bacteria exhibiting changes after anti–PD-L1 and/or E2 treatment in MC38 male mice. (F) Identification of bacteria exhibiting common changes after anti–PD-L1 treatment in MC38 male and female mice. CON, control; E2, 17β-estradiol; F, female; LDA, linear discriminant analysis; LEfSe, LDA effect size; M, male; PD-L1, programmed death-ligand 1. |
4. Sex effect on microbial composition in MC38 colon cancer mice
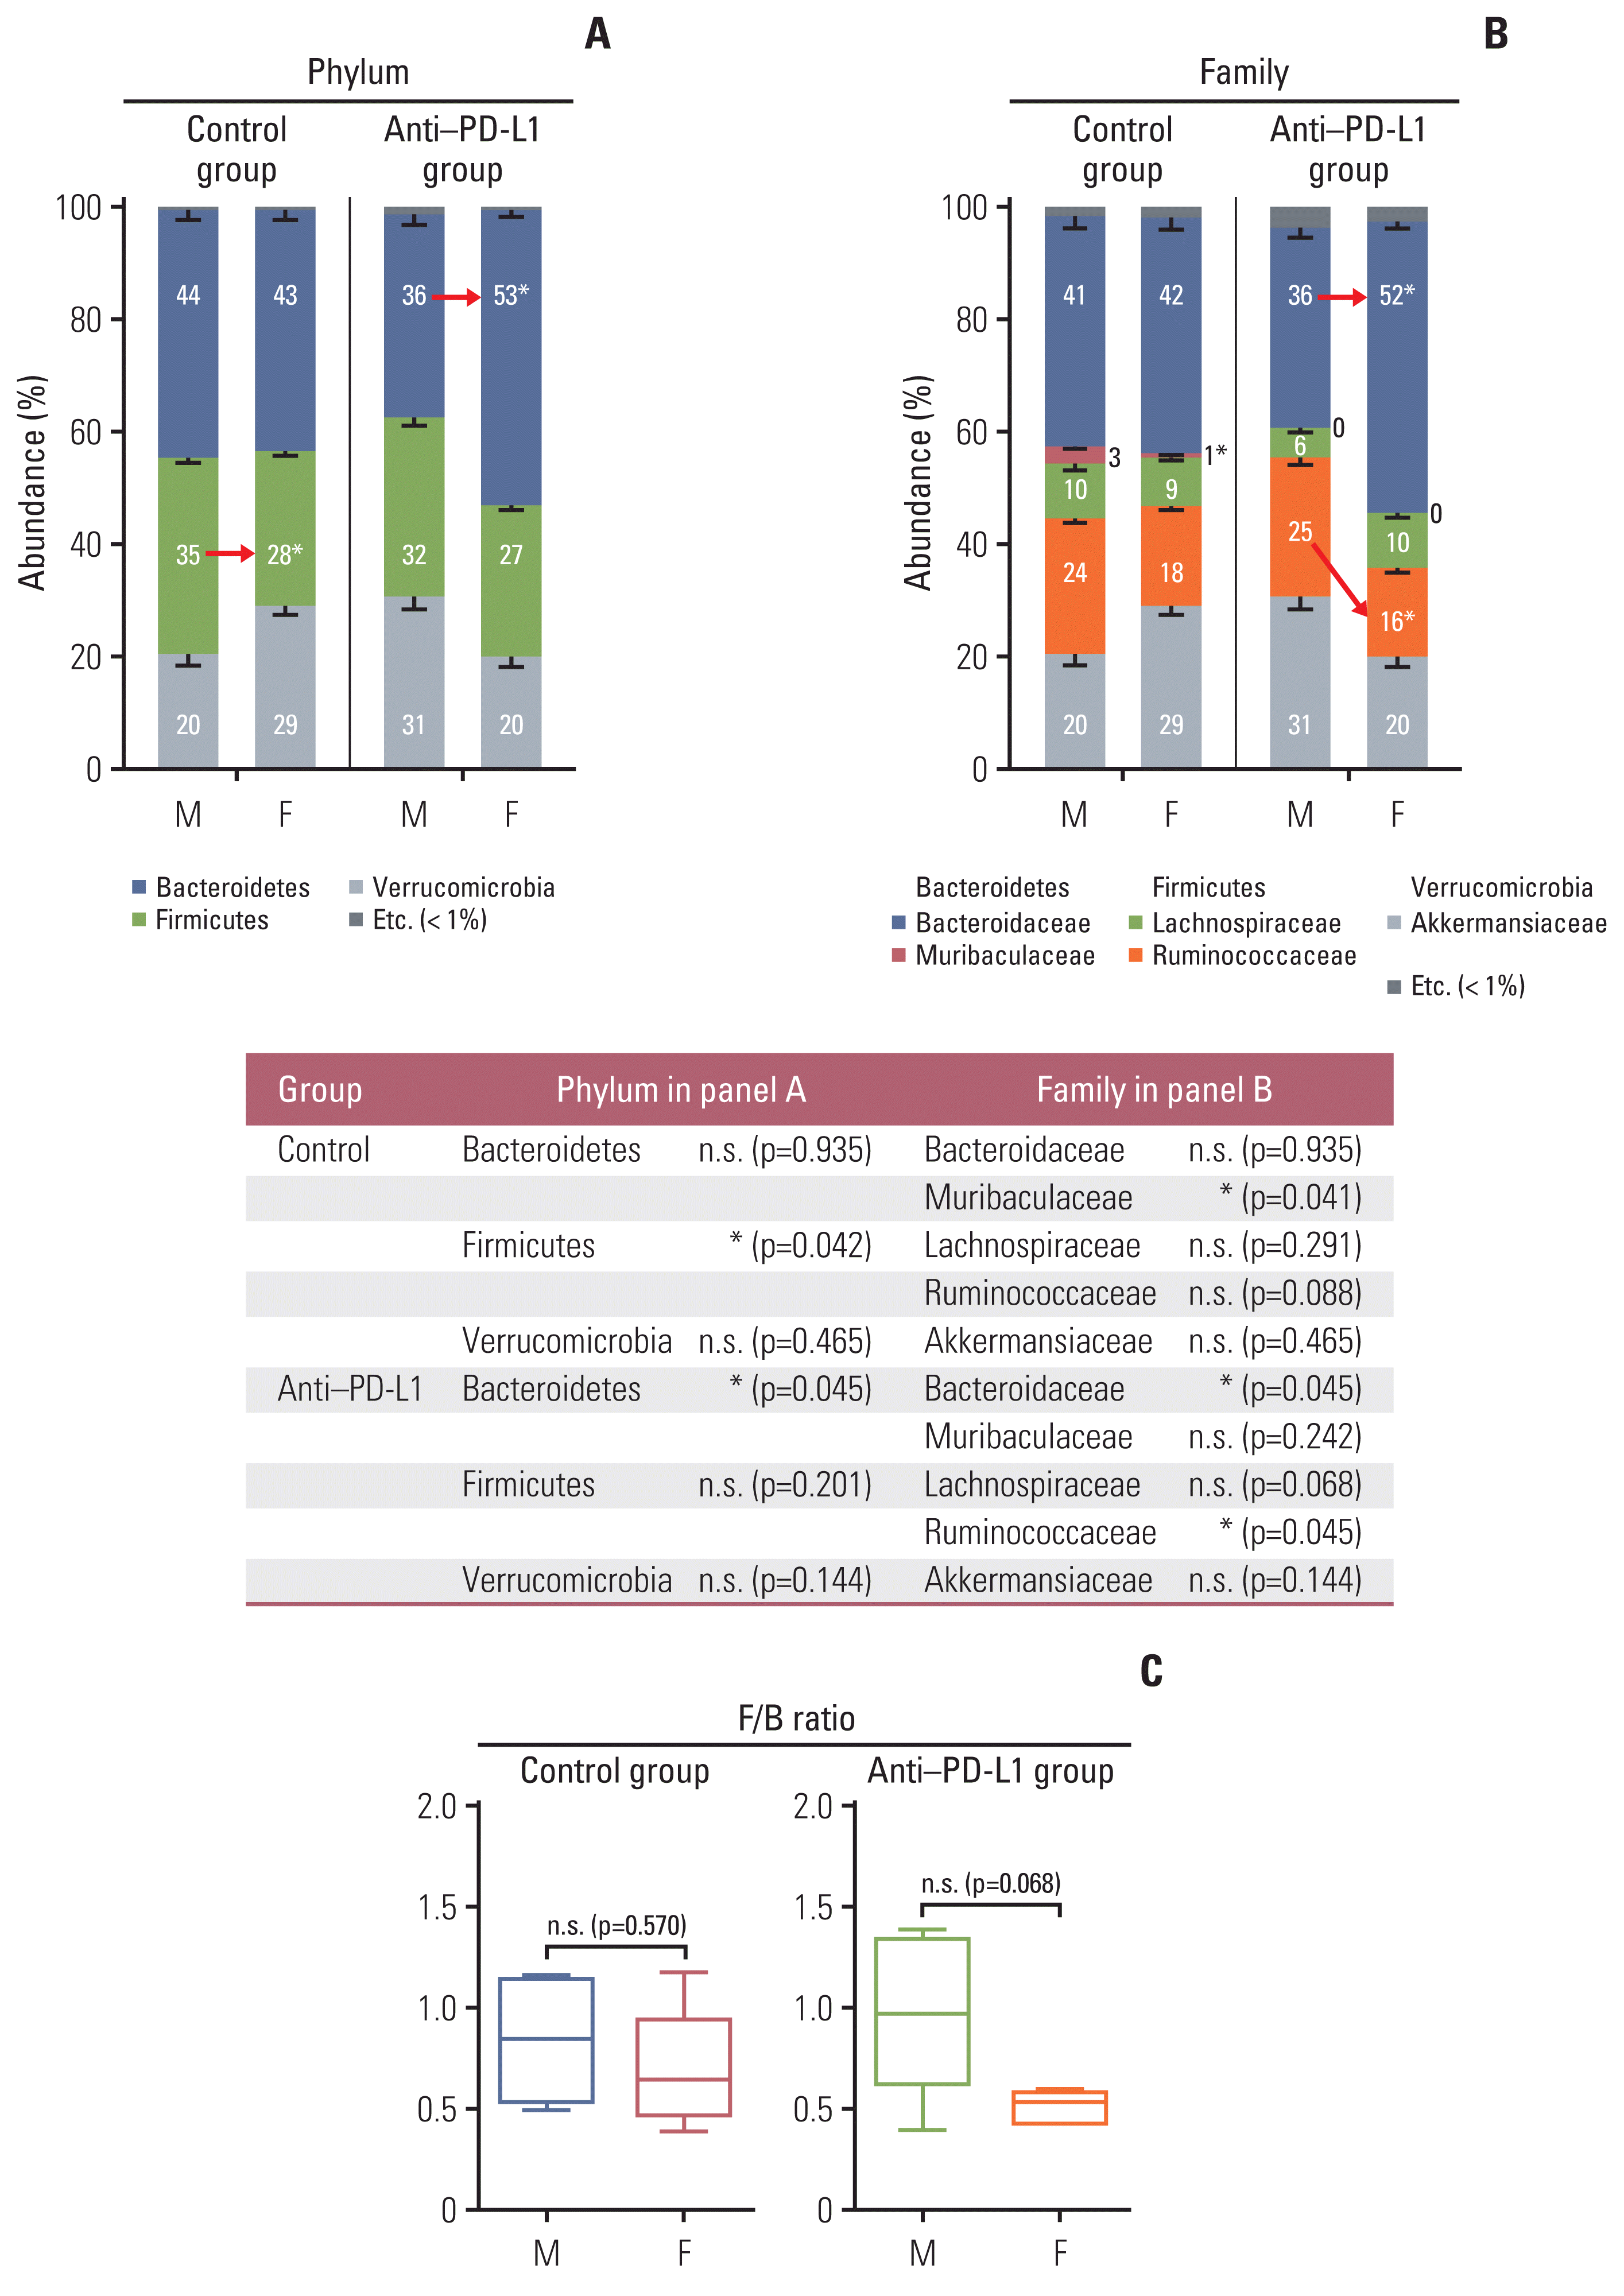 | Fig. 5Taxonomic composition. (A) Gut microbiota compositions at the phylum level in control group (left) and anti–PD-L1 group (right) in MC38 male and female mice. (B) Gut microbiota compositions at the family level in control group (left) and anti–PD-L1 group (right) in MC38 male and female mice. Mann-Whitney U test was used for comparison of differences between two independent groups. The p-values for Phylum and Family level are presented as a table under the figure. *p < 0.05, male control vs female control, anti–PD-L1–treated male vs. anti–PD-L1–treated female. (C) F/B ratio in control groups and anti–PD-L1 treated groups in MC38 male and female mice. Data are expressed as the mean±SEM. Whiskers show the minimum and maximum values. The p-values were calculated using the Mann-Whitney U test for comparison of differences between two independent groups. F, female; F/B, Firmicutes/Bacteroidetes; M, male; n.s., not significant; PD-L1, programmed death-ligand 1; SEM, standard error of the mean. |
5. Sex effect on individual bacterial communities in MC38 colon cancer mice
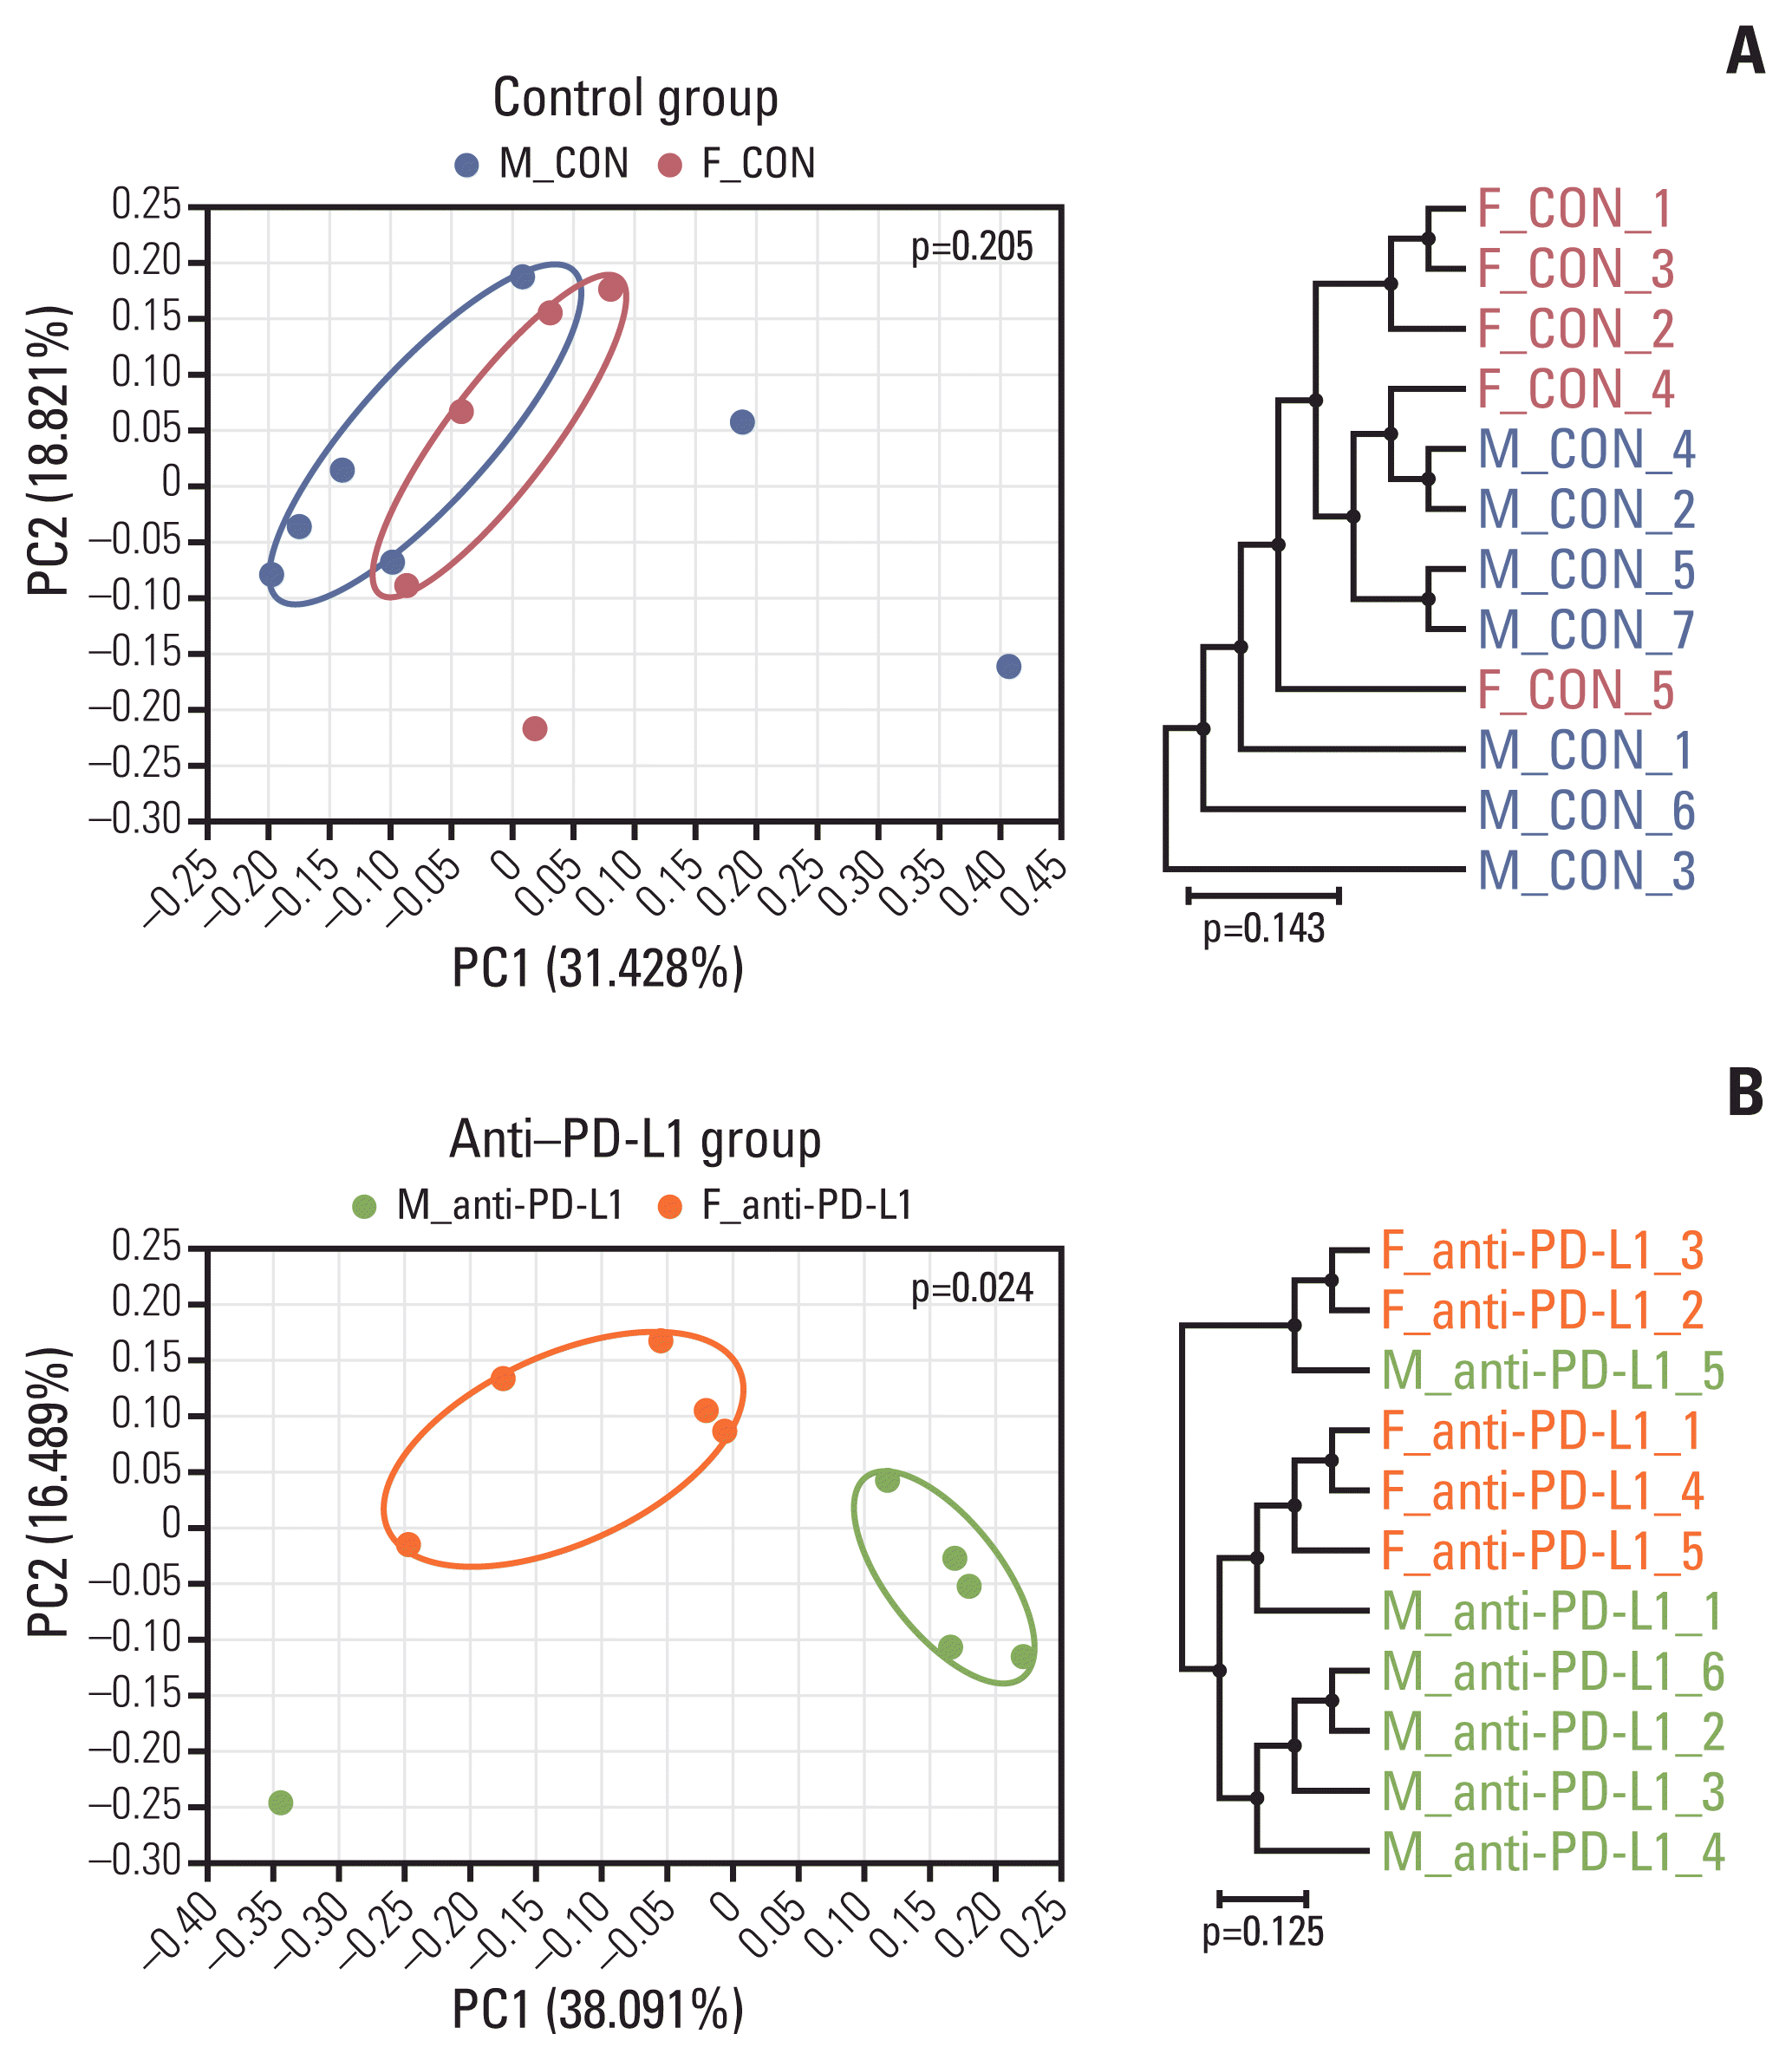 | Fig. 6Beta diversity of gut microbiota. (A) Sample clustering using UniFrac-based PCoA and UPGMA tree at the species level in MC38 male and female control groups. (B) Sample clustering using UniFrac-based PCoA and UPGMA tree at the species level in anti–PD-L1–treated MC38 male and female groups. MC38 male and female samples were clustered using the Generalized UniFrac method at the species level. Significance for similarity of bacterial population structure was analyzed using PERMANOVA. The clustering and phylogenetic tree of each group are marked with a different color: M_CON, blue; F_CON, red; M_anti-PD-L1, green; F_anti-PD-L1, orange color. CON, control; F, female; M, male; PCoA, principal coordinates analysis; PD-L1, programmed death-ligand 1; PERMANOMA, permutational multivariate analysis of variance; UPGMA, unweighted pair group method with arithmetic mean. |
6. Identification of sex-specific microbiota in MC38 colon cancer mice
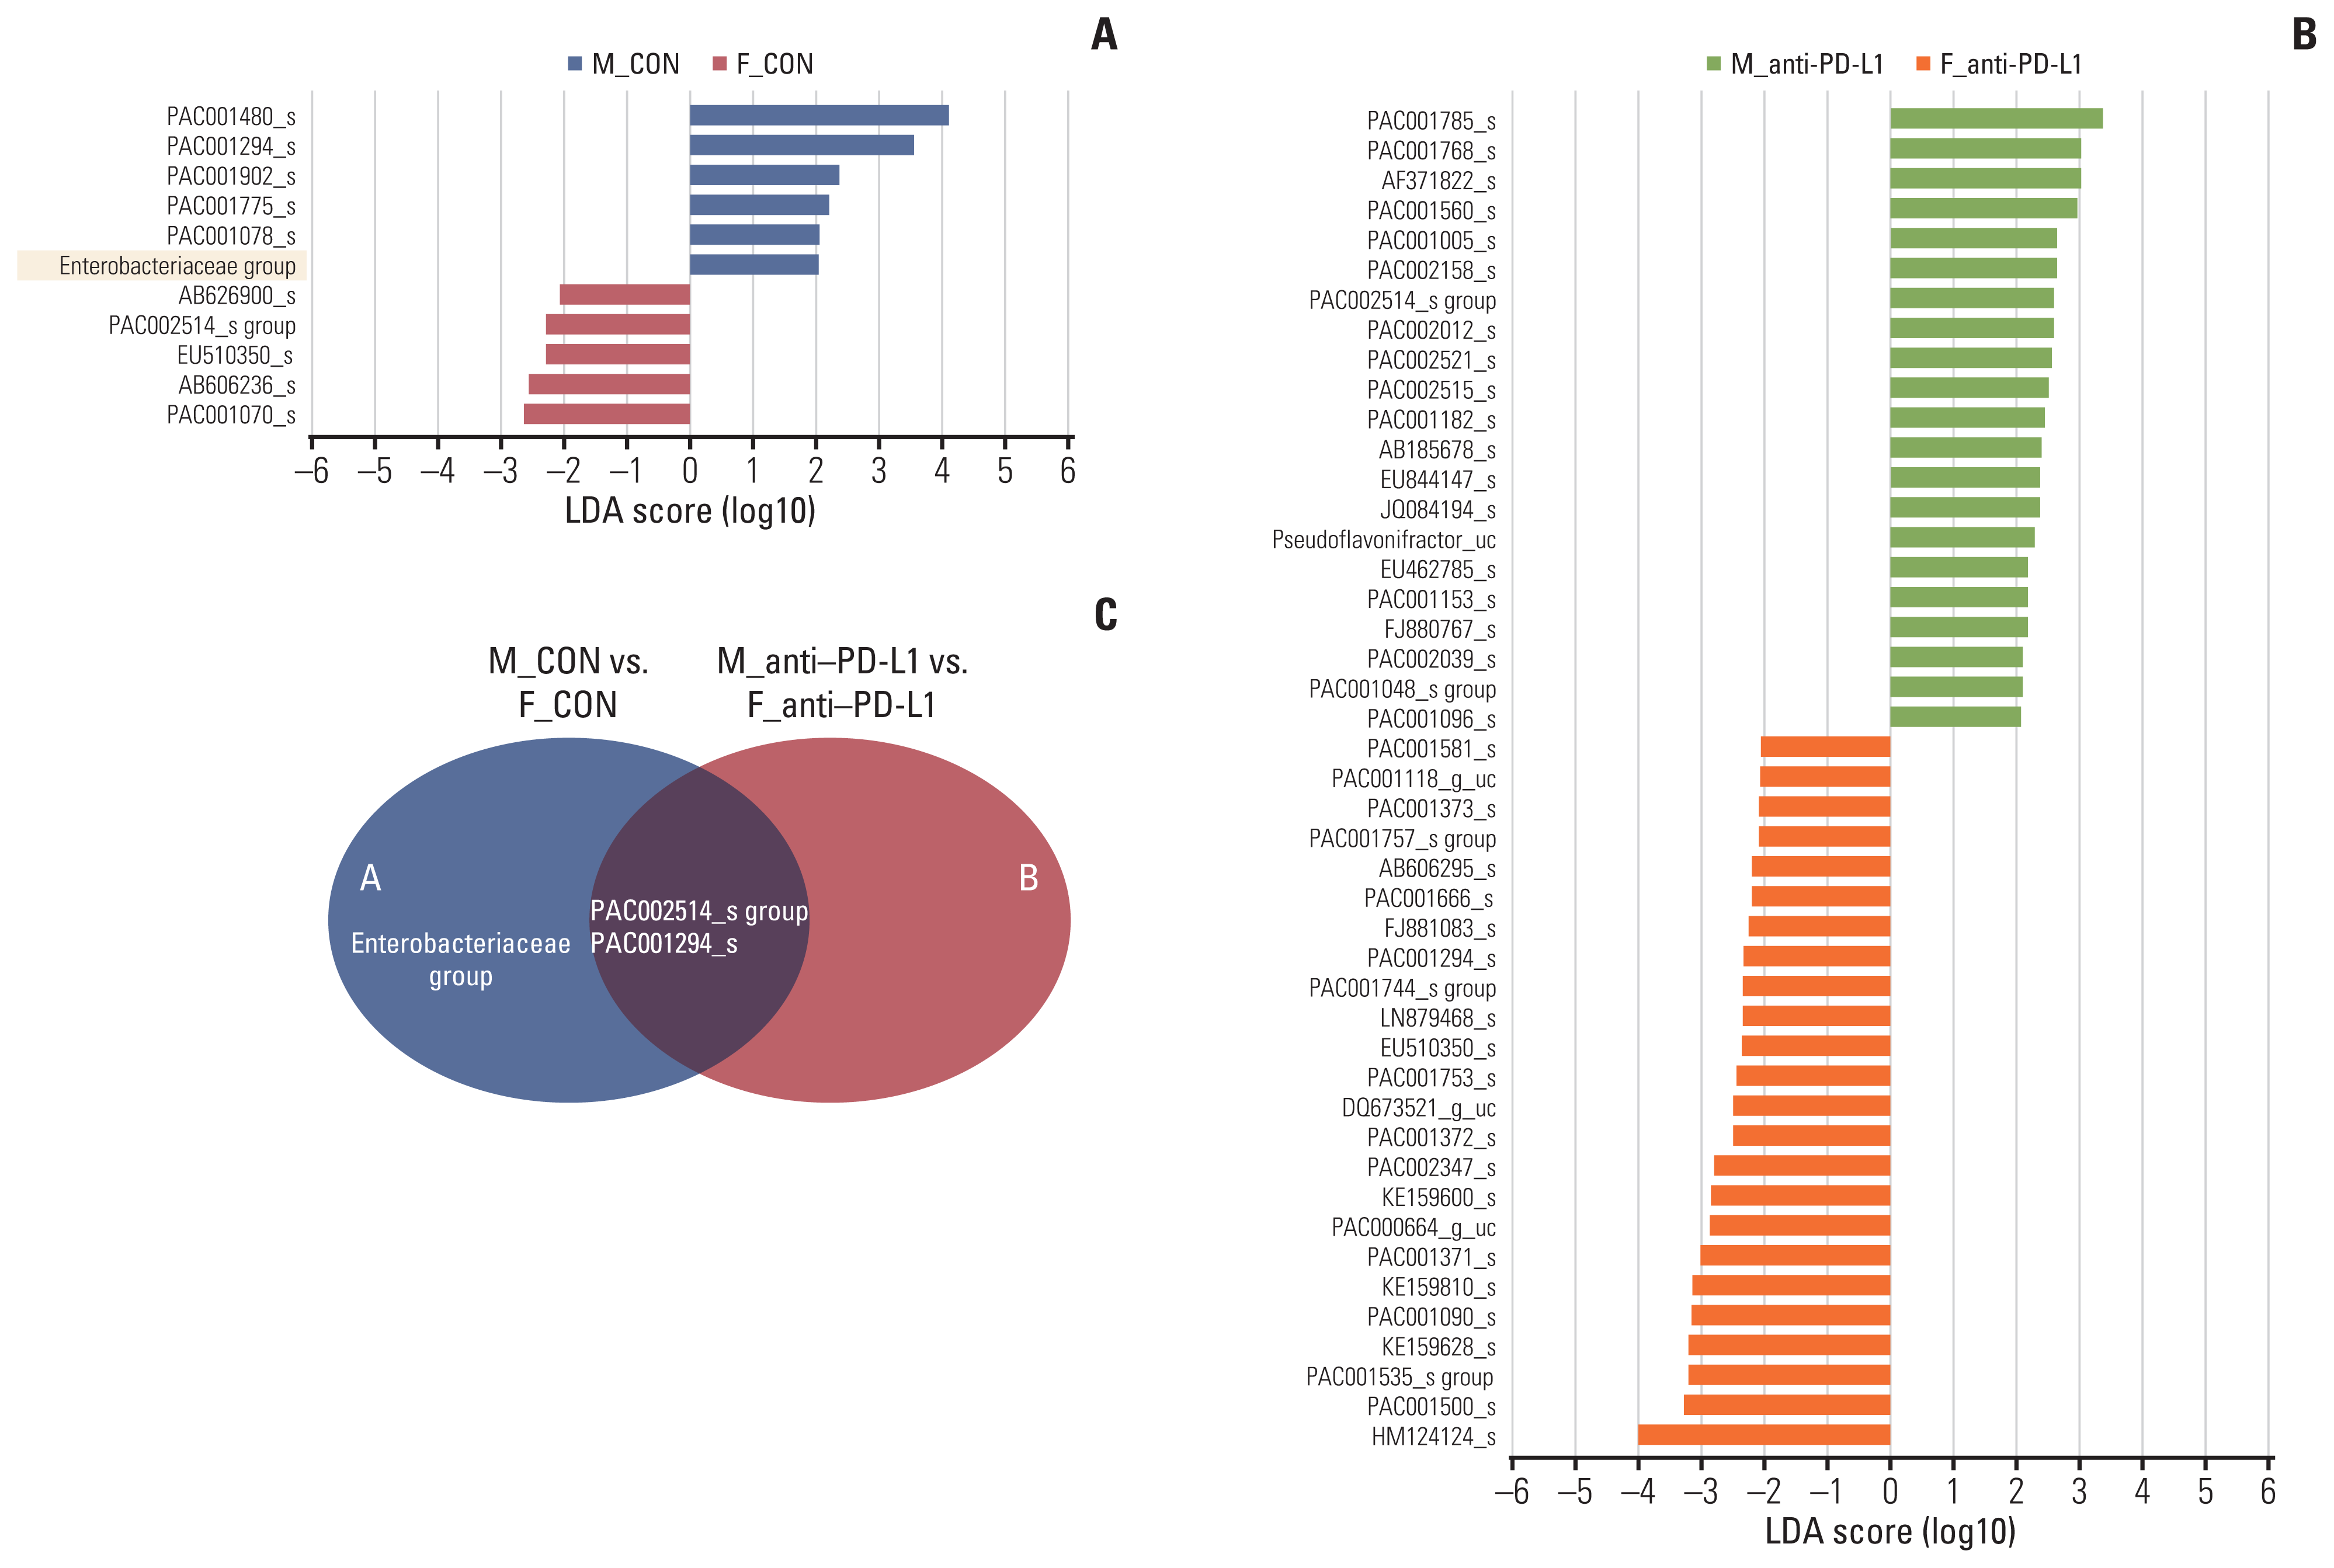 | Fig. 7Identification of sex-specific gut microbiome in control and anti–PD-L1 group in MC38 male and female mice. (A, B) LEfSe analysis. Bar plots of the LEfSe results, which were obtained based on the same criteria mentioned in Fig. 5. The color bars show the LDA score (log10) of species that were enriched in indicated conditions; (A) blue bar (male control) and red bar (female control), (B) block bar (anti–PD-L1–treated male) and gray bar (anti–PD-L1-treated female). (C) Venn diagrams based on LEfSe data. Identification of bacteria showing sex-dependent changes in control and anti–PD-L1 groups in male and female MC38 mice. CON, control; E2, 17β-estradiol; F, female; LDA, linear discriminant analysis; LEfSe, LDA effect size; M, male; PD-L1, programmed death-ligand 1. |
Discussion
 | Fig. 8Regulatory mechanism by which estrogen modulates the tumor microenvironment and simultaneously alters the gut microbiome to increase the effect of anti–PD-L1 and contribute to tumor size reduction in the MC38 colon tumor model. CAFs, cancer-associated fibroblasts; E2, 17β-estradiol; PD-1, programmed cell death-1; PD-L1, programmed death-ligand 1; TAM, tumor-associated macrophages. |


 PDF
PDF Citation
 Print
Print


 XML Download