Journal List > Cardiovasc Prev Pharmacother > v.5(3) > 1516083253

Yoon, Choi, Choi, Song, Ha, and Kim: Obesity and 30-day case fatality after hyperglycemic crisis hospitalizations in Korea: a national cohort study

Abstract

Background

We determined the case fatality rate associated with hospitalization due to hyperglycemic crises and investigated the relationship between obesity status and case fatality for hyperglycemic crises.

Methods

From the Korean National Health Insurance Service-National Sample Cohort, 729 adults who visited the emergency room or were hospitalized due to hyperglycemic crises between January 1, 2010, and December 31, 2019, were included. Preobesity or obesity was defined as a body mass index ≥23.0 kg/m2. Case fatality rates are presented as the proportion of adults who died within 30 days of hospitalization. Cox proportional hazards models were used to estimate hazard ratios (HRs) and 95% confidence intervals (CIs) for 30-day fatalities according to preobesity or obesity status.

Results

The 30-day case fatality rate for hyperglycemic crises was 11.2%. In those aged ≥65 years, the fatality rate was twice as high as that in those aged 20 to 64 years (13.8% vs. 6.8%). Adults with preobesity or obesity had a lower fatality rate than those with normal weight (9.5% vs. 14.0%). After adjustment for confounding variables, preobesity or obesity was found to be significantly associated with a decreased risk for 30-day case fatality compared to normal weight (HR, 0.63; 95% CI, 0.40–0.98).

Conclusions

In Korea, hyperglycemic crises had a high fatality rate. Management needs to be improved to prevent hyperglycemic crises and reduce mortality.

INTRODUCTION

Hyperglycemic crises are acute complications of diabetes that include diabetic ketoacidosis (DKA) and hyperosmolar hyperglycemic state (HHS). These crises can potentially result in coma or even death. In Korea, the mortality rates due to hyperglycemic crises in individuals with diabetes have decreased from 2004 to 2013 [1]. However, the 60-day case fatality rate for hyperglycemic crises remains high at 9.9% in 2013, comparable to that of myocardial infarction, which stands at 6.9% [1,2].
Obesity has negative effects on health, such as an increased risk of diabetes and its complications [3]. However, the prognosis of cardiovascular disease may be more favorable among individuals with preobesity or obesity, a phenomenon known as the “obesity paradox” [4]. This phenomenon has also been observed in individuals with diabetes, among individuals with preobesity or obesity have a lower risk of cardiovascular complications and overall mortality than those of normal weight [5].
In this study, we determined the case fatality rate associated with hospitalizations due to hyperglycemic crises. Additionally, we investigated the relationship between obesity status and case fatality for hyperglycemic crises, using the Korean National Health Insurance Service (NHIS) database.

METHODS

Ethics statements

The study protocol was approved by the Institutional Review Board of Ajou University Hospital (No. AJIRB-MED-EXP-21-463). The requirement for informed consent was waived due to the retrospective nature of the study.

Data source and study population

We conducted a retrospective population-based cohort study using the NHIS-National Sample Cohort (NHIS-NSC). The NHIS-NSC enrolled 1,021,208 individuals (2.2% of all eligible Koreans) in 2006 using a systematic sampling method. The details of the NHIS-NSC have been described elsewhere [6]. From January 1, 2010, to December 31, 2019, 1,582 people visited the emergency room or were hospitalized for hyperglycemic crisis, defined as DKA (International Classification of Diseases, 10th Revision [ICD-10] codes E10.1, E11.1, E12.1, E13.1, and E14.1) or HHS (ICD-10 codes E10.0, E11.0, E12.0, E13.0, and E14.0), except for hypoglycemic coma (ICD-10 codes E10.08, E11.08, E12.08, E13.08, and E14.08). Among them, we identified 757 adults aged ≥20 years who underwent national health examinations within 2 years from the date of visiting the emergency room or hospitalization (index date). After excluding 28 people who were underweight (body mass index [BMI], <18.5 kg/m2), 729 adults were included in the analysis.

Preobesity or obesity and covariates

Preobesity or obesity was defined as BMI ≥23.0 kg/m2 according to the guidelines of the Korean Society for the Study of Obesity [7]. Blood pressure was measured by trained medical staff. Fasting glucose levels were measured in fasting blood samples. Household income was categorized as the lowest 30%, the middle 40%, and the highest 30%. All prescribed drugs and diagnoses were retrieved from insurance claims filed between January 1, 2002, and the index date. Drugs were classified as antihypertensives (Anatomical Therapeutic Chemical [ATC] codes C02–C03 or C07–C09), statins (ATC code C10AA), or insulin (ATC code A10A). The comorbidities included myocardial infarction (ICD-10 codes I21−I22), stroke (ICD-10 codes I60−I64), chronic kidney disease (ICD-10 code N18), and cancer (ICD-10 codes C00–C99). Diabetes was defined as a diagnosis of diabetes (ICD-10 codes E10–E14) and a prescription for glucose-lowering drugs (ATC code A10). Diabetes was classified into type 1 (ICD-10 code E10) and type 2 diabetes (ICD-10 codes E11–E14). The duration of diabetes was defined as the period between January 1, 2002, and the index date, and was classified as <10 years or ≥10 years. The number of previous hospitalizations for hyperglycemic crises was defined as the sum of the number of hospitalizations from January 1, 2002, to the index date.

Statistical analysis

Normally distributed data are presented as mean±standard deviation and nonparametric data as median with interquartile range according to obesity status. Categorical data are presented as number (%). The case fatality rate for hyperglycemic crisis is presented as the proportion of adults who died within 30 days of hospitalization. Kaplan-Meier curves were used to analyze the cumulative mortality according to obesity status. We used Cox proportional hazards models to evaluate the association between preobesity or obesity and the 30-day case fatality rate for hyperglycemic crises using hazard ratios (HRs) and 95% confidence intervals (CIs) and adjusted for confounders, such as age, sex, household income, systolic blood pressure, fasting glucose, history of the disease, prescribed drugs, and index year. All analyses were performed using the SAS ver. 7.1 (SAS Institute) and R ver. 3.5.3 (R Foundation for Statistical Computing).

RESULTS

Table 1 shows the baseline characteristics of the study population according to preobesity or obesity status. Adults with preobesity or obesity were more likely to be female, have higher blood pressure, and use antihypertensive drugs and statins than those with normal weight.
Fig. 1 shows the distribution of fatality rates of hyperglycemic crises from 2010 to 2019. The overall fatality rate of hyperglycemic crises was 11.2%. The fatality rate of hyperglycemic crises was >13% in those aged ≥65 years and <7% in those aged 20 to 64 years. Adults with type 2 diabetes had a higher fatality rate than those with type 1 diabetes (11.6% vs. 6.4%). When classified by the duration of diabetes, the fatality rate was 9.9% in adults with a diabetes duration of <10 years and 12.1% in those with a diabetes duration of ≥10 years. Adults with preobesity or obesity had a lower fatality rate than those with normal weight (9.5% vs. 14.0%). Table S1 shows the leading causes of death within 30 days of hospitalization based on preobesity or obesity status. Diabetes was the leading cause of death in both adults with normal weight and adults with preobesity or obesity, accounting for 26.3% and 31.8% of deaths, respectively. The next most common causes of death included cancer, pneumonia, stroke, and heart disease.
Fig. 2 shows the Kaplan-Meier curve for the 30-day case fatality rate after hospitalization for hyperglycemic crises by preobesity or obesity status. After adjustment for confounding variables, adults with preobesity or obesity had a lower risk for case fatality than those with normal weight (HR, 0.63; 95% CI, 0.40–0.98) (Fig. 3). When stratified by confounding variables, such as age, sex, and duration of diabetes, preobesity or obesity was associated with a lower risk of 30-day fatality, although the association was not statistically significant (Fig. 3).

DISCUSSION

In Korea, the fatality rate of hyperglycemic crises was 11.2%, underscoring the significance of this issue in diabetes management. The case fatality rate fluctuated based on the characteristics of the participants. Specifically, when categorized by obesity levels, individuals classified as preobese or obese exhibited a lower 30-day case fatality rate compared to those of normal weight.
A recent Korean study reported a reduction in mortality due to hyperglycemic crises between 2004 and 2013. However, the in-hospital case fatality rate of hyperglycemic crises remained at 9.9% in 2013 [1]. In the United States, the in-hospital case fatality rate for DKA decreased from 1.1% in 2000 to 0.4% in 2014, despite an increase in the DKA hospitalization rate [8]. The difference between the two countries may be attributed to differences in age groups (Korea, ≥20 years; USA, all age groups) and the inclusion of HHS. Although these studies were published in the 1990s, the fatality rate for DKA in older adults in the United States was >5%, while the overall fatality rate was <1% [9,10]. HHS (5%–20%) had a higher fatality rate than DKA [11]. In Taiwan, the fatality rates of DKA and HHS in 2001 and 2005 were 2.6% and 11.6%, respectively [12]. In the current study, the fatality rates for DKA and HHS were similar (11.7% and 11.0%, respectively). However, when stratified by type of diabetes and type of hyperglycemic crisis, the fatality rate for DKA in individuals with type 1 diabetes was 4.8%, while the fatality rate for HHS in individuals with type 2 diabetes was 11.2% (data not shown). These findings may be due to the limitations of claims data, which do not accurately distinguish between DKA and HHS. Therefore, further studies using alternative databases are needed to gain a better understanding of the fatality rates of DKA and HHS.
The most common factors contributing to the development of hyperglycemic crises include infection, inadequate insulin therapy, pancreatitis, myocardial infarction, cerebrovascular disease, and certain medications. Interestingly, deaths resulting from hyperglycemic crises are seldom due to the metabolic complications of hyperglycemia or ketoacidosis. Instead, they are typically attributed to the underlying illness or triggering factors [13]. As a result, a hyperglycemic crisis death score was established to aid in emergency and critical care situations based on six risk factors: lack of tachycardia, hypotension, anemia, severe coma, a history of cancer, and the presence of infection [14]. In this study, diabetes was identified as the leading cause of death in approximately 30% of cases. However, most deaths (≥50%) were attributed to other diseases such as cancer, pneumonia, and cardiovascular disease. This suggests that underlying diseases may also play a significant role in causing death.
The prognosis for both conditions is substantially poor in older adults who are comatose, have hypotension, or have severe comorbidities [13]. In the current study, in adults aged ≥65 years, the fatality rate was twice higher than that in adults aged 20 to 64 years. However, adults with preobesity or obesity had a lower fatality rate than those with normal weight. This association was also observed in adults aged ≥65 years, although it was not statistically significant. Although preobesity or obesity is a strong risk factor for diabetes and its complications, numerous previous studies have provided evidence supporting the existence of the obesity paradox (i.e., preobesity or obesity having a good prognosis in diabetes) [15]. A pooled analysis of five longitudinal cohort studies showed that individuals who were preobese or obese at the onset of diabetes had a lower risk of total mortality and noncardiovascular mortality than those of normal weight [16]. In our previous study, we suggested that individuals who were preobese or obese had a lower risk of developing cardiovascular diseases and a lower risk of all-cause mortality in individuals with diabetes. This protective effect on mortality was observed in both individuals aged under 65 years and those aged 65 years and older [5]. Furthermore, a paradoxical survival advantage of obesity after emergency surgery has also been reported [17]. However, the underlying mechanism by which obesity protects against mortality remains unclear. This phenomenon may be due to a response to critical illness with protective effects, including high energy reserves, inflammatory preconditioning, anti-inflammatory immune profiles, endotoxin neutralization, adrenal steroid synthesis, activation of the renin-angiotensin system, cardioprotective metabolic effects, and prevention of muscle wasting [18].
Our study has several limitations. First, BMI, which is a simple method for classifying obesity, may not provide a completely accurate measure of obesity. Furthermore, we did not precisely account for BMI at the time of hospitalization, as we utilized health examination data from up to 2 years prior to the index date. Second, while we made adjustments for diabetes complications and insulin use, we did not fully account for the severity of diabetes. Third, the potential for residual confounders exists due to the absence of data from laboratory tests, such as glycated hemoglobin. Fourth, the possibility of misdiagnosis exists because the identification and classification of hyperglycemic crises were dependent on ICD-10 codes. Lastly, we conducted additional analysis by dividing the participants into three groups: normal weight, preobesity, and obesity. Individuals classified as preobese and obese had a lower risk for 30-day case fatality compared to those of normal weight. However, these associations did not achieve statistical significance, due to the limited number of events (Fig. S1). Therefore, further research involving larger sample sizes is necessary to validate these associations and achieve statistical significance.
In conclusion, the case fatality rate for hyperglycemic crises remains high in Korea. Preventing hospitalizations due to hyperglycemic crises can be achieved through patient education and effective communication with healthcare providers, particularly for older adults who may be unaware of their condition. There is a pressing need for improved overall management to prevent hyperglycemic crises and decrease fatality rates. Further research is necessary to assess the impact of obesity on fatalities resulting from hyperglycemic crises.

SUPPLEMENTARY MATERIALS

Table S1. Distribution of cause of death
cpp-2023-5-e10-Table-S1.pdf
Fig. S1. Risk of 30-day case fatality after hospitalization for hyperglycemic crises in adults by obesity status.
cpp-2023-5-e10-Fig-S1.pdf
Supplementary materials are available from https://doi.org/10.36011/cpp.2023.5.e10.

Notes

Ethics statements

The study protocol was approved by the Institutional Review Board of Ajou University Hospital (No. AJIRB-MED-EXP-21-463). The requirement for informed consent was waived due to the retrospective nature of the study.

Conflicts of interest

The authors have no conflicts of interest to declare.

Funding

None.

Acknowledgments

The authors thank the Korean National Health Insurance Service (NHIS) for providing the NHIS-National Sample Cohort (NHIS-NSC) data (No. NHIS-2022-2-281) used in this study.

Author contributions

Conceptualization: all authors; Data curation: KHH; Formal analysis: KHH; Investigation: KHH, DJK; Methodology: KHH; Project administration: DJK; Resources: KHH; Software: KHH; Supervision: DJK; Validation: HY, HHC, GC, SOS, KHH; Visualization: KHH; Writing–original draft: HY, KHH; Writing–review & editing: all authors. All authors read and approved the final manuscript.

REFERENCES

1. You JH, Song SO, Park SH, Park KH, Nam JY, Kim DW, et al. Trends in hyperglycemic crisis hospitalizations and in- and out-of-hospital mortality in the last decade based on Korean National Health Insurance Claims Data. Endocrinol Metab (Seoul). 2019; 34:275–81.
2. Kim RB, Kim HS, Kang DR, Choi JY, Choi NC, Hwang S, et al. The trend in incidence and case-fatality of hospitalized acute myocardial infarction patients in Korea, 2007 to 2016. J Korean Med Sci. 2019; 34:e322.
3. Piche ME, Tchernof A, Despres JP. Obesity phenotypes, diabetes, and cardiovascular diseases. Circ Res. 2020; 126:1477–500.
4. Elagizi A, Kachur S, Lavie CJ, Carbone S, Pandey A, Ortega FB, et al. An overview and update on obesity and the obesity paradox in cardiovascular diseases. Prog Cardiovasc Dis. 2018; 61:142–50.
5. Lee DH, Ha KH, Kim HC, Kim DJ. Association of body mass index with risk of major adverse cardiovascular events and mortality in people with diabetes. J Obes Metab Syndr. 2018; 27:61–70.
6. Lee J, Lee JS, Park SH, Shin SA, Kim K. Cohort profile: the National Health Insurance Service-National Sample Cohort (NHIS-NSC), South Korea. Int J Epidemiol. 2017; 46:e15.
7. Kim BY, Kang SM, Kang JH, Kang SY, Kim KK, Kim KB, et al. 2020 Korean Society for the Study of Obesity Guidelines for the Management of Obesity in Korea. J Obes Metab Syndr. 2021; 30:81–92.
8. Benoit SR, Zhang Y, Geiss LS, Gregg EW, Albright A. Trends in diabetic ketoacidosis hospitalizations and in-hospital mortality: United States, 2000-2014. MMWR Morb Mortal Wkly Rep. 2018; 67:362–5.
9. Malone ML, Gennis V, Goodwin JS. Characteristics of diabetic ketoacidosis in older versus younger adults. J Am Geriatr Soc. 1992; 40:1100–4.
10. Graves EJ, Gillum BS. Detailed diagnoses and procedures, National Hospital Discharge Survey, 1995. Vital Health Stat 13. 1997; (130):1–146.
11. Lorber D. Nonketotic hypertonicity in diabetes mellitus. Med Clin North Am. 1995; 79:39–52.
12. Chen HF, Wang CY, Lee HY, See TT, Chen MH, Jiang JY, et al. Short-term case fatality rate and associated factors among inpatients with diabetic ketoacidosis and hyperglycemic hyperosmolar state: a hospital-based analysis over a 15-year period. Intern Med. 2010; 49:729–37.
13. Kitabchi AE, Umpierrez GE, Miles JM, Fisher JN. Hyperglycemic crises in adult patients with diabetes. Diabetes Care. 2009; 32:1335–43.
14. Huang CC, Kuo SC, Chien TW, Lin HJ, Guo HR, Chen WL, et al. Predicting the hyperglycemic crisis death (PHD) score: a new decision rule for emergency and critical care. Am J Emerg Med. 2013; 31:830–4.
15. Han SJ, Boyko EJ. The evidence for an obesity paradox in type 2 diabetes mellitus. Diabetes Metab J. 2018; 42:179–87.
16. Carnethon MR, De Chavez PJ, Biggs ML, Lewis CE, Pankow JS, Bertoni AG, et al. Association of weight status with mortality in adults with incident diabetes. JAMA. 2012; 308:581–90.
17. Davenport DL, Xenos ES, Hosokawa P, Radford J, Henderson WG, Endean ED. The influence of body mass index obesity status on vascular surgery 30-day morbidity and mortality. J Vasc Surg. 2009; 49:140–7.
18. Karampela I, Chrysanthopoulou E, Christodoulatos GS, Dalamaga M. Is there an obesity paradox in critical illness? Epidemiologic and metabolic considerations. Curr Obes Rep. 2020; 9:231–44.
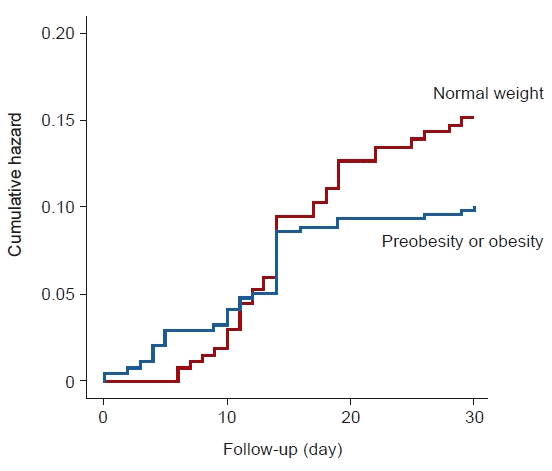
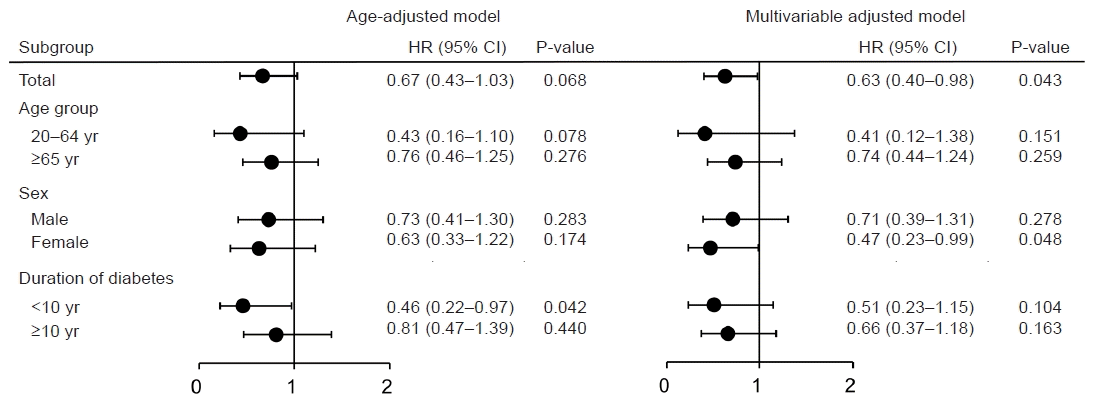
Fig. 1.
Hyperglycemic crisis fatality rates according to individual characteristics in Korea from 2010 to 2019.
cpp-2023-5-e10f1.tif
Fig. 2.
Cumulative case fatality rate after hospitalization for hyperglycemic crises according to the preobesity or obesity status.
cpp-2023-5-e10f2.tif
Fig. 3.
Risk of 30-day case fatality after hospitalization for hyperglycemic crises in adults with preobesity or obesity versus adults with normal weight (reference group). Adjusted for sex, age, household income, fasting glucose level, systolic blood pressure, type and duration of diabetes, number of admissions for hyperglycemic crisis, use of insulin, antihypertensive drugs, statins, comorbidities, and index year. HR, hazard ratio; CI, confidence interval.
cpp-2023-5-e10f3.tif
Table 1.
Baseline characteristics according to preobesity or obesity status
Characteristic Normal weight (n=278) Preobesity or obesity (n=451) P-value
Age (yr) 67.0±14.2 67.7±13.4 0.485
Male sex 161 (57.9) 223 (49.4) 0.032
Household income 0.437
 Low 90 (32.4) 128 (28.4)
 Middle 77 (27.7) 141 (31.3)
 High 111 (39.9) 182 (40.3)
Body mass index (kg/m2) 21.1±1.2 26.2±2.8 <0.001
Systolic blood pressure (mmHg) 126.4±16.9 131.5±17.4 <0.001
Diastolic blood pressure (mmHg) 76.3±9.9 78.8±10.7 0.002
Fasting glucose (mg/dL) 141.5 (111.0–207.0) 132.0 (108.0–171.0) 0.087
Antihypertensive drug 226 (81.3) 393 (87.1) 0.042
Statin 143 (51.4) 271 (60.1) 0.027
Insulin 266 (95.7) 437 (96.9) 0.515
Myocardial infarction 38 (13.7) 41 (9.1) 0.071
Stroke 80 (28.8) 119 (26.4) 0.536
Chronic kidney disease 58 (20.9) 79 (17.5) 0.305
Cancer 114 (41.0) 171 (37.9) 0.452
Type of diabetes 0.019
 Type 1 26 (9.4) 21 (4.7)
 Type 2 252 (90.6) 430 (95.3)
Duration of diabetes ≥10 yr 170 (61.2) 276 (61.2) >0.999
No. of hospitalization for hyperglycemic crises ≥2 98 (35.3) 162 (35.9) 0.918
Index year 0.548
 2010 7 (2.5) 13 (2.9)
 2011 19 (6.8) 25 (5.5)
 2012 15 (5.4) 39 (8.7)
 2013 33 (11.9) 45 (10.0)
 2014 30 (10.8) 45 (10.0)
 2015 40 (14.4) 63 (14.0)
 2016 31 (11.2) 48 (10.6)
 2017 47 (16.9) 61 (13.5)
 2018 29 (10.4) 48 (10.6)
 2019 27 (9.7) 64 (14.2)

Values are presented as mean±standard deviation, number (%), or median (interquartile range).

TOOLS
Similar articles