

 PDF
PDF Citation
 Print
Print


INTRODUCTION
The number of patients with rectal cancer is increasing, and depending on the stages and locations of the disease, several treatment methods are being used, considering the stages and locations of the disease. Chemoradiotherapy (CRT) is the most effective cancer treatment and is provided in approximately half of all patients with cancer, especially in those with locally advanced rectal cancer (LARC).1 Currently, CRT is commonly provided in preoperative patients with rectal cancer because of the sensitivity of the disease to treatment.2 However, there are significant differences between the tumor regression states in the resected specimens after CRT. Some patients experience local recurrences or distant metastasis after treatment, whereas others show complete regression after treatment, which leads to different prognoses. The pathological response to preoperative treatment is an important prognostic factor for rectal cancer.3 Thus, there is a requirement for measurable markers in pre-CRT specimens that can predict responses or adverse events.
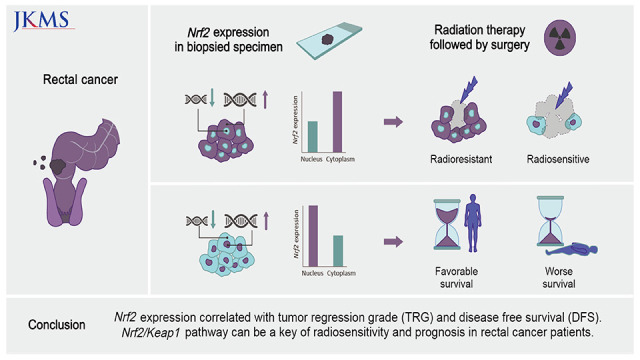
Recently, the nuclear factor erythroid 2-related factor 2 (Nrf2)/Kelch-like ECH-associated protein 1 (Keap1) pathway was identified in malignancies. Nrf2 is the most popular regulator of protective genes in the cell cycle.4 The Keap1 protein regulates Nrf2 negatively. Nrf2 maintains its low cellular level, bound to a low level of Keap1 in normal cells during homeostasis. However, if there is extracellular stress, the ligation between Nrf2 and Keap1 is disconnected, and Nrf2 moves into the nucleus of the damaged cells, resulting in the transcription of cellular protective genes.5 This Nrf2/Keap1 pathway is crucial in carcinogenesis, as Keap1 downregulation and Nrf2 overactivation are detected in many types of cancer.5678 Moreover, the Nrf2/Keap1 pathway is also involved in resistance to CRT in head and neck or lung cancer, although the exact mechanism has not been yet established.9 In cases of head and neck cancer or lung squamous cell carcinoma, there are several studies on the correlation between the response to treatment and Nrf2/Keap1 mutations; however, there are only a few studies assessing this correlation in rectal cancer.9 Since CRT is used as treatment of choice before surgery in LARC, a potential preoperative predictor of therapeutic responsiveness is required. Here, we evaluated the predictive role of the Nrf2/Keap1 pathway in the prognosis of patients with LARC and their responsiveness to CRT.
METHODS
Patient selection
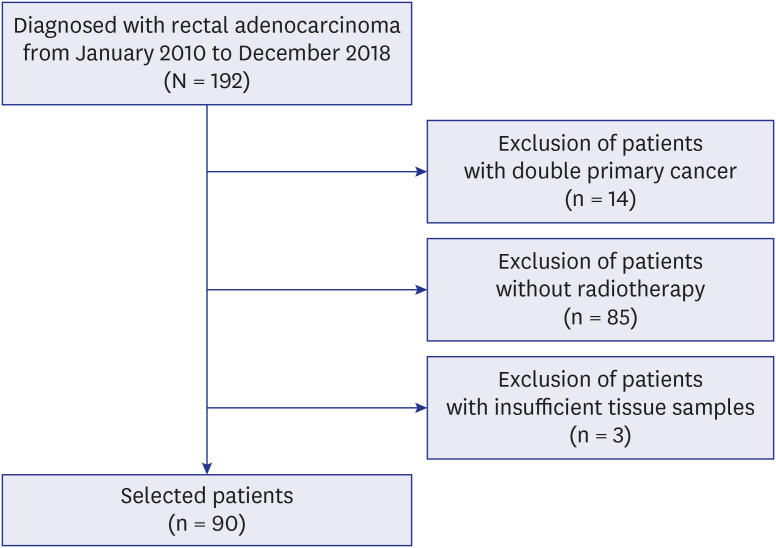
Patients diagnosed with rectal adenocarcinoma on colonoscopic biopsy between January 2010 and December 2018 at the Keimyung University Dongsan Hospital were screened in this study. Of the 192 patients, 14 with two primary cancers were excluded. Among the 178 patients, 85 who were not treated with CRT before surgery and three without a valuable sample size were excluded from this study. None of the patients died of reasons other than rectal cancer progression (Fig. 1). The clinicopathological parameters, including age, sex, tumor-node-metastasis stage, disease-free survival (DFS), and overall survival (OS), of the selected 90 patients were reviewed retrospectively. Patients without an event for DFS or OS at the time of the data cutoff were recorded at the date of their last follow-up. All the patients underwent fluoropyrimidine-based concurrent chemoradiation therapy prior to surgery. A dose of 50.4 Gy was given, which included 45 Gy in 25 fractions for the pelvis and a 5.4 Gy boost in 3 fractions for the residual primary tumor(s) over 5.5 weeks. The chemotherapy regimens were: 2 cycles of intravenous bolus of fluorouracil (400 mg/m2 per day) and leucovorin (20 mg/m2 per day) for 5 days in the first and fifth weeks of radiation therapy. Additionally, all the patients underwent staging abdominopelvic and chest computed tomography scans, rectal MRIs, colonoscopies, biopsies, and positron emission tomography scans. A total mesorectal excision was performed within 6–8 weeks of the final CRT.
Tissue samples and immunohistochemistry
Immunohistochemical staining was performed to assess the Nrf2 and Keap1 expression levels. A representative block was selected for each tissue sample, and all the specimens were formalin-fixed and paraffin-embedded. Immunohistochemical staining for Nrf2 and Keap1 was also performed. A BenchMark ULTRA automated stainer (Ventana Medical Systems, Inc., Tucson, AZ, USA) was used for the immunostaining, following the manufacturer’s protocol. A rabbit monoclonal anti-Nrf2 antibody (1:200, #ab76026; Abcam, Cambridge, MA, USA) and a rabbit polyclonal anti-Keap1 antibody (1:200, #10503-2-AP; Proteintech, Rosemont, IL, USA) were used for staining. The tissue from the human tonsils and human skeletal muscle were stained as positive controls for Nrf2 and Keap1.
Evaluation of tumor regression grade (TRG)
The TRG was evaluated using prevalent criterion in all samples obtained from the operated specimen after CRT. Two pathologists (J.M.P. and H.W.L.) evaluated the TRG in these samples using the American Joint Committee on Cancer (AJCC) methods. According to the AJCC, TRG was divided into four groups (TRG 0, no residual tumor cells; TRG 1, single cells or small groups of tumor cells; TRG 2, more than residual single tumor cells with desmoplastic response; TRG 3, minimal evidence of tumor response or no regression).10
Evaluation of immunohistochemical stain
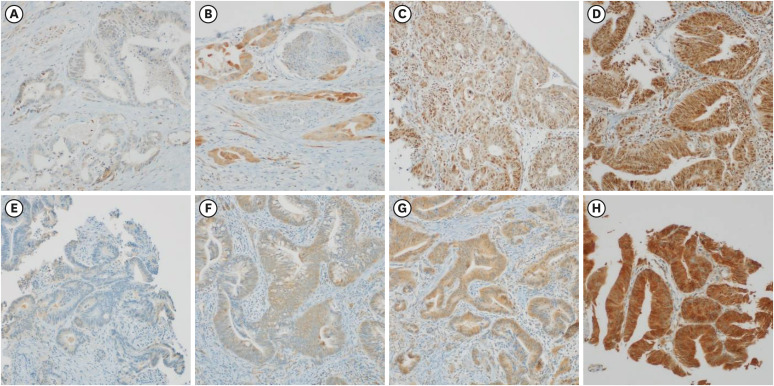
The immunostaining patterns of Keap1 and Nrf2 were evaluated by two pathologists (J.M.P and H.W.L). Both the cytoplasmic and nuclear staining patterns were considered positive; however, in order to determine whether there was a difference between the nuclear and cytoplasmic staining of Nrf2, each staining pattern was evaluated separately. The proportion of stained cells ranged from 0% to 100% at the 5% interval, whereas the intensity was scored from 1 to 3 (0, not stained; 1, weakly stained; 2, moderately stained; and 3, strongly stained), as shown in Fig. 2. The histoscore (H-score) (ranging from 0 to 300), obtained by multiplying the proportion and intensity, was used to evaluate the immunostaining: H-score = (0 × Percentage of Cells with Absent Staining) + (1 × Percentage of Score 1 Cells) + (2 × Percentage of Score 2 Cells) + (3 × Percentage of Score 3 Cells).11 Based on the cutoff for H-score, two groups were formed for the statistical analysis: “high expression” and “low expression.” The optimal cutoff values were set as follows; cytoplasmic expressions of Keap1 and Nrf2: 290, nuclear expression of Nrf2: 160 for DFS, cytoplasmic expression of Keap1: 280, cytoplasmic expression of Nrf2: 250 and nuclear expression of Nrf2: 240 for OS.
Fig. 2
Interpretation of Nrf2 and Keap1 expressions. (A) No nuclear and cytoplasmic staining (Nrf2, ×200). (B) No nuclear and moderate cytoplasmic staining (Nrf2, ×200). (C) Moderate nuclear and weak cytoplasmic staining (Nrf2, ×200). (D) Strong nuclear and strong cytoplasmic staining (Nrf2, ×200). (E) No staining (Keap1, ×200). (F) Weak staining (Keap1, ×200). (G) Moderate staining (Keap1, ×200). (H) Strong staining (Keap1, ×200).
Nrf2 = nuclear factor erythroid 2-related factor 2, Keap1 = Kelch-like ECH-associated protein 1.
Statistical analyses
All the statistical analyses were performed using the statistical software R v4.2.0 (R Project for Statistical Computing, Vienna, Austria; www.r-profect.org). The medical records of all 90 patients were reviewed to obtain the clinical characteristics. The statistical significance was set at P < 0.05. DFS was calculated from the time of the first CRT to radiographic progression or death. OS was calculated from the time of the first CRT to the date of death. The expression values of markers and clinicopathologic parameters calculated using the correlation coefficients obtained via the Kendall, Spearman or Pearson methods. The survival was evaluated using the Kaplan-Meier curves and Cox proportional hazards regression analysis. The optimal cutoff between the high and low H-score groups was determined at the point with the lowest P value using the Maxstat package in the R software.
RESULTS
Patient characteristics
Among the 90 patients, 61 (67.8%) were male and 29 (32.2%) were female, with a median age of 63.4 (standard deviation, 10.7) years. The differentiation of rectal adenocarcinoma was classified into three groups: well (n = 4), moderate (n = 82), and poor (n = 4). The clinical stage at the time of diagnosis was reviewed, and most patients were classified as T3 (n = 44), followed by T2 (n = 20), T1 (n = 7), and T4a (n = 2). Sixteen (17.78%) cases showed complete regression through imaging evaluation after treatment and one patient showed only a perirectal tumor deposit without any remaining tumor in the rectal wall. Of all the 90 patients, 28 showed regional lymph nodal metastasis. According to the pathological reports, 43 and 18 patients had lymphocytic responses and lymphovascular invasion, respectively. Moreover, 18 and 16 patients had perineural invasion and tumor budding, respectively. All the cases were subdivided into two groups according to their microsatellite instability (MSI) status: 82 (91.1%) were microsatellite stable + MSI-low and 8 (8.9%) were MSI-high. There were 17 patients (18.9%) with TRG 0, 12 patients (13.3%) with TRG 1, 3 patients (38.9%) with TRG 2, and 26 patients (28.9%) with TRG 3. All the characteristics stated above are shown in Table 1.
Table 1
Clinicopathological parameters of patients
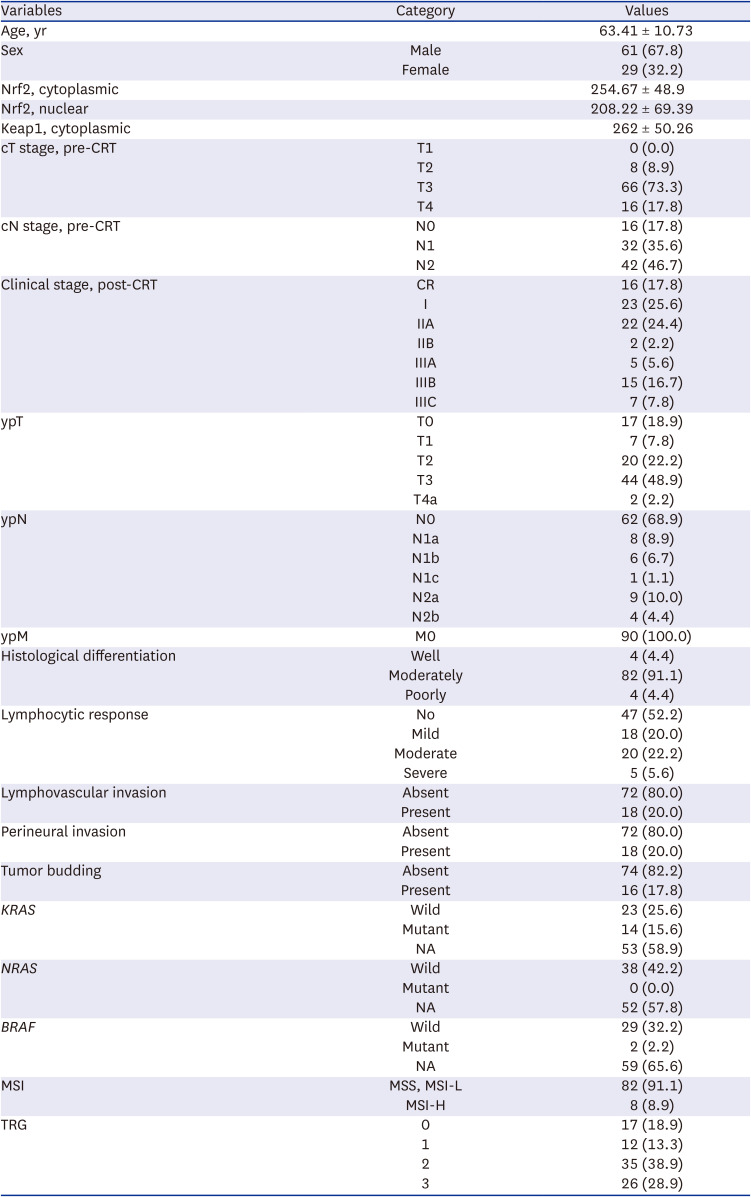
Values are presented as mean ± standard deviation or number (%).
Nrf2 = nuclear factor erythroid 2-related factor 2, Keap1 = Kelch-like ECH-associated protein 1, CRT = chemoradiotherapy, CR = complete regression, NA = not applicable, MSI = microsatellite instability, MSS = microsatellite stable, MSI-L = microsatellite instability-low, MSI-H = microsatellite instability-high, TRG = tumor regression grade.
Correlation between Nrf2 and Keap1 expressions and clinicopathologic parameters
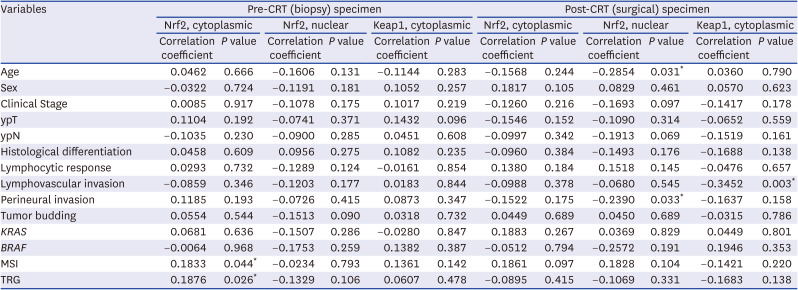
As a result of analyzing the relationship between each marker in the pre- and post-CRT specimens and the clinicopathologic parameters, the MSI (P = 0.044) and TRG (P = 0.025) showed a significant correlation in Nrf2 expression, especially in the cytoplasmic stain. Furthermore, the nuclear Nrf2 expression in post-CRT specimens was correlated with age (P = 0.031) and perineural invasion (P = 0.033). The cytoplasmic expression of Keap1 was related to lymphovascular invasion (P < 0.001). There was no association between the Nrf2 and Keap1 expressions in the pre- and post-CRT specimens and other parameters. The results are mentioned above and all the data are shown in Table 2. Furthermore, in the analysis of the expression relationship between each marker, Nrf2 showed a close positive relationship between the nuclear and cytoplasmic stains (Supplementary Table 1).
Table 2
Correlation of the Nrf2 and Keap1 expressions of the pre- and post-CRT specimens with clinicopathological parameters in 90 cases of rectal cancer patients
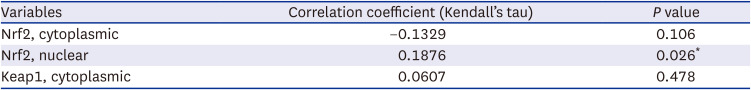
Correlation between Nrf2 and Keap1 expressions and TRG
A high nuclear expression of Nrf2 before CRT was associated with a high TRG (P = 0.025), whereas cytoplasmic expression of Nrf2 and Keap1 did not show a significant correlation with TRG. The results are presented in Table 3.
Correlation between Nrf2 and Keap1 expressions and survival
A high nuclear Nrf2 expression in the pre- CRT specimens was correlated with better DFS and OS (P = 0.080 and P = 0.001, respectively) (Fig. 3A). The cytoplasmic Keap1 expression levels did not correlate with DFS and OS (P = 0.340 and P = 0.210, respectively). The immunohistochemical staining of the cytoplasmic Nrf2 expression showed a significant relationship with DFS (P = 0.048), but was not related to OS (P = 0.270) (Fig. 3B).
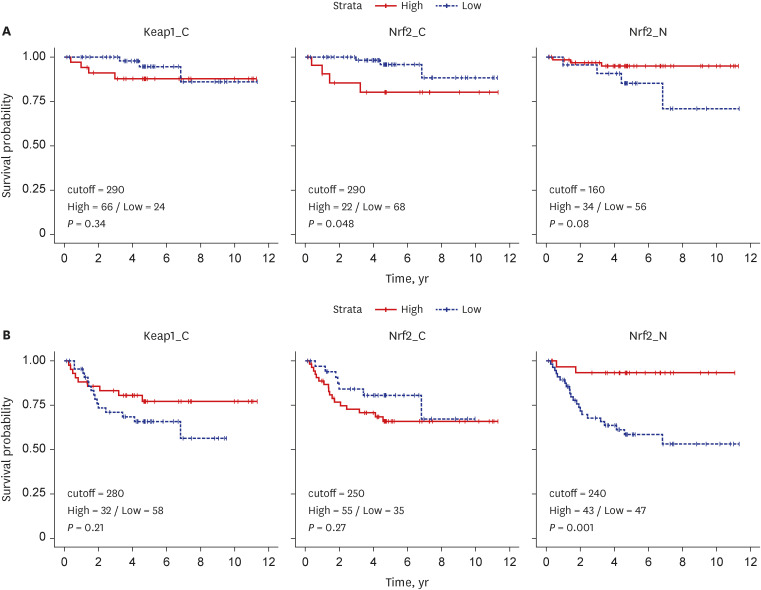
Fig. 3
Association between Keap1 and Nrf2 stains to survival probability. (A) Relationship between Keap1/Nrf2 expressions and disease-free survival. (B) Relationship between Keap1/Nrf2 expressions and overall survival.
Keap1 = Kelch-like ECH-associated protein 1, Nrf2 = nuclear factor erythroid 2-related factor 2.
Multivariate analysis
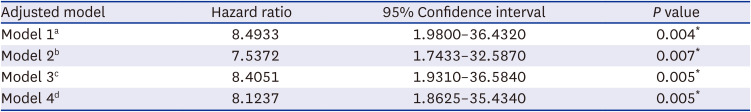
In the multivariate Cox analysis, adjusted for age, sex, clinical stage, and TRG, each variable showed a significant relationship between a high nuclear expression of Nrf2 and a favorable DFS (Table 4).
Table 4
Multivariate analysis of disease-free survival with the clinicopathological variables, including the nuclear expression of nuclear factor erythroid 2-related factor 2
DISCUSSION
Nrf2 is a regulator of the cell protective system, whereas Keap1 controls the level and stability of Nrf2 by degradation. The Nrf2 levels, which are significantly low under normal conditions, increase upon extracellular stress as chemicals of reactive oxygen species (ROS). Considering that radiation therapy (RT) generates the ROS that kill cancer cells, Nrf2 may play an important role in radiosensitivity. Several studies have investigated this. In a study of esophageal squamous cell carcinoma, for instance, nuclear Nrf2 expression was correlated with an unfavorable response to RT, suggesting that the Nrf2 expression status is an independent predictive factor of radiosensitivity. In the case of the lung, the deletion of Keap1 was related to aggressiveness, metastasis, and radioresistance in pulmonary squamous cell carcinoma.1213 Several other studies have also revealed that Nrf2 inhibition reduced the tolerance of patients to RT, especially in squamous cell carcinoma of the head and neck.14
CRT is a commonly used preoperative treatment in patients with LARC; thus, identifying the regulation status of the Nrf2/Keap1 pathway may be a useful prognostic marker of radiosensitivity and survival rate.15 In this study, the Nrf2 and Keap1 expressions and their relationship with TRG and survival rate were demonstrated. The Nrf2 expression in the cytoplasm was associated with a better response after CRT, whereas the Nrf2 expression in the nucleus was associated with a better survival rate. TRG can predict the prognosis of patients with rectal cancer, which was also shown in our study. What is noteworthy in our results is the relationship between Nrf2 and survival. A high nuclear expression of Nrf2 was associated with a high TRG, i.e., worse therapeutic response, but a favorable DFS. Since a significant correlation was shown between Nrf2 and DFS in the multivariate analysis with an adjustment of several variables, Nrf2 may be regarded as an independent predictive factor of favorable survival, separately from TRG. However, the cytoplasmic expression of Nrf2 showed a positive correlation with TRG; thus, the poor survival trend with a higher H-score of cytoplasmic Nrf2 shown in the DFS graph may be the effect of TRG.
Interestingly, results of this study have also demonstrated that depending on the primary organs, the same target regulator may have a different prognostic or therapeutic effect after CRT. According to our results, the Keap1 and Nrf2 expressions showed a positive correlation with the prognosis, whereas the cytoplasmic Nrf2 expression had a negative correlation with the prognosis. In previous studies, the Keap1 and Nrf2 expressions usually affected radiosensitivity or prognosis in an opposite manner.161718 However, according to our results, the Keap1 and nuclear Nrf2 staining had similar effects on radiosensitivity and prognosis, whereas the cytoplasmic Nrf2 staining seemed to have the opposite effect. The binding and dissociation of Nrf2 and Keap1, resulting in the Nrf2 translocation through the nucleus and cytoplasm, play an important role in the subsequent expression and degeneration of cell protection-related proteins. The difference in the cytoplasmic and nuclear expression of Nrf2 may reflect the location of Nrf2 in cell regulation. There are insufficient studies on Nrf2 expression and prognosis or the radiosensitivity of LARC, especially those with separate evaluations of nuclear and cytoplasmic Nrf2 expressions. Determining the movements and levels of Nrf2 or Keap1 proteins may be helpful in understanding their locations of expression. The cytoplasmic and nuclear Nrf2/Keap1 exhibited different roles in the prognosis of LARC. Compared to previous studies, this study analyzed the expression at each location in the nucleus and cytoplasm separately, to provide more meaningful results. The analysis of both the cytoplasmic and nuclear stains for Nrf2 and Keap1 were conducted previously in endometrial cancer and lung cancer. However, there was no study targeting LARC.19 Additional analytical research including in vitro studies and RNA analyses as well as on the protein levels will be needed to elucidate the mechanism that shows these differences.
Another challenge for future studies is the elucidation of the effect of the Nrf2 overexpression on radiosensitivity. Several regulators participate in the Nrf2/Keap1 pathway, and it is necessary to study how RT regulates each of them to influence tumor regression.
In conclusion, as the prevalence of rectal cancer increases, the need to identify resistance to CRT in advance has emerged. This will help clinicians plan the follow-up and treatment of patients with LARC. Considering these results, it can be concluded that the Nrf2/Keap1 pathway may be one of the key pathways that may play a role in the therapeutic resistance of LARC.
 XML Download