

 PDF
PDF Citation
 Print
Print


INTRODUCTION
The volume of global lead production was found to be 4,482 kilotons in 2020 and is expected to grow by 2% annually until 2025.1 Lead is well-known to be a harmful heavy metal, and various associated adverse health effects have been studied. Lead can be absorbed into the body through the respiratory or gastrointestinal tracts and can damage the hematopoietic system, central and peripheral nervous systems, kidney, and many other organs. Although lead toxicity is a widely known entity, and various policies have been implemented to reduce environmental lead exposure, human lead exposure remains widespread and is significantly associated with increased risk of all-cause mortality, including circulatory mortality.2 Even low-level lead exposure (below 10 μg/dL) is significantly associated with all-cause mortality and cardiovascular mortality.3 A systematic review determined a causal relationship between lead exposure and cardiovascular disease (CVD).4
CVD imposes immense health and economic burdens globally.56 Coronary artery calcification (CAC) is abnormally deposited calcium on the walls of arteries that supply the myocardium. This was once thought to be a benign process associated with aging but is now known as an important risk factor for CVD. CAC with computed tomography (CT) measures atherosclerotic burden in the coronary arteries. Other components of the atherosclerotic plaque, including cholesterol-rich components and fibrotic components, often accompany CAC.5 This calcium deposition causes arterial stiffness and increases the risk of atherosclerotic CVD.7 CAC is a highly specific feature of coronary atherosclerosis, and a person’s coronary artery calcium score (CACS) is a sensitive marker of subclinical coronary atherosclerosis.89 With recent advances in CT imaging techniques, CACS can be measured non-invasively through cardiovascular CT angiography.1011 The CACS is an important indicator for assessing risk and planning primary prevention of major CVD in the middle-aged population.9 This study aimed to investigate the association between blood lead level (BLL) and CAC using 128-slice dual-source CT coronary angiography.
METHODS
Participants
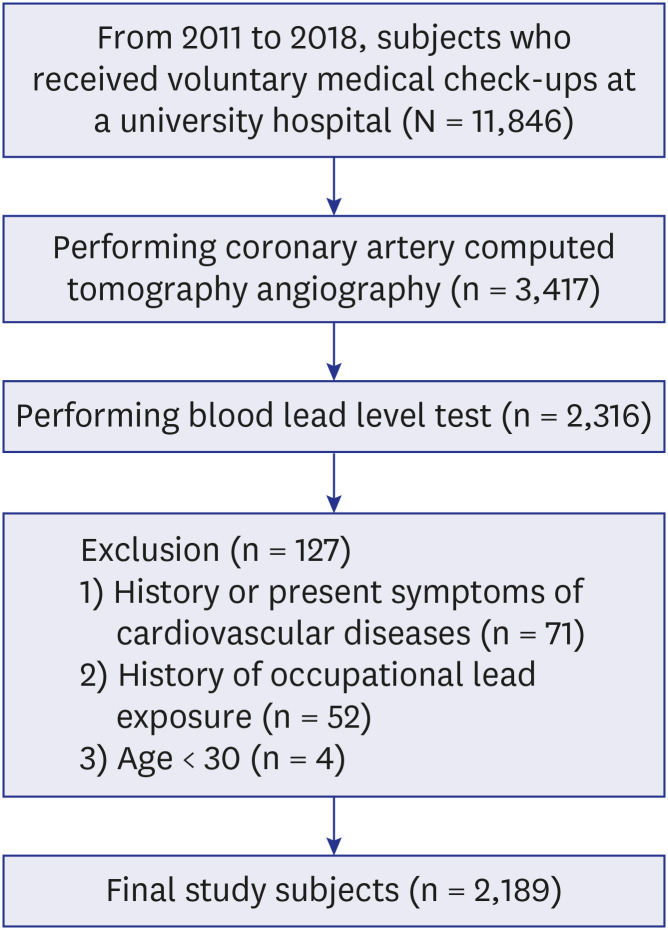
The participants of this study were 2,189 adults (aged ≥ 30 years) who visited a university hospital for voluntary health check-ups, including coronary artery CT angiography and BLL testing, between January 2011 and December 2018. Those with a history or symptoms of CVD were excluded (n = 71). Participants with only essential hypertension were not excluded. Those who had previously worked in jobs that could expose them to heavy metals were excluded (battery-related work, shipbuilding jobs, welding, soldering, brazing, etc., n = 52). The study sample consisted of 1,458 men and 731 women. All participants were asymptomatic Korean adults without CVD (Fig. 1).
Data collection
Physicians directly administered a structured questionnaire to all participants. The questionnaire queried general characteristics, such as details about alcohol consumption, smoking, underlying diseases, and family history of CVD. Regular exercise was defined as carrying out regular physical activity for more than 30 minutes per day and more than once a week. Alcohol drinking was defined as drinking more than 20 g of alcohol at least once a week. Ever-smokers were defined as those who smoked 100 or more cigarettes in their lifetimes. Participants on antihypertensive medication at the time of enrollment or those with blood pressure measurements ≥ 140/90 mmHg were defined as having hypertension. Participants with diabetes mellitus were defined as those who were being treated for diabetes mellitus or had glucose levels ≥ 126 mg/dL or had glycated hemoglobin levels ≥ 6.5%. Participants with dyslipidemia were defined as those who were being treated for dyslipidemia or had total cholesterol levels ≥ 240 mg/dL, low-density lipoprotein levels ≥ 160 mg/dL, or triglyceride levels ≥ 500 mg/dL. Height and weight were measured in the upright position with shoes and socks removed. Blood pressure was measured in the left upper arm using an electronic sphygmomanometer and was checked regularly by an experienced nurse while the participant was stable for more than 10 minutes. Obesity was calculated using the body mass index (BMI) formula: BMI (kg/m2) = weight (kilograms)/(height [meters])2. Obesity was defined as BMI ≥ 25 kg/m2. Physical examinations and blood tests were performed after participants had fasted for at least 12 hours.
Blood lead analysis
About 3 mL of whole blood was collected using a disposable syringe and placed in an ethylenediaminetetraacetic acid tube. BLL was analyzed using an atomic absorption spectrometer (Shimadzu, Kyoto, Japan) with an attached graphite furnace atomizer (GFA-EX7) and 0.1 mL of whole blood diluted with 0.8 mL of 1% triton X-100. BLLs were analyzed according to Korea Occupational Safety and Health Agency guidelines.12 To evaluate the reliability and validity of the analysis results, external quality control was performed by the Korea Occupational Safety and Health Agency every 2 years, and internal quality control was performed using standard materials. The limit of detection was 0.01 µg/dL.
Coronary CT angiography
Coronary CT angiography was performed by using a 128-channel dual-source CT scanner (SOMATOM Definition Flash; Siemens, Munich, Germany). CACS was measured for each participant through unenhanced electrocardiographically gated multi-slice CT, and calcification and stenosis were confirmed through contrast-enhanced coronary artery CT angiography. The calcium content in each coronary artery was measured using the international standards protocol and summed to produce a total CACS (Agatston score).1314 After measuring, two radiology specialists confirmed the CACSs. Both radiologists were qualified by the Korean Society of Cardiovascular Imaging’s Certification Board of Cardiovascular Computed Tomography. The CACSs were classified into the following four categories: 1) absent (CACS = 0); 2) minimal (> 0, < 10); 3) mild (≥ 10, < 100); 4) moderate (≥ 100, < 400); 5) severe (≥ 400).
Statistical analyses
We performed a cross-sectional study of 2,189 participants. All categorical variables were compared using the Pearson’s χ2 test. Since BLL had a right-skewed distribution, natural log transformation was performed, after which statistical analysis was performed. The Student’s t-test or analysis of variance were used to compare BLLs associated with different variables. Correlation analysis was performed to investigate the partial correlation coefficients between BLL, CACS, and other continuous variables. Multivariate logistic regression analysis was used to investigate the odds ratio (OR) and 95% confidence interval (CI) of severe CAC (CACS ≥ 400) with a 1 µg/dL increase in BLL. The models were built in four steps. In the crude model, the variables were not adjusted. In model 1, age and sex were adjusted; the second model included BMI, exercise, smoking, and alcohol drinking habits in addition to the first model. In the last model, underlying diseases, such as hypertension, diabetes mellitus, and dyslipidemia were additionally adjusted for. All statistical analyses were performed using SPSS Statistics for Windows, version 27.0 (IBM Corp., Armonk, NY, USA), and the significance level was defined as P < 0.05.
Ethics statement
We conducted a retrospective review of the participants’ medical records. The participants’ data were anonymized and stored in the Chonnam National University Hospital Clinical Data Warehouse. The data were used for research purposes in accordance with the Personal Information Protection Act. Each participant provided electronic informed consent regarding the collection and use of personal information before the checkup was conducted. The protocol of this study was approved by the Institutional Review Board (IRB) of Chonnam National University Hwasun Hospital (IRB number CNUHH-2020-150).
RESULTS
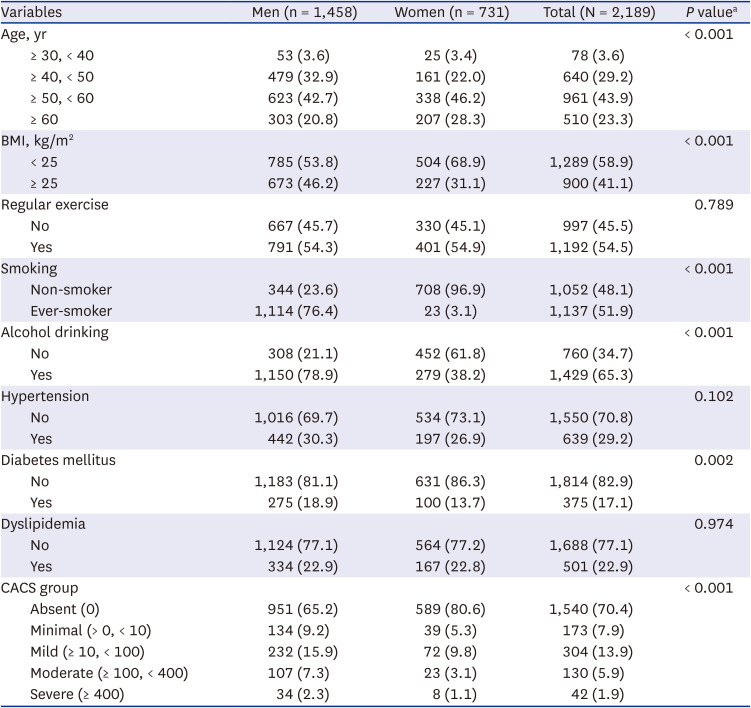
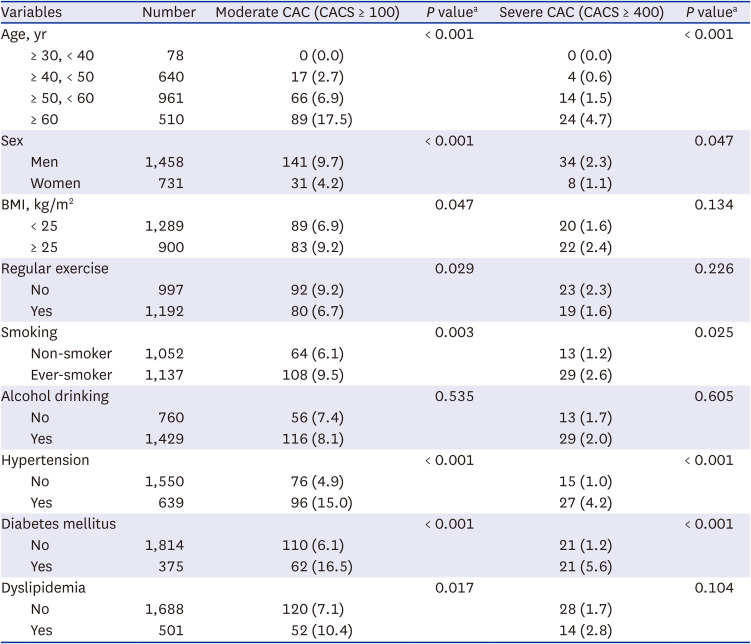
This study included 2,189 participants, of which 66.6% were men (n = 1,458), and 33.4% were women (n = 731). Participants’ ages ranged from 31 to 81 years, with an arithmetic mean age of 53.6 ± 8.3 years. The BMIs ranged from 16.2 to 43.5 (arithmetic mean, 24.5 ± 2.9 kg/m2). The prevalence of obesity was 41.1%. The prevalence of obesity among men was significantly higher than that among women (46.2% vs. 31.1%, P < 0.001). There was no significant difference between men and women in the proportion of participants who exercised regularly (respectively, 54.3% vs. 54.9%, P = 0.789). The overall proportion of ever-smokers was 51.9% (76.4% of men vs. 3.1% of women, P < 0.001). The proportion of alcohol drinkers was 65.3% (78.9% of men vs. 38.2% women, P < 0.001). The overall prevalences of underlying disease were as follows: 29.2% for hypertension, 17.1% for diabetes mellitus, and 22.9% for dyslipidemia. In the analysis of CACS, 29.6% of all participants had CACSs > 0. Based on CACS of 100 Hounsfield units, 7.9% of all participants, 9.7% of men, and 4.2% of women were classified in the moderate to severe group. Severe CACS (≥ 400) was the determination for 1.9% of all participants, 2.3% of men, and 1.1% of women. The proportion of CAC was significantly higher in men than in women (P < 0.001) (Table 1).
Table 1
General characteristics of the study subjects
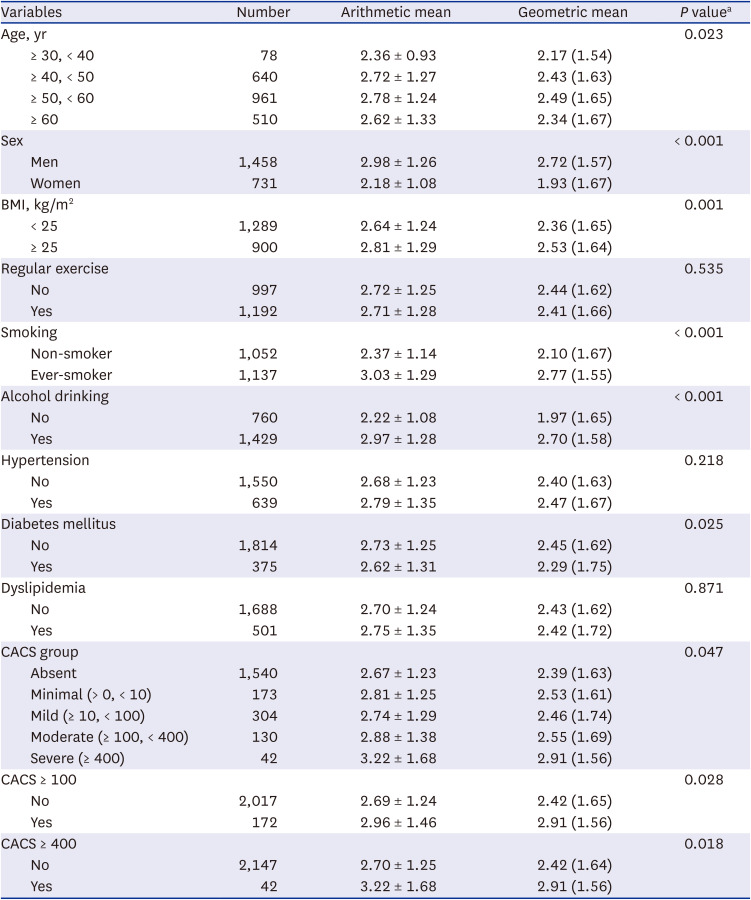
The BLLs ranged from 0.12 to 10.14 μg/dL, with an arithmetic mean of 2.71 ± 1.26 μg/dL and a geometric mean of 2.42 (1.64) μg/dL. As age increased, the arithmetic mean BLL increased significantly until the 50- to 59-year age group, with the highest value among participants in their 50s (2.78 ± 1.24 μg/dL) and decreased after the 60s age group. The geometric mean BLL similarly increased significantly with age group (P = 0.023). The arithmetic mean BLL among men was 2.98 ± 1.26 μg/dL, which was higher than the arithmetic mean BLL among women (2.18 ± 1.08 μg/dL). There was also a significant difference between men and women in terms of geometric mean BLLs (respectively, 2.72 μg/dL vs. 1.93 μg/dL, P < 0.001). The obese group's geometric mean BLL was 2.53 μg/dL, which is higher than that of the non-obese group's arithmetic mean BLL (2.36 μg/dL, P = 0.001). There were no significant differences in arithmetic and geometric mean BLLs between participants who did vs. did not engage in regular exercise. Ever-smokers had a significantly higher geometric mean BLL (2.77 μg/dL) than non-smokers (2.10 μg/dL). The geometric mean BLL among alcohol drinkers (2.70 μg/dL) was significantly higher than that among non-drinkers (1.97 μg/dL). In terms of underlying diseases, only the diabetes mellitus group had a significant difference in geometric mean BLL compared with the normal group (2.29 μg/dL vs. 2.45 μg/dL, diabetes mellitus group and normal group respectively, P = 0.025). In terms of CACS grades, the higher the CACS, the higher the mean BLL was (P = 0.047). When the CACS was divided into 100 or 400 criteria, the BLL was significantly higher in the group with the high CACS (Table 2).
Table 2
Blood lead level (μg/dL) distribution by the variables
With a criterion of CACS ≥ 100, the CAC distribution varied significantly by age, sex, BMI, exercise status, smoking status, hypertension status, diabetes status, and dyslipidemia status. With a criterion of CACS ≥ 400, the CAC distribution varied significantly by age, sex, smoking status, hypertension status, and diabetes status. Older age, male sex, obesity, lack of regular exercise, smoking, hypertension, diabetes mellitus, and hyperlipidemia were significant risk factors for CAC (Table 3).
Table 3
Distribution of moderate to severe CAC by variables (n = 2,189)
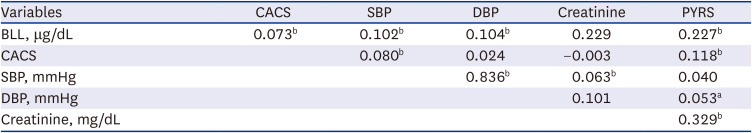
The age-adjusted partial correlation analysis revealed a significant correlation between BLL and CACS, systolic blood pressure, diastolic blood pressure, creatinine, and quantitative smoking variables (P < 0.05). CACS and BLL were positively correlated (r = 0.073, P < 0.001) (Table 4). The correlation coefficient between age and CACS was 0.176, indicating a significant correlation (P < 0.001).
Table 4
Partial correlation coefficients between blood lead level and variables after adjusting for age
| Variables | CACS | SBP | DBP | Creatinine | PYRS |
|---|---|---|---|---|---|
| BLL, μg/dL | 0.073b | 0.102b | 0.104b | 0.229 | 0.227b |
| CACS | 0.080b | 0.024 | −0.003 | 0.118b | |
| SBP, mmHg | 0.836b | 0.063b | 0.040 | ||
| DBP, mmHg | 0.101 | 0.053a | |||
| Creatinine, mg/dL | 0.329b |
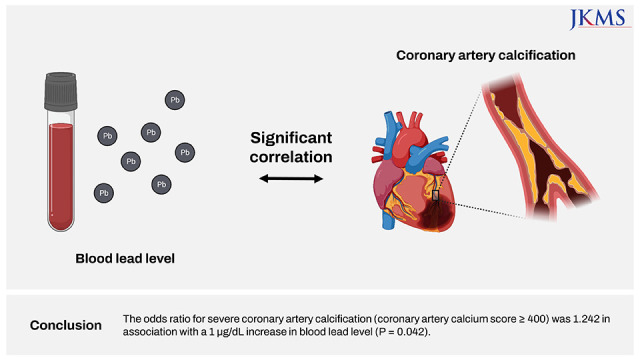
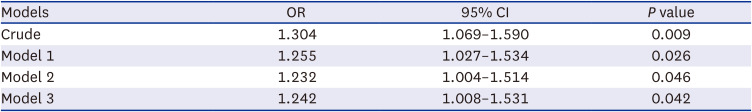
Multivariate logistic regression analysis was conducted to investigate the OR for severe CAC (CACS ≥ 400) in association with a 1 μg/dL increase in blood lead after adjusting for the confounders. In the crude model, the OR for severe CAC was 1.304 (95% CI, 1.069–1.590, P = 0.009) as blood lead increased by 1 μg/dL. In the fully adjusted (model 3), the OR for severe CAC was 1.242 (95% CI, 1.008–1.531, P = 0.042), as BLL increased by 1 μg/dL. In all models, the OR for severe CAC significantly increased as the BLL increased (Table 5).
Table 5
ORs for severe coronary artery calcification (coronary artery calcium score ≥ 400) in association with a 1 μg/dL increase in blood lead level (subjects, n = 2,189)
| Models | OR | 95% CI | P value |
|---|---|---|---|
| Crude | 1.304 | 1.069–1.590 | 0.009 |
| Model 1 | 1.255 | 1.027–1.534 | 0.026 |
| Model 2 | 1.232 | 1.004–1.514 | 0.046 |
| Model 3 | 1.242 | 1.008–1.531 | 0.042 |
Model 1: adjusted for age and sex. Model 2: adjusted for age, sex, body mass index, exercise, smoking, and alcohol drinking. Model 3: adjusted for age, sex, body mass index, exercise, smoking, alcohol drinking, hypertension, diabetes mellitus, and dyslipidemia.
OR = odds ratio, CI = confidence interval.
DISCUSSION
We investigated the association between BLL and CAC using 128-channel dual-source coronary CT angiography. We found a significant correlation between BLL and CACS (r = 0.073, P < 0.001). Our analysis, with adjustments for confounders, yielded an OR for severe CAC (CACS ≥ 400) of 1.242 in association with a 1 μg/dL increase in BLL (95% CI, 1.008–1.531, P = 0.042). It is notable that the results were significant even though almost the entire group had BLLs below the reference value. Data from the National Health and Nutrition Examination Survey shows a substantial decline in BLL 12.8 μg/dL in 1976 to 2.8 μg/dL in 1991.15 As of 2016, the geometric mean BLL in the entire United States population has dropped to 0.820 μg/dL.16 The mean BLL among United States adults was 0.92 μg/dL in 2015–2016. Previously, the reference value for elevated BLL was 10 μg/dL; however, in 2015, the Adult Blood Lead Epidemiology & Surveillance program established 5 μg/dL as the new reference value.17 In the Republic of Korea, according to the Korea National Health and Nutrition Examination Survey data for 2010–2012, the mean BLL among individuals aged ≥ 10 years was 2.09 μg/dL.18 The geometric mean, median, and 95th percentile of BLL were 1.82 μg/dL, 1.83 μg/dL, and 3.78 μg/dL, respectively, among individuals 0–83 years of age in 2010 and 2011.19 In this study, 94.3% of the participants (2,064/2,189) had BLLs below the reference value of 5 μg/dL (arithmetic mean, 2.71 ± 1.26 μg/dL; range, 0.12–10.14 μg/dL). Our findings showed that elevated BLL is a risk factor for arteriosclerosis, even below the reference level. Compared with high-income countries, there are many areas in the world where lead exposure is poorly managed, highlighting the need for a global policy to reduce lead exposure.20
There have been many studies on the adverse health effects of lead, and some of them have investigated the effects of lead on the cardiovascular system. Menke et al.3 found that the association between BLL and increased all-cause and cardiovascular mortality was evident at low BLLs. Schober et al.21 had similar findings with a representative sample of the United States population whose members had BLLs as low as 5–9 µg/dL. In a previous study, BLL was positively associated with the prevalence of moderate to severe coronary artery stenosis among Korean adults who completed an elective screening examination for early CVD. Moderate to severe coronary artery stenosis was significantly associated with BLLs, with an adjusted OR for a 1 µg/dL increase in BLL of 1.14 (P = 0.017).22 In our study, it was confirmed that the relationship between the prevalence of CAC, CACS, and BLL was significant before and after adjusting for confounders. This will be sufficient evidence to support the conclusions presented in many studies on the relationship between lead exposure and CVD. To reduce the burden of CVD, policies and efforts are needed to reduce the general public's exposure to lead.
The mechanisms underlying the effects of BLL on CVD risk include a direct process involving damage to endothelial cells through inflammatory reactions. Inflammation plays an important role in CVD, especially atherosclerosis.23 Lead is involved in the inflammatory response through a variety of pathways, both at the level of gene expression and in the synthesis of pro-inflammatory proteins.24 Several experimental studies (through animal experiments and cultured cell experiments) have provided strong evidence that chronic lead exposure, even at low concentrations, causes vascular endothelial injury/dysfunction and atherosclerosis.25 Second, in an indirect process, lead raises blood pressure and leads to CVD. The pressure on the walls of blood vessels can damage vascular endothelial tissues and trigger atherosclerotic changes. Also, there is evidence that hypertension may cause oxidative stress on the arterial wall.2627 Several meta-analysis and review articles provide evidence for the association between BLL and elevated blood pressure.282930313233 Harlan et al.34 found a direct relationship between elevated blood pressure and BLL. In our study, BLL was also significantly correlated with systolic and diastolic blood pressure (r = 1.02 and r = 1.04, respectively, P < 0.001).
The strengths of this study included that it was the first study to analyze the correlation between CACS and BLL. A significant correlation was found. Secondly, the study targeted a large sample from the general population without symptoms or history of CVD (except for hypertension). The study sample was representative of the general Korean population, and the findings have strong statistical validity. Thirdly, risk factors that can affect arteriosclerosis—BMI, exercise, smoking, drinking, hypertension, diabetes mellitus, and hyperlipidemia—were well investigated. Another strength was that the relationship between BLL and CAC in healthy adults was confirmed through objective 128-slice coronary CT angiography results. Hoffmann et al.’s study35 yielded reliable results of multi-slice CT angiography compared with invasive coronary angiography (sensitivity 95%, specificity 98%, positive predictive value 87%, and negative predictive value 99%). In other similar studies, multi-slice CT angiography has been proven to be a valid test for predicting CVD.36373839 The present study provided more direct evidence to support the fact that lead may be involved in early CVD emergence.
This study had limitations, which must be acknowledged, including limitations associated with the cross-sectional study design and long study period. Although the study period was 8 years, the two radiologists who assessed the images to generate the findings did not change, nor did the coronary CT equipment. Notably, the study findings cannot be generalized because it included only participants who underwent voluntary health check-ups at a university hospital. Adjustments for socioeconomic variables could not be conducted because information on such variables was not obtained. Lead is environmentally widespread. Many socioeconomic variables contribute to increased BLL. Unhealthy living environments and contaminated water and food intake are pathways to lead exposure. 5% to 15% of lead ingested orally is absorbed into the body, and absorption increases further in poor nutritional conditions.40 Further research should include these variables.
This study confirmed a significant relationship between BLL and CACS and the prevalence of severe CAC using objective test results in a sample from the general population. The results support existing evidence of the relationship between lead exposure and CVD. Accordingly, even low levels of lead exposure should be strictly avoided or managed to prevent CVD.
 XML Download