

 PDF
PDF Citation
 Print
Print


INTRODUCTION
Seasonal influenza is an acute respiratory disorder affecting 5–10% of the adult population and 20–30% of children worldwide and resulting in 3–5 million cases of severe illness and 250,000–500,000 deaths every year.12 In the United States, the average socio-economic loss attributable to influenza was $11.2 billion in 2015.3 Globally, annual influenza-related respiratory mortality in 2002–2011 (excluding the 2009 pandemic year) was estimated as 5.9 per 100,000 individuals overall and 53.7 per 100,000 elderly individuals.4
Numerous studies have investigated mortality burden attributable to seasonal influenza using number of deaths and influenza cases from surveillance data per time interval.4 These time-series data are useful when estimating global mortality rates and excess mortality rates attributable to influenza, as they are available in many countries worldwide. However, because of the lack of comparable populations and information about underlying diseases, findings from these studies may not provide sufficient evidence supporting influenza prevention strategies. Furthermore, given that coinfection with influenza and other respiratory virus diseases, such as severe acute respiratory syndrome coronavirus 2, may further increase mortality risk,56 prioritization of influenza vaccination or other measures of prevention is mandatory to effectively mitigate mortality burden attributable to both infections. Although health protection agencies worldwide recommend lists of priority groups for influenza vaccination (e.g., individuals aged ≥ 65 years or with chronic diseases),7 there is little existing literature regarding the potential impact of influenza vaccination in these priority groups. In this context, mortality risk ratio (RR) and population attributable fraction (PAF) of mortality associated with influenza estimated from representative individual-level data can provide robust evidence for prioritization of influenza prevention measures in a population, as well as susceptible subpopulations.
A nationwide matched cohort of all patients with influenza and matched individuals without influenza can be used to estimate the probability of exposure (i.e., cumulative incidence of influenza) and mortality risk, thus allowing direct estimation of PAF. PAF may provide information about the potential population-level impact of influenza prevention, which is important for establishing evidence-based prevention strategies.
In this study, we used a national representative matched cohort to estimate the excess mortality rate and mortality RR of seasonal influenza, as well as PAF of mortality associated with this disease. We also estimated these mortality burden indicators in potentially susceptible groups based on age, sex, and underlying diseases.
METHODS
Data sources
For this study, we used a customized database of the National Health Insurance Service (NHIS) of the Republic of Korea.8 The NHIS system covers almost all of the Korean population, and its data include encrypted identification numbers, demographics (e.g., birth date, sex), and information regarding healthcare utilization (including date, International Classification of Diseases, 10th revision [ICD-10] codes, and visit type [outpatient or inpatient]).8 This database was linked to national mortality data obtained from Statistics Korea, which includes the date and cause of death.9
Study population
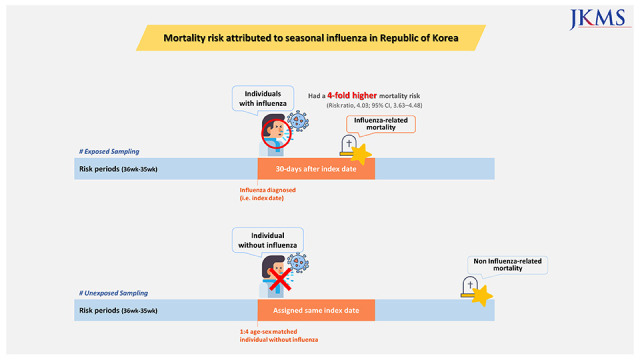
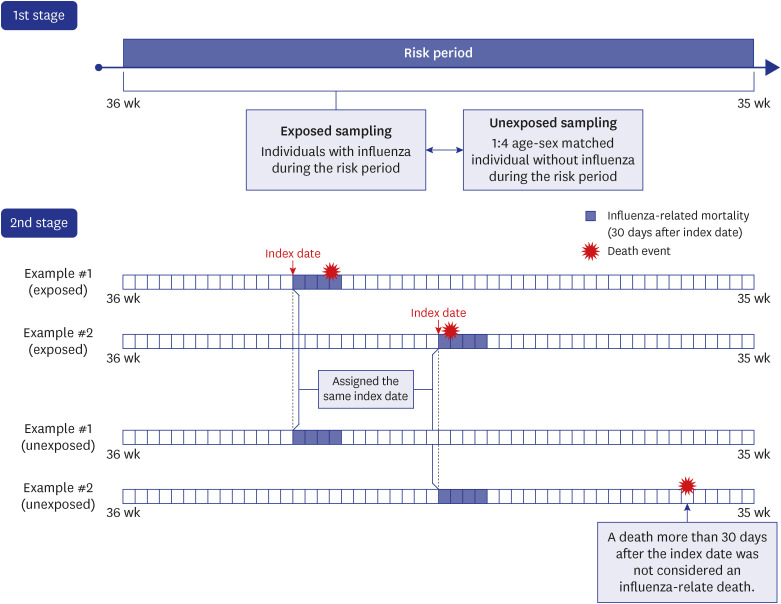
We constructed a retrospective matched cohort consisting of all individuals with the diagnosis of influenza and randomly selected individuals without influenza during four consecutive influenza seasons between 2013 and 2017: 2013/2014, 2014/2015, 2015/2016, and 2016/2017. Given that influenza typically circulates from October to May in the northern hemisphere, we defined an influenza season as the period from the 36th week of 1 year to the 35th week of the following year. To construct the cohort, we first identified individuals with ≥ 1 diagnosis codes for influenza (ICD-10 J09–J11.8 in the primary or secondary positions) during each influenza season (Supplementary Table 1) and then randomly selected four individuals matched for age (stratified in 5-year intervals) and sex among individuals with no influenza code during the same influenza season (Fig. 1). For individuals with influenza, the first diagnosis date was set as the index date. Individuals without influenza were assigned the same index date as the individual with influenza to whom they were matched.
Mortality
The endpoint was mortality within 30 days after the index date. Thirty days was chosen to focus on mortality associated with influenza, which is an acute infectious disease. Additionally, patients who died from an external cause (i.e., injuries) or unknown cause were excluded from this study, as the focus of our study was on non-accidental deaths. Codes for cause-specific mortality (respiratory, cardiovascular, cancer, renal, and neurologic mortality) are presented in Supplementary Table 2.
Comorbidities
Comorbidities were identified based on diagnostic codes (in the primary and secondary positions) during the 1-year period before the index date. We considered these underlying diseases: respiratory disease, cardiovascular disease, cancer, diabetes mellitus, renal disease, liver disease, and neurologic disease (Supplementary Table 3). Respiratory diseases were subcategorized as chronic obstructive pulmonary disease (COPD) or asthma. Cardiovascular diseases were subcategorized as myocardial infarction, hypertension, ischemic stroke, or hemorrhagic stroke. Individuals with ≥ 1 relevant code for each of the above disorders were considered to have the underlying disease. The Charlson comorbidity index (CCI) was calculated as the weighted sum of 17 comorbidities (myocardial infarction, cerebrovascular disease, chronic pulmonary disease, dementia, diabetes mellitus, cancer, and others).10 We also calculated the CHA2DS2-VASc score, a commonly used indicator for predicting the risk of stroke.11 This score consists of congestive heart failure, hypertension, age (≥ 75 years), diabetes mellitus, stroke, vascular disease, age (65–74 years), and sex (female).12 Stroke and age ≥ 75 years are assigned 2 points, whereas all other components are assigned 1 point. Based on CHA2DS2-VASc scores, the subjects were categorized as low risk (0 for males, 1 for females), moderate risk (1 for males, 2 for females), and high risk (≥ 2 for males, ≥ 3 for females).12
Statistical analyses
Chi-squared tests were used to investigate differences in characteristics between individuals with and without influenza. Excess mortality rate was calculated as the difference in crude mortality rates between groups. Given that influenza subtypes and their effects on mortality risk may differ between influenza seasons, we performed conditional logistic regression analyses separately for each influenza season and estimated the pooled mortality RR using a random effect meta-regression model. Subgroup analyses were performed after stratification by age group (≤ 19, 20–39, 40–64, and ≥ 65 years), sex, CCI (0, 1, 2, and ≥ 3), CHA2DS2-VASc score (low, moderate, and high risk), and underlying medical disorders (respiratory disease, cardiovascular disease, cancer, diabetes mellitus, renal disease, liver disease, and neurologic disease). The significance of differences in mortality RRs between subgroups was assessed using the Altman and Bland method,13 with predesignated reference groups (sex: male; age: ≤ 19 years; CCI: 0-point group; CHA2DS2-VASc score: low-risk group; underlying disease: respiratory disease).
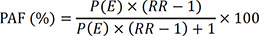
PAF of mortality associated with seasonal influenza was calculated using the mortality RR (crude RR) and cumulative incidence of seasonal influenza (i.e., proportion of individuals exposed to influenza). In the main analysis and subgroup analyses for age and sex, the cumulative incidence of seasonal influenza was calculated as the average number of individuals with influenza during the four influenza seasons divided by the total population of Korea in December 2015 (obtained from Statistics Korea). In the subgroup analyses for underlying diseases, the cumulative incidence of seasonal influenza was calculated as the average number of individuals with influenza among each underlying disease subgroup during the four influenza seasons divided by the number of individuals with each underlying disease (≥ 1 relevant diagnostic code) in December 2015 (obtained from NHIS). The 95% confidence interval (CI) of the PAF values was calculated using Monte-Carlo simulations (n = 1,000), while assuming that the underlying return distribution of PAF was binomial. We used the following formula to calculate PAF, with P(E) representing the proportion of individuals exposed to influenza:
We conducted a sensitivity analysis to address the possibility of risk overestimation arising from selecting individuals without influenza from the sample of people never diagnosed with influenza in each influenza season. This approach may have omitted individuals from the unexposed (i.e., individuals without influenza) group who did not have influenza at the index date, but who were diagnosed with influenza at a later date; this may have led to inflated mortality RR estimates. However, the number of these individuals may have been lower during the later part of each influenza season because the likelihood of becoming infected diminishes as the season progresses, such that the degree of risk overestimation may be reduced for later index dates. Thus, we estimated mortality RRs of seasonal influenza on a weekly basis between November and January in each influenza season. In this analysis, we first stratified the study population by the week of index date. Then, we constructed cumulative weekly subsets from November to January (forward analysis) and from January to November (backward analysis). Conditional logistic regression analyses (adjusted for CCI) were performed using each cumulative weekly subset separately in the forward and backward analyses. The variability of mortality RRs was depicted using the R package ggplot2. As an additional sensitivity analysis, we applied another algorithm to define influenza cases as ≥ 1 admission or ≥ 2 outpatient visits for influenza.
All statistical analyses were conducted using SAS version 9.4 (SAS Institute, Cary, NC, USA) and R statistical software (version 3.4.1; R Foundation, Vienna, Austria).
RESULTS
Study population characteristics
A total of 5,497,812 individuals with influenza and 20,990,683 matched individuals without influenza were identified for the 2013/2014 to 2016/2017 influenza seasons (Table 1). Among individuals with influenza, 53.7% were female and 62.8% were ≤ 19 years of age. The proportion of high-risk individuals (based on CHA2DS2-VASc score) was significantly higher in individuals with influenza than in those without influenza (7.1% vs. 4.1%, P < 0.001).
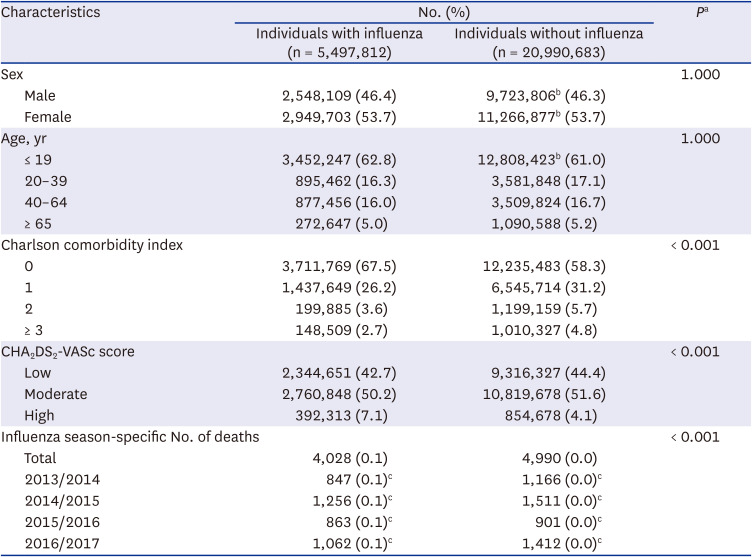
Table 1
Characteristics of the study population
aSignificance of differences between groups based on the χ2 test.
bA 1:4 matching ratio was not achieved for the 0–9 years group in the 2015/2016 and 2016/2017 seasons because of the small sample size.
cProportion of exposed and unexposed numbers in each season.
![]()
Excess mortality rate and mortality RR of seasonal influenza
The all-cause mortality rate was 73.3 per 100,000 persons in individuals with influenza and 23.8 per 100,000 persons in those without influenza (Table 2). The excess all-cause mortality rate attributable to influenza was 49.5 per 100,000 persons. Individuals with influenza had a higher risk of all-cause mortality than those without influenza (adjusted RR, 4.03; 95% CI, 3.63–4.48). Among cause-specific mortality categories, respiratory mortality yielded the highest excess mortality rate (30.0 per 100,000 persons) and adjusted RR (12.85; 95% CI, 9.40–17.55). Cardiovascular mortality exhibited an excess mortality rate of 5.8 per 100,000 persons and an adjusted RR of 2.28 (95% CI, 2.04–2.55). For renal diseases, the excess mortality rate was 1.2 per 100,000 persons, and the adjusted RR was 5.29 (95% CI, 3.01–9.31).
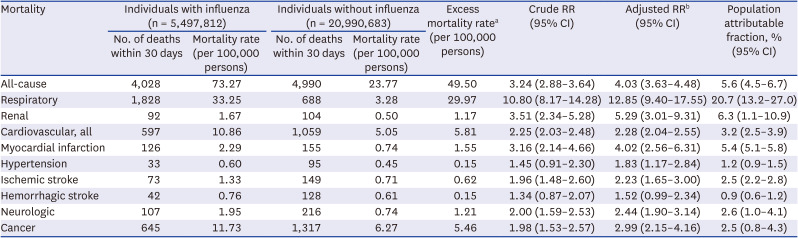
Table 2
Excess mortality rate, mortality RR, and population attributable fraction of mortality for seasonal influenza (2013/2014 to 2016/2017) in the Republic of Korea
CI = confidence interval, RR = risk ratio.
aDifference in mortality rates between individuals with and without influenza.
bAdjusted for Charlson comorbidity index.
![]()
PAF of mortality associated with seasonal influenza
PAF of influenza-associated all-cause mortality was 5.6% (95% CI, 4.5–6.7) (Table 2). Among cause-specific mortality categories, the highest PAF was observed for respiratory diseases (20.7%; 95% CI, 13.2–27.0%), followed in descending order by renal diseases, cardiovascular diseases, neurologic diseases, and cancer.
Mortality RR and PAF in subgroups
The increased RR of all-cause mortality associated with influenza was statistically significant in all age groups, except the ≤ 19 years group (Fig. 2). RR of all-cause mortality was highest in the ≥ 65 years group (3.64; 95% CI, 3.20–4.13). After stratification by underlying diseases, RR of all-cause mortality was highest in individuals with renal disease (RR, 3.56; 95% CI, 2.37–5.34), followed by cardiovascular disease (RR, 3.33; 95% CI, 3.13–3.53), diabetes mellitus (RR, 3.25; 95% CI, 2.87–3.68), liver disease (RR, 3.11; 95% CI, 2.48–3.91), respiratory disease (RR, 3.09; 95% CI, 2.92–3.27), neurologic disease (RR, 2.88; 95% CI, 2.60–3.20), and cancer (RR, 2.34; 95% CI, 1.86–3.07).

Fig. 2
RRs of all-cause mortality in individuals with influenza. Estimates are crude RRs derived from conditional logistic regression models.
CI = confidence interval, COPD = chronic obstructive pulmonary disease, RR = risk ratio.
aSignificantly different from the reference group (sex: male; age group: ≤ 19 years; Charlson comorbidity index: 0-point group; CHA2DS2-VASc score: low-risk group; underlying disease: respiratory disease).
![]()
PAF of influenza-associated all-cause mortality was highest in the ≥ 65 years age group (2.6%; 95% CI, 2.5–2.7%) (Table 3). After stratification by underlying diseases, PAF of influenza-associated all-cause mortality was highest in individuals with liver disease (5.9%; 95% CI, 0.6–10.7%), followed by respiratory disease (5.8%; 95% CI, 2.9–8.5%), cancer (3.8%; 95% CI, 1.4–6.1%), renal disease (2.1%; 95% CI, 0.2–3.9%), cardiovascular disease (2.0%; 95% CI, 1.4–2.6%), diabetes mellitus (1.8%; 95% CI, 1.1–2.6%), and neurologic disease (1.8%; 95% CI, 1.0–2.6%).
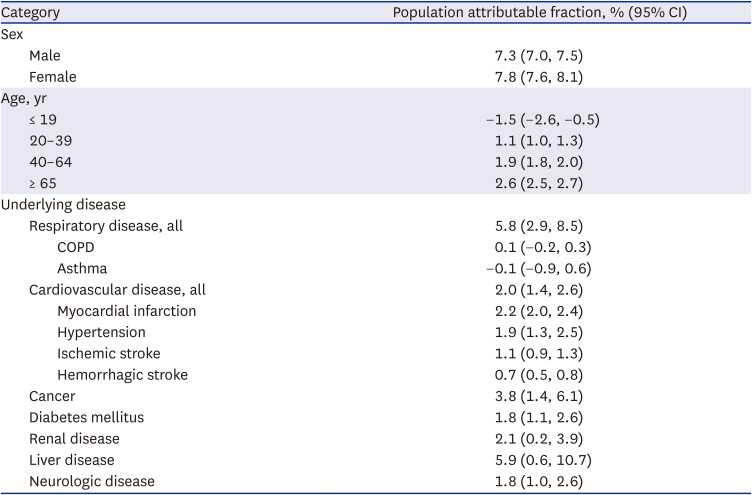
Table 3
Population attributable fraction of mortality associated with seasonal influenza (2013/2014 to 2016/2017) by subgroups
![]()
Sensitivity analysis
The sensitivity analysis applying the stricter definition of ≥ 1 admission or ≥ 2 outpatient visits for influenza included 2,682,532 individuals with influenza and 10,169,551 matched individuals without influenza (Supplementary Table 4). There were no notable differences in mortality RRs between the main analysis and sensitivity analysis (Supplementary Fig. 1).
In the sensitivity analyses examining the variability of mortality RRs, mortality RRs during the 2016/2017 season decreased in January in the forward analysis and increased in November in the backward analysis (Supplementary Fig. 2). Mortality RRs were stable in all other seasons (2013/2014, 2014/2015, and 2015/2016) (Supplementary Figs. 2 and 3).
DISCUSSION
This study is the first to compare 30-day mortality risk between individuals with influenza and age- and sex-matched individuals without influenza from a nationwide cohort in the Republic of Korea. We found that for influenza-associated all-cause mortality, the excess mortality rate, mortality RR, and PAF were 49.5 per 100,000 persons, 4.03, and 5.6%, respectively. Respiratory mortality yielded the highest mortality RR and PAF attributable to influenza, followed by renal mortality, cardiovascular mortality, and neurologic mortality. After stratification by underlying diseases, PAF of all-cause mortality was highest in individuals with liver disease, followed by respiratory disease, cancer, and myocardial infarction. After stratification by age, the elderly exhibited the highest risk of all-cause mortality attributable to influenza.
Numerous studies have reported excess mortality rates attributable to influenza. A study in China found that the excess mortality rate attributable to influenza was 14.3 per 100,000 people from 2005 to 2019.14 In the United States, the all-cause mortality rate attributable to influenza was 11.8 per 100,000 deaths during the 1997/1998 to 2006/2007 seasons.15 A recent study reported that the excess mortality rate attributable to influenza was 10.6 per 100,000 persons during the 2009/2010 to 2015/2016 seasons in Korea.16 In the current study, the excess mortality rate attributable to influenza during the four seasons from 2013/2014 to 2016/2017 was 49.5 per 100,000 persons. These estimates were much higher than those of previous studies. Although several factors such as demographics and healthcare system may have affected excess mortality, the time-series study from the Republic of Korea reported similar estimates to those from USA.15 Considering that our estimates were higher than those from the time-series study from the same country, the discrepancy in estimates between the previous studies and our study may be mainly due to different study methodologies.16 The previous studies were based on time-series data, including weekly influenza surveillance data and time-aggregated mortality data, which are easy to obtain but likely to undermine the validity of the estimates. By contrast, our study used individual-level data of influenza diagnosis linked to national mortality data. Although this individual-level approach is time-consuming and costly, it provides more valid estimates of mortality burden, which are important for establishing effective strategies to mitigate the mortality burden attributable to influenza. In addition, the present study used 30-day mortality after an influenza diagnosis to examine influenza-related mortality on an individual basis. This approach may have led to higher estimates, when compared with time-series studies using ecological data.
Among cause-specific mortality categories, respiratory mortality yielded the highest excess mortality rate (29.97 per 100,000 persons), mortality RR (12.85), and PAF of mortality (20.7%). For renal mortality, the excess mortality rate was only 1.2 per 100,000 persons, but the mortality RR (5.29) and PAF of mortality (6.3%) were the second highest. Cardiovascular mortality and cancer mortality exhibited similarly high excess mortality rates (5.8 and 5.5 per 100,000 persons, respectively), although their PAFs of mortality were moderately high (3.2% and 2.5%, respectively). Respiratory mortality is a well-known leading cause of mortality attributable to influenza. The global estimate of influenza-associated excess respiratory mortality rate was 53.7 per 100,000 persons during 2002–2011 (excluding the 2009 pandemic year).4 By contrast, little is known about the risk of renal mortality in patients with influenza. Only indirect evidence has been reported, which showed that seasonal influenza was associated with a 98% increase in renal mortality.17 This is plausible since influenza virus can directly damage muscle and thereby increase circulating levels of myoglobin, leading to acute renal failure.18 Additionally, severe influenza infections can lead to multiple organ dysfunction syndrome, with renal failure.19
In this study, we evaluated the effects of a variety of underlying medical disorders: respiratory disease, cardiovascular disease, cancer, diabetes mellitus, renal disease, and neurologic disease. Individuals with each of these disorders had a significantly increased risk of influenza-associated mortality. In particular, PAF of mortality associated with influenza was highest in individuals with liver disease (5.9%). Given that liver disease is a risk factor for all-cause mortality among individuals with influenza,20 our finding highlights the need for individuals with liver disease to be considered a priority group for influenza vaccination. The risk of mortality associated with seasonal influenza was also significantly higher in all subgroups of CCI. It is noteworthy that the 2-point CCI group exhibited a significantly higher risk than the 0-point group (P for interaction = 0.01), whereas the ≥ 3-point group had a risk estimate for mortality similar to that of the 0-point group. The ≥ 3-point CCI group likely included patients with severe health conditions or terminal diseases, which may have overshadowed the effects of influenza on mortality. After stratification by CHA2DS2-VASc score, the risks of mortality associated with seasonal influenza were similarly increased in all subgroups. In contrast, we observed null findings in subpopulations with chronic respiratory diseases (COPD and asthma), who are at high risk of influenza infection. This might be due to proactive influenza vaccination and antiviral medication in patients with COPD and asthma. Recent studies showed that the vaccination rate of individuals with asthma was 64.3%, and individuals with COPD was 61.2%.2122 In a previous study, individuals with asthma had the highest rate of prescription of antiviral medications among influenza patients (74% in men and 71% in women).23 Among individuals with COPD, the proportion of patients who received antiviral medications was 58% in men and 57% in women.23 Moreover, frequent healthcare visits may have reduced the number of influenza-related deaths by preventing progression to severe influenza through continuous management in individuals with COPD and asthma.2425
Our results highlight the need for proactive influenza vaccinations in individuals with underlying diseases, as influenza infections can exacerbate underlying diseases and lead to death.262728 We also found that the mortality risk associated with influenza was significantly higher in all age groups except the ≤ 19 years group. In particular, the RR was highest in individuals aged ≥ 65 years (RR, 3.64), followed by those aged 40–64 years (RR, 2.79). It is well known that older adults with influenza are susceptible to death. Elderly people have a higher likelihood of chronic diseases, which can worsen with influenza infection, leading to gradual deterioration of cardiovascular, lung, and renal function.2629 Collectively, our results support the need for individuals with underlying diseases and the elderly to be prioritized when planning influenza vaccination strategies to mitigate influenza complications and mortality.30
Our study has several methodologic strengths. We used a nationwide database (healthcare utilization data linked to mortality data) covering almost the entire population in the Republic of Korea. We also reported PAF of mortality associated with seasonal influenza by constructing a cohort in which the cumulative incidence of influenza was estimated. Furthermore, we considered a variety of underlying diseases and adjusted for comorbidities (CCI) when estimating mortality RRs.
Several limitations should also be noted. First, there is a possibility of misclassification of influenza cases, as we used diagnostic codes to define these cases. However, the temporal trend of number of influenza cases in our database and the trend in the influenza-like illness data (from the Korea Disease Control and Prevention Agency) were not markedly different (Supplementary Fig. 4). In addition, we conducted a sensitivity analysis using a stricter influenza definition (≥ 1 admission or ≥ 2 outpatient visits for influenza), which generated results similar to those of the main analysis (Supplementary Fig. 1). Second, asymptomatic individuals with influenza may have been included in individuals without influenza. A meta-analysis of 30 studies reported that 16% of influenza infections are asymptomatic.31 In the current study using healthcare utilization data, it was not possible to identify asymptomatic patients, but the same drawback occurs with influenza surveillance data. Furthermore, individuals without influenza were randomly selected from the nationwide pool of approximately 50 million people in the NHIS database. Hence, this issue may not have distorted our results. Third, the PAF values should be interpreted with caution because of unmeasured confounders, such as influenza vaccination status. Specifically, PAF of mortality associated with seasonal influenza may have been underestimated in the subgroup analyses for underlying diseases because of high influenza vaccination rates in individuals with these diseases. The Korea Disease Control and Prevention Agency launched an influenza vaccination program for various priority groups in 1997, and the influenza vaccination rate reached 88% of older individuals with chronic diseases in 2016 (vs. 35% in the general population).3233 This high rate of influenza vaccination in individuals with chronic diseases may have reduced the number of influenza-related deaths.34 Nonetheless, the higher risks of mortality associated with influenza remained significant in most subpopulations with underlying diseases, suggesting that there remains a need for further proactive influenza prevention. Fourth, cause-specific mortality risk was not evaluated in subgroups with underlying diseases due to small sample size. In this study, people with underlying diseases were identified after sampling individuals with and without influenza. Future studies are required to sample influenza cases and comparable controls after constructing a disease-specific cohort. Finally, the present study did not use prescription data of antiviral medications. We estimated the risk of influenza-related mortality by comparing mortality between individuals with and without influenza diagnosis, and those without influenza are highly unlikely to receive antiviral treatment for influenza. Taking the resulting collinearity issue into account, we did not attempt to consider antiviral medication as a covariate.
In conclusion, we demonstrated that individuals with seasonal influenza had a 4-fold increased risk of 30-day mortality. PAF of mortality associated with seasonal influenza was 5.6%, suggesting that successful vaccination programs may lead to an almost 6% decrease in all-cause mortality during influenza seasons. Our results also indicate that a variety of underlying disorders (including respiratory disease, cardiovascular disease, cancer, diabetes mellitus, renal disease, liver disease, and neurologic disease) still need to be considered in strategic planning influenza vaccination programs.
 XML Download