Journal List > Clin Exp Otorhinolaryngol > v.16(2) > 1516082873

Oh, Cho, Lee, Shin, and Choi: Characteristics of Hearing Loss Among Older Adults in the Korean Genome and Epidemiology Study: A Community-Based Longitudinal Cohort Study With an 8-Year Follow-up

Abstract

Objectives.

This study investigated the 8-year incidence and progression of hearing loss (HL) and its types and examined the risk factors for changes in HL.

Methods.

This longitudinal cohort study analyzed data from the Korean Genome and Epidemiology Study (KoGES), an ongoing, prospective, community-based cohort study that has been conducted since 2001. Altogether, 1,890 residents of urban areas in Korea aged 45–75 years at time 1 (baseline) were included in the study. Pure-tone audiometry (PTA) testing was performed twice, at time 1 (2008–2009) and time 2 (2015–2018, follow-up), 8 years apart. HL grades were defined as seven mutually exclusive categories following the revised World Health Organization classification. Incidence was defined as PTA >20 dB HL in the better ear at time 2 among those without HL at time 1. Progression was defined as the progressive deterioration of HL among those with HL at time 1. The three types of HL constituted sensorineural (SNHL), conductive, and mixed HL.

Results.

At time 1, 36.40% of patients were diagnosed with HL, which increased to 51.64% at time 2. The 8-year incidence of HL was 27.20%, and progressive deterioration of HL occurred in 23.11% of those with HL. SNHL was the most common type of HL, and its prevalence markedly increased at time 2. Multivariate analysis demonstrated that the incidence of HL was significantly associated with increasing age, male sex (odds ratio [OR], 1.73; 95% confidence interval [CI], 1.07–2.81), and diabetes mellitus (OR, 1.43; 95% CI, 1.04–1.96). Alcohol consumption was a risk factor for HL deterioration among those with HL at time 1.

Conclusion.

The prevalence and deterioration of HL were extremely high among older adults, and age was the strongest risk factor for these changes. Therefore, timely screening and intervention are necessary to prevent HL and delay its deterioration among older adults.

INTRODUCTION

Hearing loss (HL) is a common problem associated with aging, affecting more than 1.57 billion people worldwide in 2019. It is estimated that one in four people will experience some degree of HL by 2050 [1]. Among older adults, HL has been associated with cardiovascular risk factors including hypertension (HTN), smoking, diabetes, obesity, noise exposure, and the shape of the ear canal [2,3]. HL affects all-cause mortality and the number of years living with disability [4-6]. HL is also associated with mental health problems, such as anger, anxiety, social isolation, depression, and suicidal ideation [7,8]. Numerous studies have found significant links between HL and cognitive decline, such as dementia [9,10]. Due to population aging, HL is becoming a social problem affecting quality of life [11]. Many studies have reported that the prevalence and severity of age-related HL in men are higher, and the age of onset is younger, than in women because men have more occupational exposure to noise [12,13]. However, a recent study found considerably less difference between sexes than had been reported in previous studies [14]. Even taking into account differences in noise exposure between men and women, a significant sex difference remains in hearing sensitivity, with women showing more high-frequency (above 3,000–4,000 Hz) hearing sensitivity than men [15]. Since HL progresses gradually among older adults, it is difficult to detect its symptoms, especially in the early stage [16]. However, the World Health Organization (WHO) advocated that early screening for HL is essential to prevent HL and mitigate its adverse impacts [17]. Previous studies were mainly cross-sectional [18-20], and few longitudinal studies have examined the incidence and progression of HL over time among older adults.
This study investigated the incidence and progression of HL among older adults and aimed to establish causal relationships between socioeconomic and health-related risk factors and HL in a community-based longitudinal cohort study with an over 8-year follow-up.

MATERIALS AND METHODS

Study population

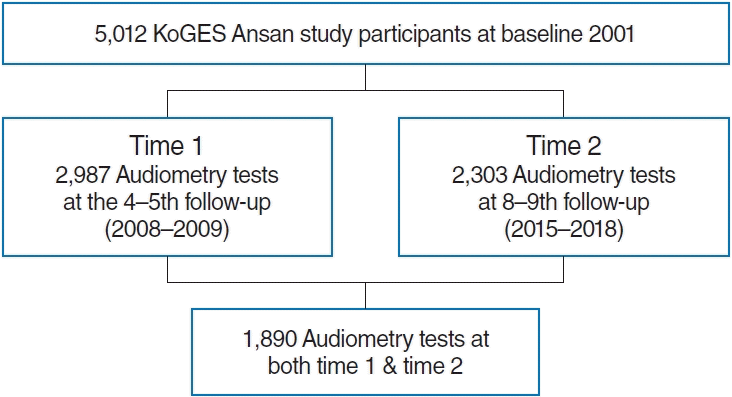
This study was part of the Korean Genome and Epidemiology Study (KoGES), which has been an ongoing, prospective, community-based cohort study since 2001. Participants were residents of urban (Ansan city) and rural (Ansung city) areas in Korea. In 2001, 10,038 participants aged 40–69 years voluntarily enrolled in the study, and a biennial follow-up health examination and questionnaire survey were conducted. Detailed information on the study design, procedures, and retention rate has been published previously [21]. Pure-tone audiometry (PTA) testing was additionally conducted for the participants from Ansan city (n=5,012) at the 4–5th follow-up (2008–2009) and 8–9th follow-up (2015–2018). The present study included 1,890 participants who completed PTA testing at the 4–5th follow-up (time 1, baseline) and 8–9th follow-up (time 2, follow-up) as depicted in Fig. 1.
This study was approved by the Institutional Review Board of Korea University Ansan Hospital (No. 2006AS0045), and informed consent was obtained from each participant.

Data collection

In this longitudinal study, we utilized three different types of data: (1) two repeated PTA tests, (2) an interviewer-administered KoGES questionnaire, and (3) physical health examination results. Audiometric testing was performed by special audiologist following Korean Audiological Society guidelines. Pure tone air (125, 250, 500, 1,000, 2,000, 3,000, 4,000, 8,000 Hz) and bone conduction (250, 500, 1,000, 2,000, 3,000, 4,000 Hz) audiometry was measured using a Grason-Stadler GSI 61 audiometer with Telephonics TDH 50P headphones (Grason-Stadler) in a double-walled sound booth.

Grades and type of HL

HL grades were defined in seven mutually exclusive categories: normal hearing (0–19 dB), mild (20–34 dB), moderate (35–49 dB), moderately severe (50–64 dB), severe (65–79 dB), profound (80–94 dB), and complete (95+ dB) HL. We adopted the WHO’s revised classification recommended by the Global Burden of Disease Expert Group, which showed good validity [22]. A fourfrequency PTA frequency of 500, 1,000, 2,000, and 4,000 Hz was used with a better-hearing ear. We classified six groups to assess the changes in HL between time 1 and 2 audiometry testing over 8 years. These groups included (1) those who retained their normal hearing at time 1 and 2; (2) the incidence group who had normal hearing at time 1 but experienced HL at time 2; (3) those who stayed with the same grade of HL over time; (4) those who experienced one-level deterioration of HL; (5) those who experienced deterioration of HL by more than two grade levels; and (6) other groups (e.g., improved HL at time 2). In the present study, three types of HL were classified: sensorineural HL (SNHL) which is a combination of the dysfunction of the cochlea and auditory nerve, was defined when air and bone conduction were >20 dB, and the difference between air and bone conduction was ≤10 dB. Conductive HL (CHL) which occurs when sounds cannot be transmitted through the outer and middle ears into the inner ear was defined when air conduction was ≥20 dB, bone conduction was normal, and the difference between air and bone was >10 dB. Finally, when air-conduction thresholds are elevated relative to abnormal bone conduction thresholds (resulting in an air-bone gap), the loss is classified as mixed HL (MHL).

Other measures

Several chronic diseases were included; HTN was defined as either systolic blood pressure (BP) ≥140 mmHg or diastolic BP ≥90 mmHg, self-reported antihypertensive drug use or diagnosed by a physician. Diabetes mellitus (DM) was defined as high fasting blood glucose ≥126 mg/dL, hemoglobin A1c (HbA1c) ≥6.5% (48 mmol/mol), self-reported antidiabetic or insulin use, or diagnosis by a physician. The diagnosis of chronic kidney disease (CKD) was defined as an estimated glomerular filtration rate of <60 mL/min/173 m2 following the National Foundation Kidney Disease Outcomes Quality Initiative guideline. The presence of cardiovascular disease (CVD) was confirmed by a self-report questionnaire. Demographic covariates included age, sex, educational level, and income. In addition, body mass index (BMI; kg/m2), physical activity measured by a metabolic equivalent of task (MET) [23], alcohol intake (never vs. former/current), and smoking status (never vs. former/current) were also included.

Statistical analysis

First, we described the basic sociodemographic characteristics, lifestyle factors, and comorbidities of the participants at baseline. Continuous variables are expressed as mean±standard deviation, and categorical variables are expressed as numbers (percentages). Second, we assessed the grades of HL for the right, left, and better ears separately at each time point. We also evaluated the prevalence of HL type at each time point. The comparison between time 1 and 2, between the right and left ears, was tested using the Rao-Scott chi-square test. Lastly, we conducted a logistic regression analysis to test the associations between the main variables of interest and the incidence as well as deterioration of HL. All tests were two-tailed, and P-values <0.05 were considered to indicate statistical significance. Data analyses were performed using the SAS software (SAS Institute, Inc.).

RESULTS

Table 1 displays the participants’ characteristics. The mean age was 55.16 years, with a range of 45–75 years. Approximately half of the participants (49.37%) were men. Furthermore, 30.81% participants were middle school graduates, while 69.19% had completed higher education beyond high school. About half of the participants (49.31%) reported having a middle level of monthly income (approximately $1,500–$4,000) Of the participants, 1,174 (62.12%) were never-smokers, and 922 (48.95%) were never-drinkers. The mean BMI was 24.61 kg/m2, and 42.49% were obese according to the WHO Asia-Pacific standard of 25 kg/m2. The mean MET score was 188.52. Regarding past history, 4.92%, 35.87%, 24.55%, and 3.70% of participants had CVD, HTN, DM, and CKD respectively.

Grades and types of HL at time 1 and time 2

Table 2 shows the grades and types of HL for each period. Using the better ear, 63.60% of the participants had normal hearing at time 1, while 36.40% experienced HL (mostly mild). At time 2, the proportion of participants with normal hearing decreased from 63.60% to 48.36%. The difference in HL grades between times 1 and 2 was statistically significant (P<0.001). A significant difference in the frequency of HL was found between the right and left ears at time 1 (46.46% vs. 47.57%, P<0.001). This discrepancy between the right and left ears also remained at time 2 (59.15% vs. 61.32%, P<0.001). Regarding the type of HL, SNHL and CHL were almost equally distributed at time 1 (45.38% and 42.18% for the right ear and 39.35% and 42.59% for the left ear, respectively). The MHL group accounted for the smallest proportion among ears with HL (12.44% for the right ear and 18.06% for the left ear). This pattern changed dramatically at time 2. with the proportion of SNHL increasing noticeably, reaching 83.30% of right ears with HL and 75.52% of left ears with HL. Compared to time 1, the proportions of both the CHL and MHL groups decreased while SNHL increased.

Changes in HL over time

Among those without HL at time 1, 72.80% (875/1,202) maintained normal hearing at time 2 (Table 3). Regarding HL incidence at time 2, 27.20% (327/1,202) of participants were newly diagnosed with HL; most developed mild HL (97.55%, 319/327), with only a few having either moderate or moderate-to-severe HL (2.45%, 8/327). Among those with HL at time 1, 70.06% (482/688) remained at the same HL level at times 1 and 2. This indicates that among the total study participants, 72.06% (1,362/ 1,890) had no change in HL grade over time. While some people experienced worsened HL by 1 grade, such as mild to moderate HL or moderate HL to moderate-to-severe HL (n=152, 21.95%), only a few people (n=8, 1.16%) experienced deterioration of HL by 2 or 3 grades. Furthermore, 47 participants (47/1,890, 6.83%) had an improved grade of HL, which might be attributed to slight hearing fluctuations during the examinations, especially around the boundaries of mild HL.
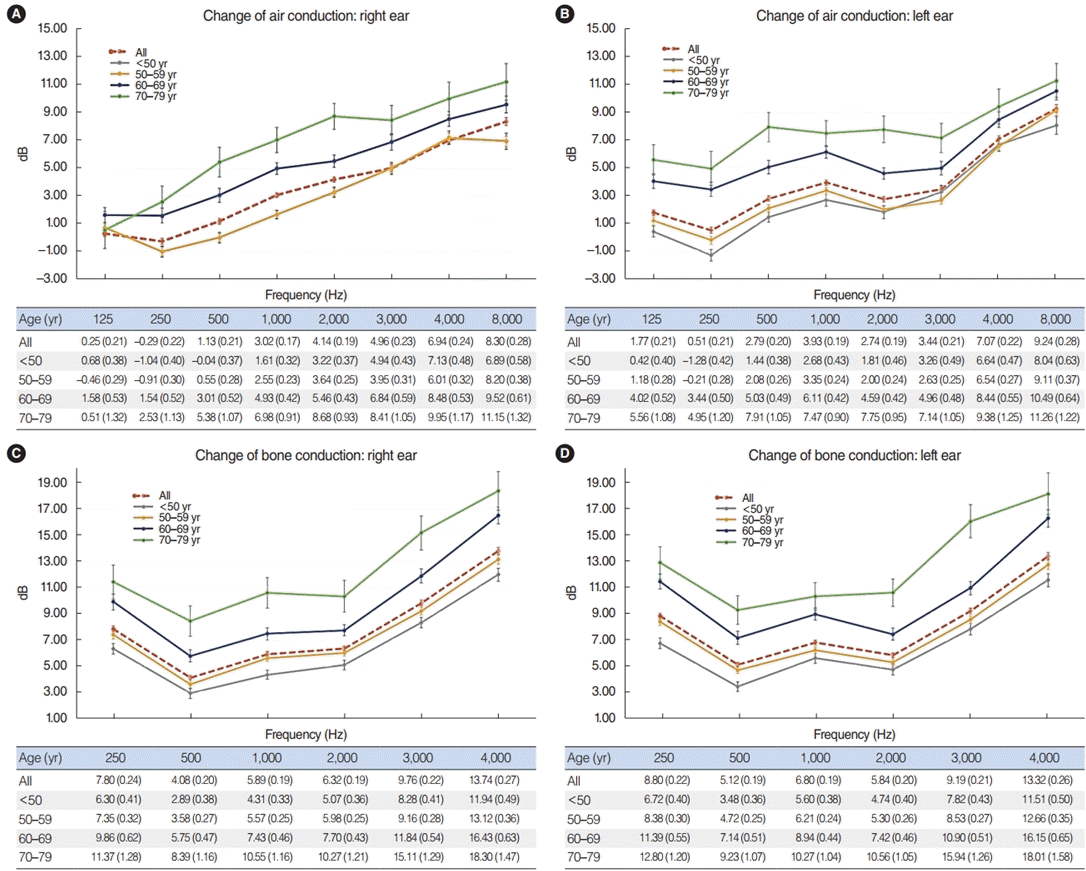
Fig. 2 demonstrates the differences in pure tone thresholds between times 1 and 2 for air conduction and bone conduction measured from 125 to 8,000 Hz, displayed for each age group. Older age was associated with a greater change in the hearing threshold between times 1 and 2. The loss in both the right and left ears increased as the frequency of PTA increased. Regarding the change in air conduction, the hearing deterioration at 8,000 Hz was 8.30 dB and 9.24 dB in the right and left ears, respectively (Fig. 2A and B). Regarding bone conduction, the HL at 4,000 Hz was 13.74 dB and 13.32 dB in the right and left ears, respectively. (Fig. 2C and D). We also found a significant linear relationship between HL and age group; with older age, hearing deteriorated more at all frequencies over time (Fig. 2). Detailed information is provided in Table 4.

Risk factors for HL

Table 5 shows the results of the logistic regression analyses for (1) the incidence of HL among those who had normal hearing at time 1 and (2) the deterioration of HL among those who had already developed HL at time 1. We also added information about the characteristics of the main predictors, comparing those who developed HL and those who stayed at the same grade to those who experienced deterioration in HL over time. The incidence of HL at time 2 was significantly associated with increasing age, with odds ratios (ORs) of 7.24, 3.44, and 1.41 among those aged >70, 60–69, and 50–59 years, respectively, compared to young adults (aged <50 years). A higher OR was observed among men (OR, 1.73; 95% confidence interval [CI], 1.07–2.81), whereas educational level, income level, smoking, alcohol use, BMI, physical activity, CVD, CKD, and HTN were not related to the incidence of HL. However, there was a 43% greater risk of developing HL in participants previously diagnosed with DM than in those without DM. Furthermore, we performed an additional analysis to identify risk factors for HL deterioration among participants who already had HL at time 1 compared to participants who stayed at the same HL grade. Compared to adults who were aged <50 years, older age was associated with a significantly higher risk (OR: 5.35 for >70 years, 3.04 for 60–69 years, 1.65 for 50–59 years). An association between alcohol use and HL deterioration was found (OR, 1.74; 95% CI, 1.06–2.85).

DISCUSSION

In this longitudinal, community-based study of adults aged 45–75 years at time 1, we examined the incidence and progression of HL over time, approximately 8 years apart. At time 1, approximately 63.60% of older adults had normal hearing, which decreased to 48.36% at time 2. Approximately 72.80% of the participants maintained normal hearing over time, and the 8-year incidence of HL was 27.20% (327/1,202) (Table 3). The incidence rate in our study seems consistent with those reported in previous studies, such as 21% reported in a 5-year longitudinal community-based U.S. study [13], 17.9% among the older Australian population [24], and 23.5% among the older Danish population [25]. Among participants with HL at time 1, 70.06% (482/688) showed no change in hearing level, and 23.26% (160/688) had a progressively lower grade of HL over time, which was similar to the rate of HL incidence in people with normal hearing (27.20%). Compared to time 1, the proportion of patients with SNHL dramatically increased by time 2, while those of the CHL and MHL groups decreased. We also found differences between the right and left ears (P<0.001), indicating that the proportion of normal hearing in the right ear was slightly higher than in the left ear (53.54% vs. 52.43% at time 1; 40.85% vs. 38.68% at time 2). We found a higher proportion of SNHL in the right ear than in the left ear. However, a study on a random population in Finland reported that hearing in the left ear was poorer at high frequencies in adults [26].
First, we found that age was significantly associated with both the incidence and progression of HL, which is consistent with previous findings of accelerated progression with older age [27,28]. Second, we found that sex was associated with the incidence of HL (P=0.03) but not with the deterioration of HL once it had already been diagnosed (P=1.00). Several studies have found sex differences in the prevalence of HL, the rate of change in PTA, and hearing sensitivity, indicating that men had more highfrequency (above 3,000–4,000 Hz) HL than women [15]. However, it was recently reported that the sex difference in HL was much lower than that reported in previous studies [14], warranting further detailed investigation, which is underway.
Third, this study found that socioeconomic variables and anthropometric measures, such as BMI and physical activity, were not associated with HL. This finding is inconsistent with earlier studies reporting that the prevalence of HL in older adults was related to socioeconomic status and educational level [15] or smoking [29]. We assume that this difference was due to changes in environmental and lifestyle factors. However, alcohol consumption was a risk factor for HL deterioration once HL was diagnosed.
Our study has some limitations. First, the effect of noise exposure, which is substantially related to HL, was not fully considered. However, we included an occupational variable to control for this effect. Second, middle ear conditions such as tympanic membrane perforation and otitis media were not analyzed in the current study. Nevertheless, this study has several strengths. To our knowledge, this is the first study to examine risk factors comparing older adults with the same level of HL to those with HL deterioration. Our study also provided definitions of HL types and demonstrated changes in the types over time. Instead of self-reported data, our study included the results of physical examinations from a population-based sample. Therefore, the high prevalence of HL and high deterioration rates among older adults in the present study indicate that early screening and monitoring of PTA changes are strongly required among older adults. Different risk factors for the onset and deterioration of HL also imply the need for different prevention strategies according to sex, age, and level of HL. In conclusion, we found an 8-year incidence rate of 27.20% for HL among the older population, and HL incidence was associated with age, male sex, and DM. In those who already had HL, 70.06% showed no change, while 23.26% showed progressive worsening of HL over time, which was associated with alcohol consumption. Regarding air conduction, hearing deterioration of 8.30 dB in the right ear and 9.24 dB in the left ear at 8,000 Hz was observed. For bone conduction, HL of 13.74 dB in the right ear and 13.32 dB at 4,000 Hz in the left ear was recorded.

HIGHLIGHTS

▪ At baseline, 36.40% of patients in the Korean Genome and Epidemiology Study (KoGES) cohort were diagnosed with hearing loss (HL) in the better ear.
▪ The 8-year incidence of HL was 27.20% in the KoGES cohort.
▪ Progressive deterioration occurred in 23.11% of those with HL during an 8-year follow-up.
▪ HL incidence was significantly associated with increasing age.
▪ A higher odds ratio (OR) was observed for men (OR, 1.73; 95% confidence interval, 1.07–2.81).

Notes

No potential conflict of interest relevant to this article was reported.

AUTHOR CONTRIBUTIONS

Conceptualization: KHO, HC, CS, JC. Methodology: KHO, HC, SKL, CS, JC. Formal analysis: KHO, HC, SKL, CS, JC. Data curation: HC, SKL, CS. Visualization: KHO, HC, CS, JC. Project administration: KHO, HC, CS, JC. Funding acquisition: KHO, HC, CS, JC. Writing–original draft: KHO, HC, CS, JC. Writing–review & editing: KHO, HC, SKL, CS, JC.

ACKNOWLEDGMENTS

This research was supported by funds (2008-E71001-00, 2009-E71002-00, 2015-P71001-00, 2016-E71003-00, 2017-E71001-00, and 2018-E7101-00) from the Korean Centers for Disease Control and Prevention and (K2023071, K2212081 and K2210 761) from Korea University grants. In addition, this study was supported by the MSIT (Ministry of Science and ICT), Korea, under the ICAN (ICT Challenge and Advanced Network of HRD) program (IITP-2022-RS-2022-00156439) supervised by the IITP (Institute of Information & Communications Technology Planning & Evaluation).

REFERENCES

1. World Health Organization. WHO: 1 in 4 people projected to have hearing problems by 2050. World Health Organization;[cited 2023 April 10]. Available from: https://www.who.int/news/item/02-03-2021-who-1-in-4-people-projected-to-have-hearing-problems-by2050.
2. Agrawal Y, Platz EA, Niparko JK. Risk factors for hearing loss in US adults: data from the National Health and Nutrition Examination Survey, 1999 to 2002. Otol Neurotol. 2009; Feb. 30(2):139–45.
3. Ward WD. Endogenous factors related to susceptibility to damage from noise. Occup Med. 1995; Jul-Aug. 10(3):561–75.
4. Contrera KJ, Betz J, Genther DJ, Lin FR. Association of hearing impairment and mortality in the National Health and Nutrition Examination Survey. JAMA Otolaryngol Head Neck Surg. 2015; Oct. 141(10):944–6.
crossref
5. Lawrence BJ, Jayakody DM, Bennett RJ, Eikelboom RH, Gasson N, Friedland PL. Hearing loss and depression in older adults: a systematic review and meta-analysis. Gerontologist. 2020; Apr. 60(3):e137–54.
crossref
6. Mick P, Kawachi I, Lin FR. The association between hearing loss and social isolation in older adults. Otolaryngol Head Neck Surg. 2014; Mar. 150(3):378–84.
crossref
7. Pronk M, Deeg DJ, Kramer SE. Hearing status in older persons: a significant determinant of depression and loneliness?: results from the longitudinal aging study amsterdam. Am J Audiol. 2013; Dec. 22(2):316–20.
crossref
8. Sung YK, Li L, Blake C, Betz J, Lin FR. Association of hearing loss and loneliness in older adults. J Aging Health. 2016; Sep. 28(6):979–94.
crossref
9. Liu CM, Lee CT. Association of hearing loss with dementia. JAMA Netw Open. 2019; Jul. 2(7):e198112.
crossref
10. Loughrey DG, Kelly ME, Kelley GA, Brennan S, Lawlor BA. Association of age-related hearing loss with cognitive function, cognitive impairment, and dementia: a systematic review and meta-analysis. JAMA Otolaryngol Head Neck Surg. 2018; Feb. 144(2):115–26.
crossref
11. Tseng YC, Liu SH, Lou MF, Huang GS. Quality of life in older adults with sensory impairments: a systematic review. Qual Life Res. 2018; Aug. 27(8):1957–71.
crossref
12. Nolan LS. Age-related hearing loss: why we need to think about sex as a biological variable. J Neurosci Res. 2020; Sep. 98(9):1705–20.
crossref
13. Cruickshanks KJ, Tweed TS, Wiley TL, Klein BE, Klein R, Chappell R, et al. The 5-year incidence and progression of hearing loss: the epidemiology of hearing loss study. Arch Otolaryngol Head Neck Surg. 2003; Oct. 129(10):1041–6.
crossref
14. Homans NC, Metselaar RM, Dingemanse JG, van der Schroeff MP, Brocaar MP, Wieringa MH, et al. Prevalence of age-related hearing loss, including sex differences, in older adults in a large cohort study. Laryngoscope. 2017; Mar. 127(3):725–30.
crossref
15. Cruickshanks KJ, Wiley TL, Tweed TS, Klein BE, Klein R, Mares-Perlman JA, et al. Prevalence of hearing loss in older adults in Beaver Dam, Wisconsin: the Epidemiology of Hearing Loss Study. Am J Epidemiol. 1998; Nov. 148(9):879–86.
crossref
16. Wilson BS, Tucci DL, Merson MH, O’Donoghue GM. Global hearing health care: new findings and perspectives. Lancet. 2017; Dec. 390(10111):2503–15.
crossref
17. World Health Organization. Deafness and hearing loss. World Health Organization;2021 [cited 2023 April 10]. Available from: https://www.who.int/news-room/fact-sheets/detail/deafness-and-hearing-loss.
18. Stevens G, Flaxman S, Brunskill E, Mascarenhas M, Mathers CD, Finucane M, et al. Global and regional hearing impairment prevalence: an analysis of 42 studies in 29 countries. Eur J Public Health. 2013; Feb. 23(1):146–52.
crossref
19. Lin FR, Thorpe R, Gordon-Salant S, Ferrucci L. Hearing loss prevalence and risk factors among older adults in the United States. J Gerontol A Biol Sci Med Sci. 2011; May. 66(5):582–90.
crossref
20. GBD 2019 Hearing Loss Collaborators. Hearing loss prevalence and years lived with disability, 1990-2019: findings from the Global Burden of Disease Study 2019. Lancet. 2021; Mar. 397(10278):996–1009.
21. Kim Y, Han BG; KoGES group. Cohort profile: The Korean Genome and Epidemiology Study (KoGES) Consortium. Int J Epidemiol. 2017; Apr. 46(2):e20.
crossref
22. Olusanya BO, Davis AC, Hoffman HJ. Hearing loss grades and the international classification of functioning, disability and health. Bull World Health Organ. 2019; Oct. 97(10):725–8.
23. Ainsworth BE, Haskell WL, Whitt MC, Irwin ML, Swartz AM, Strath SJ, et al. Compendium of physical activities: an update of activity codes and MET intensities. Med Sci Sports Exerc. 2000; Sep. 32(9 Suppl):S498–504.
crossref
24. Mitchell P, Gopinath B, Wang JJ, McMahon CM, Schneider J, Rochtchina E, et al. Five-year incidence and progression of hearing impairment in an older population. Ear Hear. 2011; Mar-Apr. 32(2):251–7.
crossref
25. Karlsmose B, Lauritzen T, Engberg M, Parving A. A five-year longitudinal study of hearing in a Danish rural population aged 31-50 years. Br J Audiol. 2000; Feb. 34(1):47–55.
crossref
26. Pirila T, Jounio-Ervasti K, Sorri M. Left-right asymmetries in hearing threshold levels in three age groups of a random population. Audiology. 1992; 31(3):150–61.
crossref
27. Moscicki EK, Elkins EF, Baum HM, McNamara PM. Hearing loss in the elderly: an epidemiologic study of the Framingham Heart Study Cohort. Ear Hear. 1985; Jul-Aug. 6(4):184–90.
28. Lin FR, Niparko JK, Ferrucci L. Hearing loss prevalence in the United States. Arch Intern Med. 2011; Nov. 171(20):1851–2.
crossref
29. Wild DC, Brewster MJ, Banerjee AR. Noise-induced hearing loss is exacerbated by long-term smoking. Clin Otolaryngol. 2005; Dec. 30(6):517–20.
crossref

Fig. 1.
Flowchart of study participants. KoGES, Korean Genome and Epidemiology Study.
ceo-2022-01557f1.tif
Fig. 2.
Changes in air conduction and bone conduction over time. Older age was associated with a greater change in the hearing threshold between times 1 and 2. (A) Change of air conduction in right ear. (B) Change of air conduction in left ear. (C) Change of bone conduction in right ear. (D) Change of bone conduction in left ear. Values are presented as mean (standard deviation).
ceo-2022-01557f2.tif
Table 1.
Characteristics of study participants at time 1 (baseline)
Variable Value (n=1,890)
Demographics
 Age (yr) 55.16±6.87 (45–75)
  <50 431 (22.80)
  50–59 999 (52.86)
  60–69 369 (19.52)
  70–79 91 (4.81)
 Sex
  Male 936 (49.37)
  Female 964 (50.63)
 Educational level
  Primary/middle school 582 (30.81)
  High school 875 (46.32)
  Higher than college/university 432 (22.87)
 Income per month
  Low (<$1,500) 352 (19.50)
  Middle ($1,500–$4,000) 890 (49.31)
  High (>$4,000) 563 (31.19)
 Occupation
  Professional/management/office job 589 (31.21)
  Service/farming/army/laborer etc. 616 (32.64)
  Housewife/no job/others 682 (36.14)
Lifestyle factors/anthropometric traits
 Smoking
  Never 1,174 (62.12)
  Former/current 716 (37.88)
 Alcohol use
  Never 922 (48.78)
  Former/current 968 (51.22)
 Body mass index (kg/m2) 24.61±2.88 (16.01–36.53)
  <25 1,087 (57.51)
  ≥25 803 (42.49)
 Physical activity (min/wk)=intensity of activities (METs) 188.52±242.75 (0–1,787.14)
 Chronic disease
  Cardiovascular disease 93 (4.92)
  Hypertension 678 (35.87)
  Diabetes mellitus 464 (24.55)
  Chronic kidney disease 70 (3.70)

Values are presented as mean±standard deviation (range) or number (%).

MET, metabolic equivalent of task.

Table 2.
Grades and types of HL at time 1 and time 2
Variable Time1
Time 2
Right Left Better ear Right Left Better ear
Grade of HL 1,890 1,890 1,890 1,890 1,890 1,890
Normal 1,012 (53.54) 991 (52.43) 1,202 (63.60) 772 (40.85) 731 (38.68) 914 (48.36)
Mild 704 (37.25) 706 (37.35) 588 (31.11) 781 (41.32) 777 (41.11) 735 (38.89)
Moderate 127 (6.72) 131 (6.93) 80 (4.23) 242 (12.80) 275 (14.55) 198 (10.48)
Moderately severe 25 (1.32) 35 (1.85) 14 (0.74) 63 (3.33) 61 (3.23) 34 (1.80)
Severe 10 (0.53) 17 (0.90) 4 (0.21) 17 (0.90) 26 (1.38) 8 (0.42)
Profound 6 (0.32) 5 (0.26) 2 (0.11) 7 (0.37) 14 (0.74) 1 (0.05)
Completely 6 (0.32) 5 (0.26) 0 8 (0.42) 6 (0.32) 0
Type of HL among people with HL 844 864 1,114 1,156
Sensorineural HL 383 (45.38) 340 (39.35) 928 (83.30) 873 (75.52)
Conductive HL 356 (42.18) 368 (42.59) 160 (14.36) 250 (21.63)
Mixed HL 105 (12.44) 156 (18.06) 26 (2.33) 33 (2.85)

Values are presented as number (%).

HL, hearing loss.

Differences in HL grade using chi-square significant test: HL grade between time 1 and time 2 using a better ear (χ2=3,271.39, P<0.001); Between the right ear and left ear at time 1 (χ2=1,413.32, P<0.001); Between the right ear and left ear and time 2 (χ2=1,624.75, P<0.001); Between right ear time 1 and time 2 (χ2=3,536.40, P<0.001); Between left ear time 1 and time 2 (χ2=4,201.84, P<0.001).

Table 3.
Changes in HL over time of normal hearing, incidence, continuity, and deterioration of HL (n=1,890)
Variable Time 1 Time 2 No. (%)
Those without HL at time 1 (n=1,202)
Normal hearing (n=875, 72.80%) Normal Normal 875 (72.80)
Incidence (normal to HL: n=327, 27.20%) Normal Mild 319 (26.54)
Normal Moderate 7 (0.58)
Normal Moderate severe 1 (0.08)
Those with HL at time 1 (n=688)
No change in HL level (n=482, 70.06%) Mild Mild 412 (59.88)
Moderate Moderate 59 (8.58)
Moderate severe Moderate severe 8 (1.17)
Severe Severe 2 (0.29)
Profound Profound 1 (0.14)
1 Level HL deterioration (n=152, 21.95%) Mild Moderate 129 (18.75)
Moderate Moderate severe 17 (2.47)
Moderate severe Severe 5 (0.73)
2–3 Level HL deterioration (n=8, 1.16%) Mild Moderate severe 8 (1.16)
Moderate Severe/profound 0
Hearing improved at time 2 (n=47, 6.83%) Mild Normal 39 (5.67)
Others 8 (1.16)

HL, hearing loss.

Table 4.
Changes in air conduction and bone conduction over time
Variable Frequency (Hz)
125 250 500 1,000 2,000 3,000 4,000 8,000
Air conduction
Right ear (dB)
Time 1 20.69 20.14 18.42 18.11 19.44 24.68 28.64 36.12
Time 2 20.93 19.85 19.55 21.12 23.58 29.60 35.58 44.49
Change T2–T1 0.25 –0.29 1.13 3.01 4.14 4.96 6.94 8.30
Left ear (dB)
Time 1 19.64 19.16 16.36 17.56 21.95 28.21 30.41 39.18
Time 2 21.38 19.67 19.15 21.50 24.70 31.66 37.49 48.41
Change T2–T1 1.77 0.51 2.79 3.93 2.74 3.44 7.07 9.24
Bone conduction
Right ear (dB)
Time 1 7.01 13.59 13.54 16.31 17.42 15.75
Time 2 14.83 17.73 19.47 22.73 27.41 30.17
Change T2–T1 7.79 4.08 5.89 6.32 9.76 13.74
Left ear (dB)
Time 1 5.76 12.12 12.85 17.74 19.71 17.24
Time 2 14.58 17.28 19.69 23.64 29.13 31.21
Change T2–T1 8.80 5.12 6.80 5.83 9.19 13.32
Table 5.
Logistic regression analysis: incidence and deterioration of HL
Variable Incidence: among those who had normal hearing at time 1 (n=1,202)
Deterioration of HL: among those who had HL at time 1 (n=641)
OR (95% CI) P-value OR (95% CI) P-value
Age (yr)
<50 Ref Ref Ref Ref
50–59 1.41 (1.01–1.98) 0.04 1.65 (0.75–3.62) 0.21
60–69 3.44 (2.15–5.53) ≤0.001 3.04 (1.33–6.94) 0.01
70–79 7.24 (2.38–22.0) ≤0.001 5.35 (2.04–14.01) ≤0.001
Sex
Female Ref Ref Ref Ref
Male 1.73 (1.07–2.81) 0.03 1.00 (0.42–2.35) 1.00
Educational level
Primary/middle school Ref Ref Ref Ref
High school 0.78 (0.55–1.10) 0.16 1.23 (0.74–2.02) 0.43
Higher than college/university 0.68 (0.45–1.05) 0.08 1.42 (0.76–2.65) 0.27
Income level
Low Ref Ref Ref Ref
Middle 1.12 (0.74–1.70) 0.59 0.83 (0.51–1.37) 0.47
High 1.17 (0.74–1.86) 0.50 0.56 (0.29–1.10) 0.09
Occupation
Professional/management/office job Ref Ref Ref Ref
Service/farming/army/laborer etc. 0.96 (0.61–1.52) 0.87 0.65 (0.37–1.14) 0.18
Housewife/no job/others 0.96 (0.68–1.37) 0.83 1.72 (0.78–3.79) 0.13
Smoking
Never Ref Ref Ref Ref
Former/current 1.08(0.71–1.64) 0.72 1.15 (0.62–2.14) 0.66
Alcohol use
Never Ref Ref Ref Ref
Former/current 0.89 (0.64–1.24) 0.49 1.74 (1.06–2.85) 0.03
Body mass index 1.05 (1.00–1.10) 0.05 0.93 (0.86–1.00) 0.06
Physical activity (MET) 1.00 (1.00–1.00) 0.58 1.00 (1.00–1.00) 0.61
Cardiovascular disease
No Ref Ref Ref Ref
Yes 1.73 (0.85–3.52) 0.13 1.35 (0.69–2.63) 0.38
Hypertension
No Ref Ref Ref Ref
Yes 0.90 (0.66–1.23) 0.52 0.95(0.61–1.46) 0.80
Diabetes mellitus
No Ref Ref Ref Ref
Yes 1.43 (1.04–1.96) 0.03 1.38 (0.88–2.14) 0.16
Chronic kidney disease
No Ref Ref Ref Ref
Yes 1.20 (0.54–2.69) 0.65 1.07 (0.50–2.28) 0.86

HL, hearing loss; OR, odds ratio; CI, confidence interval; Ref, reference; MET, metabolic equivalent of task.

TOOLS
Similar articles