

 PDF
PDF Citation
 Print
Print


Introduction
Generally, myelocytomatosis oncogene (MYC) family oncogenes encode three highly interrelated nuclear phosphoproteins (MYC, MYCL, and MYCN) that are thought to function as sequence-specific transcription factors which are able to regulate genes essential for cellular differentiation and growth (1). As a transcription factor, MYC shows site-specific DNA-binding functions with its binding factor MYC-associated factor X (MAX). This MYC–MAX binding may regulate cell cycle progression through G1 phase and may be partly regulated by cyclin-dependent kinases during cell proliferation (2).
Takahashi et al. (3) created the first induced pluripotent stem cells (iPSCs) using four master transcription factors including octamer binding transcription factor 4 (OCT4), MYC, Kruppel-like factor 4 (KLF4), and sex-determining region Y-box 2 (SOX2) through retroviral transduction in mouse fibroblasts. In embryonic stem (ES) cells and induced pluripotent stem (iPS) cells, analysis of embryos derived from the homozygous MYC and MYCN mutants reveals the embryonic lethality with defective hematopoietic, vascular networks, neuroectodermal, heart, and lung development (4-7). Several studies described that MYCL is the widely-expressed in the murine embryonic tissues, but MYCL seems to be comparatively dispensable for normal embryonic development compared with MYC and MYCN (8, 9). Therefore, MYC and MYCN are essential regulators during the process of normal embryogenesis in that the MYC family genes are crucial for maintenance of stem cell properties.
Also, Bishop et al. initially demonstrated that viral myelocytomatosis oncogene (MYCV) was an oncogene generated by the avian MC29 myelocytomatosis transforming virus (10). Many studies reported that MYCV, MYC (11, 12), lung cancer-derived MYC (MYCL), and neuroblastoma-derived MYC (MYCN or basic helix-loop-helix protein 37 [bHLHe37]) (13-15) is triggered in various cancers. MYC proteins were found to be involved in approximately 70% of human cancers, suggesting that these proteins are required for carcinogenesis. Several studies have demonstrated that MYC can be activated through various mechanisms, including amplifications, translocations, protein stability, or enhanced translation (16-20), which may result in cancer occurrence. However, how cancer development is related to MYC activation is not yet completely understood. Additionally, MYC plays a crucial role in various cellular pathways that regulate the pathogenesis of cancer and is essential in the survival of cancer cells that are resistant to anti-cancer drugs (21).
Here, we performed a systematic analysis to investigate whether MYC family genes act as oncogenic or tumor suppressor genes in various human cancers, and demonstrated that MYC family genes were differentially expressed in various cancer types and were associated with cancer prognosis and cellular pathway-related genes and proteins. Our study aimed to identify the direct targeting of MYC family proteins and their critical up-/down-stream regulators in tumors. To systemically analyze the characteristics of the MYC family genes in cancers, the Oncomine platform was used to assess the gene expression of cancers by nearly 90,000 microarray experiments. Furthermore, the survival of cancer patients was confirmed using the PrognoScan, SurvExpress, GEPIA, and R2. We also used the cBioPortal database to assess whether the CNAs of the MYC family axis are associated with cancer. The co-expression data implies the mechanism of the potential inertial tube of genes. Gene ontology was evaluated using DAVID functional annotation analysis, which displays data on the biological function of the MYC family in cancer. The main characteristics of the selected oncogenomic portals are overviewed in Supplementary Table S1.
Materials and Methods
Oncomine database analysis
The expression level of MYC family genes in various types of cancer was determined using the Oncomine database (https://www.oncomine.org/resource/login.html). The most significant fold-change in mRNA expression in cancer tissues was obtained using the parameters of fold change <2, p-value <1e-4, and a gene ranking percentile in the top 10% compared to that of normal tissues. The co-expression profiles of MYC family genes were extracted from the Oncomine database and presented as the pattern of heat map in different types of cancer.
Prognoscan database analysis
The correlation between MYC family gene expression and survival probability in several cancer patients was analyzed using the PrognoScan database (http://www.abren. net/PrognoScan/). The threshold was adjusted to a p-value<0.05.
Identifying protein networks of MYC family axis
STRING v10.5 was used as an analysis tool to identify the predicted interacting proteins using the MYC family as the query (http://STRING-db.org). Any proteins that were not specific to the MYC family axis were excluded from the gene signature.
cBioPortal database analysis
cBioPortal (http://www.cbioportal.org/) was used to perform an integrative analysis of MYC family genes and clinical characteristics using the data, which recently provided access to data from more than 64,380 tumor samples from 212 cancer studies. The main search parameters included alterations (amplification, deep deletion, and missense mutations), CNA from GISTIC, and RNA-seq data using default settings. The oncoprint and network of interacting proteins was also retrieved from cBioPortal.
DAVID functional annotation analysis
Functional annotation of MYC co-expressed genes in specific cancers was analyzed using DAVID, an open access resource at https://david.ncifcrf.gov/home.jsp. The 3,000 genes co-expressed in specific types of cancer using cBio-Portal were selected based on a p-value<0.05 and analyzed using DAVID.
SurvExpress database analysis
The correlation between MYC family gene expression and survival probability in several cancer patients was analyzed using the SurvExpress database (http://bioinformatica. mty.itesm.mx:8080/Biomatec/SurvivaX.jsp). The threshold was adjusted to a p-value<0.05.
GEPIA database analysis
The expression level of MYC family genes in various cancers was determined from the GEPIA database (http://gepia.cancer-pku.cn/index.html). The threshold was adjusted to a p-value<0.05. GEPIA was also used to analyze MYC family gene expression and survival probability in several cancer patients. The threshold was adjusted to a p-value<0.05.
Kaplan-Meier plotter
Kaplan-Meier plotter (http://kmplot.com/analysis/) was used to analyze MYCL gene expression and survival probability in lung cancer patients. The threshold was adjusted to a p-value<0.05. For multivariate survival analysis, clinical outcomes data were retrieved from the Kaplan-Meier plotter and analyzed using GraphPad Prism version 7. The threshold was adjusted to a p-value<0.05.
R2: genomics analysis and visualization platform
R2 (https://hgserver1.amc.nl/cgi-bin/r2/main.cgi?&species=hs) was used to analyze MYC family gene expression and survival probability in various cancer patients. The threshold was adjusted to a p-value<0.05.
Cell culture
Human cell lines for breast normal (MCF10A), breast cancer (MDA-MB-231), neuroblastoma (SH-SY5Y), ovarian adenocarcinoma (A2780), pancreatic adenocarcinoma (Ca-pan02) and colon cancer (HCT116) are obtained from American Type Culture Collection (ATCC, Manassas, VA, USA). MDA-MB-231, HCT116, A2780, and Capan02 cell lines were cultured in Roswell Park Memorial Institute medium (RPMI) 1640 (Sigma-Aldrich, Saint Louis, MO, USA) supplemented with 10% fetal bovine serum (GibcoTM, Thermo Fisher Scientific, Waltham, MA, USA). SH-SY5Y cell line was cultured in high-glucose Dulbecco’s Modified Eagle Medium (DMEM, Sigma-Aldrich) supplemented with 10% fetal bovine serum. MCF10A was cultured in DMEM-F12 supplemented with 10% horse serum, 0.5 ug/ml hydrocortisone, 10 ug/ml insulin, 20 ng/ml epidermal growth factor (EGF), 0.5 ug/ml amphotericin B, 2mM L-glutamine. All cell culture mediums were also supplemented with 1% penicillin-streptomycin (GibcoTM, Thermo Fisher Scientific), respectively, in a humidified incubator with an atmosphere of 5% CO2 at 37℃.
RNA isolation and Reverse Transcription-Polymerase Chain Reaction (RT-PCR)
Total RNA was extracted using a Labozol Reagent RNA Extraction kit (Cosmogenetech, Korea). Subsequently, 2 ug of total RNA was used for cDNA synthesis kit with M-MLV reverse transcriptase (Labopass, Korea) according to the manufacturer’s instructions. RT-PCR was conducted using r-Taq plus Master Mix (Elpis Biotech, Korea). The PCR products were separated by 1.5% agarose gel elec-trophoresis.
Western blot
Cells were lysed with RIPA buffer (LPS solution, Korea) with HaltTM Protease Inhibitor Cocktail (100x, Thermo Fisher Scientific). The lysates were centrifuged at 13,000 rpm for 15min at 4℃. The Protein supernatant was quantified using a BCA protein assay kit (Thermo Fisher Scientific). Protein samples (10 μg) were separated by electrophoresis using BoltTM 4∼12% Bis-Tris Plus 12-well gels (Invitrogen, CA, USA) and transferred to nitrocellu-lose membranes using iBolt2 Transfer Stacks (Invitrogen) and iBolt2 Dry Blotting System (Invitrogen). After blocking with 5% skimmed milk (BD, USA) in Tris-buffered saline for 1 hour, the membranes were incubated with appropriate primary antibodies against MYC (1:500, Santa Cruz, sc-788, USA), MYCL (1:500, ABclonal, A16301, USA), MYCN (1:500, ABclonal, A22174), and β-actin HRP (1:500, Santa Cruz, sc-47778) overnight at 4℃. This was followed by a 2 hours incubation with anti-rabbit (1:1,000, Cell Signaling, 7074S, USA) with horse radish pero-xidase. Protein signals were detected using an ECL detec-tion kit (Amersham Bioscience, Piscataway, USA). Quanti-fication of protein bands was analyzed using an Invitro-genTM iBrightTM imaging system (iBright CL1000, Thermo Fisher Scientific).
Statistical analysis
All statistical analysis was performed using GraphPad Prism version 7 (GraphPad Software, La Jolla, CA, USA). Survival curves were plotted using the PrognoScan data-base. All results are displayed with p-values from the long-rank test. Similar procedures were used for Oncomine to generate heatmaps. The multivariate survival analysis was also performed using GraphPad Prism version 7. For multivariate survival analysis, clinical outcomes data were retrieved from the Kaplan-Meier plotter database. Statisti-cal significance was selected as a p-value<0.05.
Results
MYC family expression in various cancers
In mammalian cells, three distinct MYC gene family members have been identified, MYC, MYCL, and MYCN, which have similar functions but show differential expression patterns and remarkable differences in terms of their potency. It has been reported that MYC family members have similar structures but are derived from different chromosomal loci (22). In general, it has been found that MYC has a transactivation domain for cellular transactivation, a transcription co-activator binding domain, also known as the MYC box, which supports co-activators and binds to MYC members, and a DNA binding domain (Fig. 1A). First, we investigated whether each MYC family gene was overexpressed or underexpressed in cancers using the Oncomine database (Fig. 1B). Our systematic analysis found that the expression of MYC was highest in colorectal cancer and lowest in breast cancer; MYC expre-ssion was either slightly higher or lower than the average value in other types of cancer (Fig. 1B). Also, we found that MYC is highly expressed in normal breast tissue in 10 out of 53 analyses, while only 1 out of 53 analyses revealed high expression of MYC in breast cancer. MYCL was highly expressed in brain cancer but under-expressed in melanoma (Fig. 1B). The other MYC family gene, MYCN, was highly expressed in leukemia and under-expressed in lymphoma and myeloma. Interestingly, our experimental results confirmed that the mRNA (Fig. 1C) and protein (Fig. 1D) expression levels of MYC family genes, including MYC, MYCL, and MYCN, in several cancer cell lines was variable. These results suggest that MYC family genes are differentially expressed in various types of cancer and correlated with cancer prognosis.
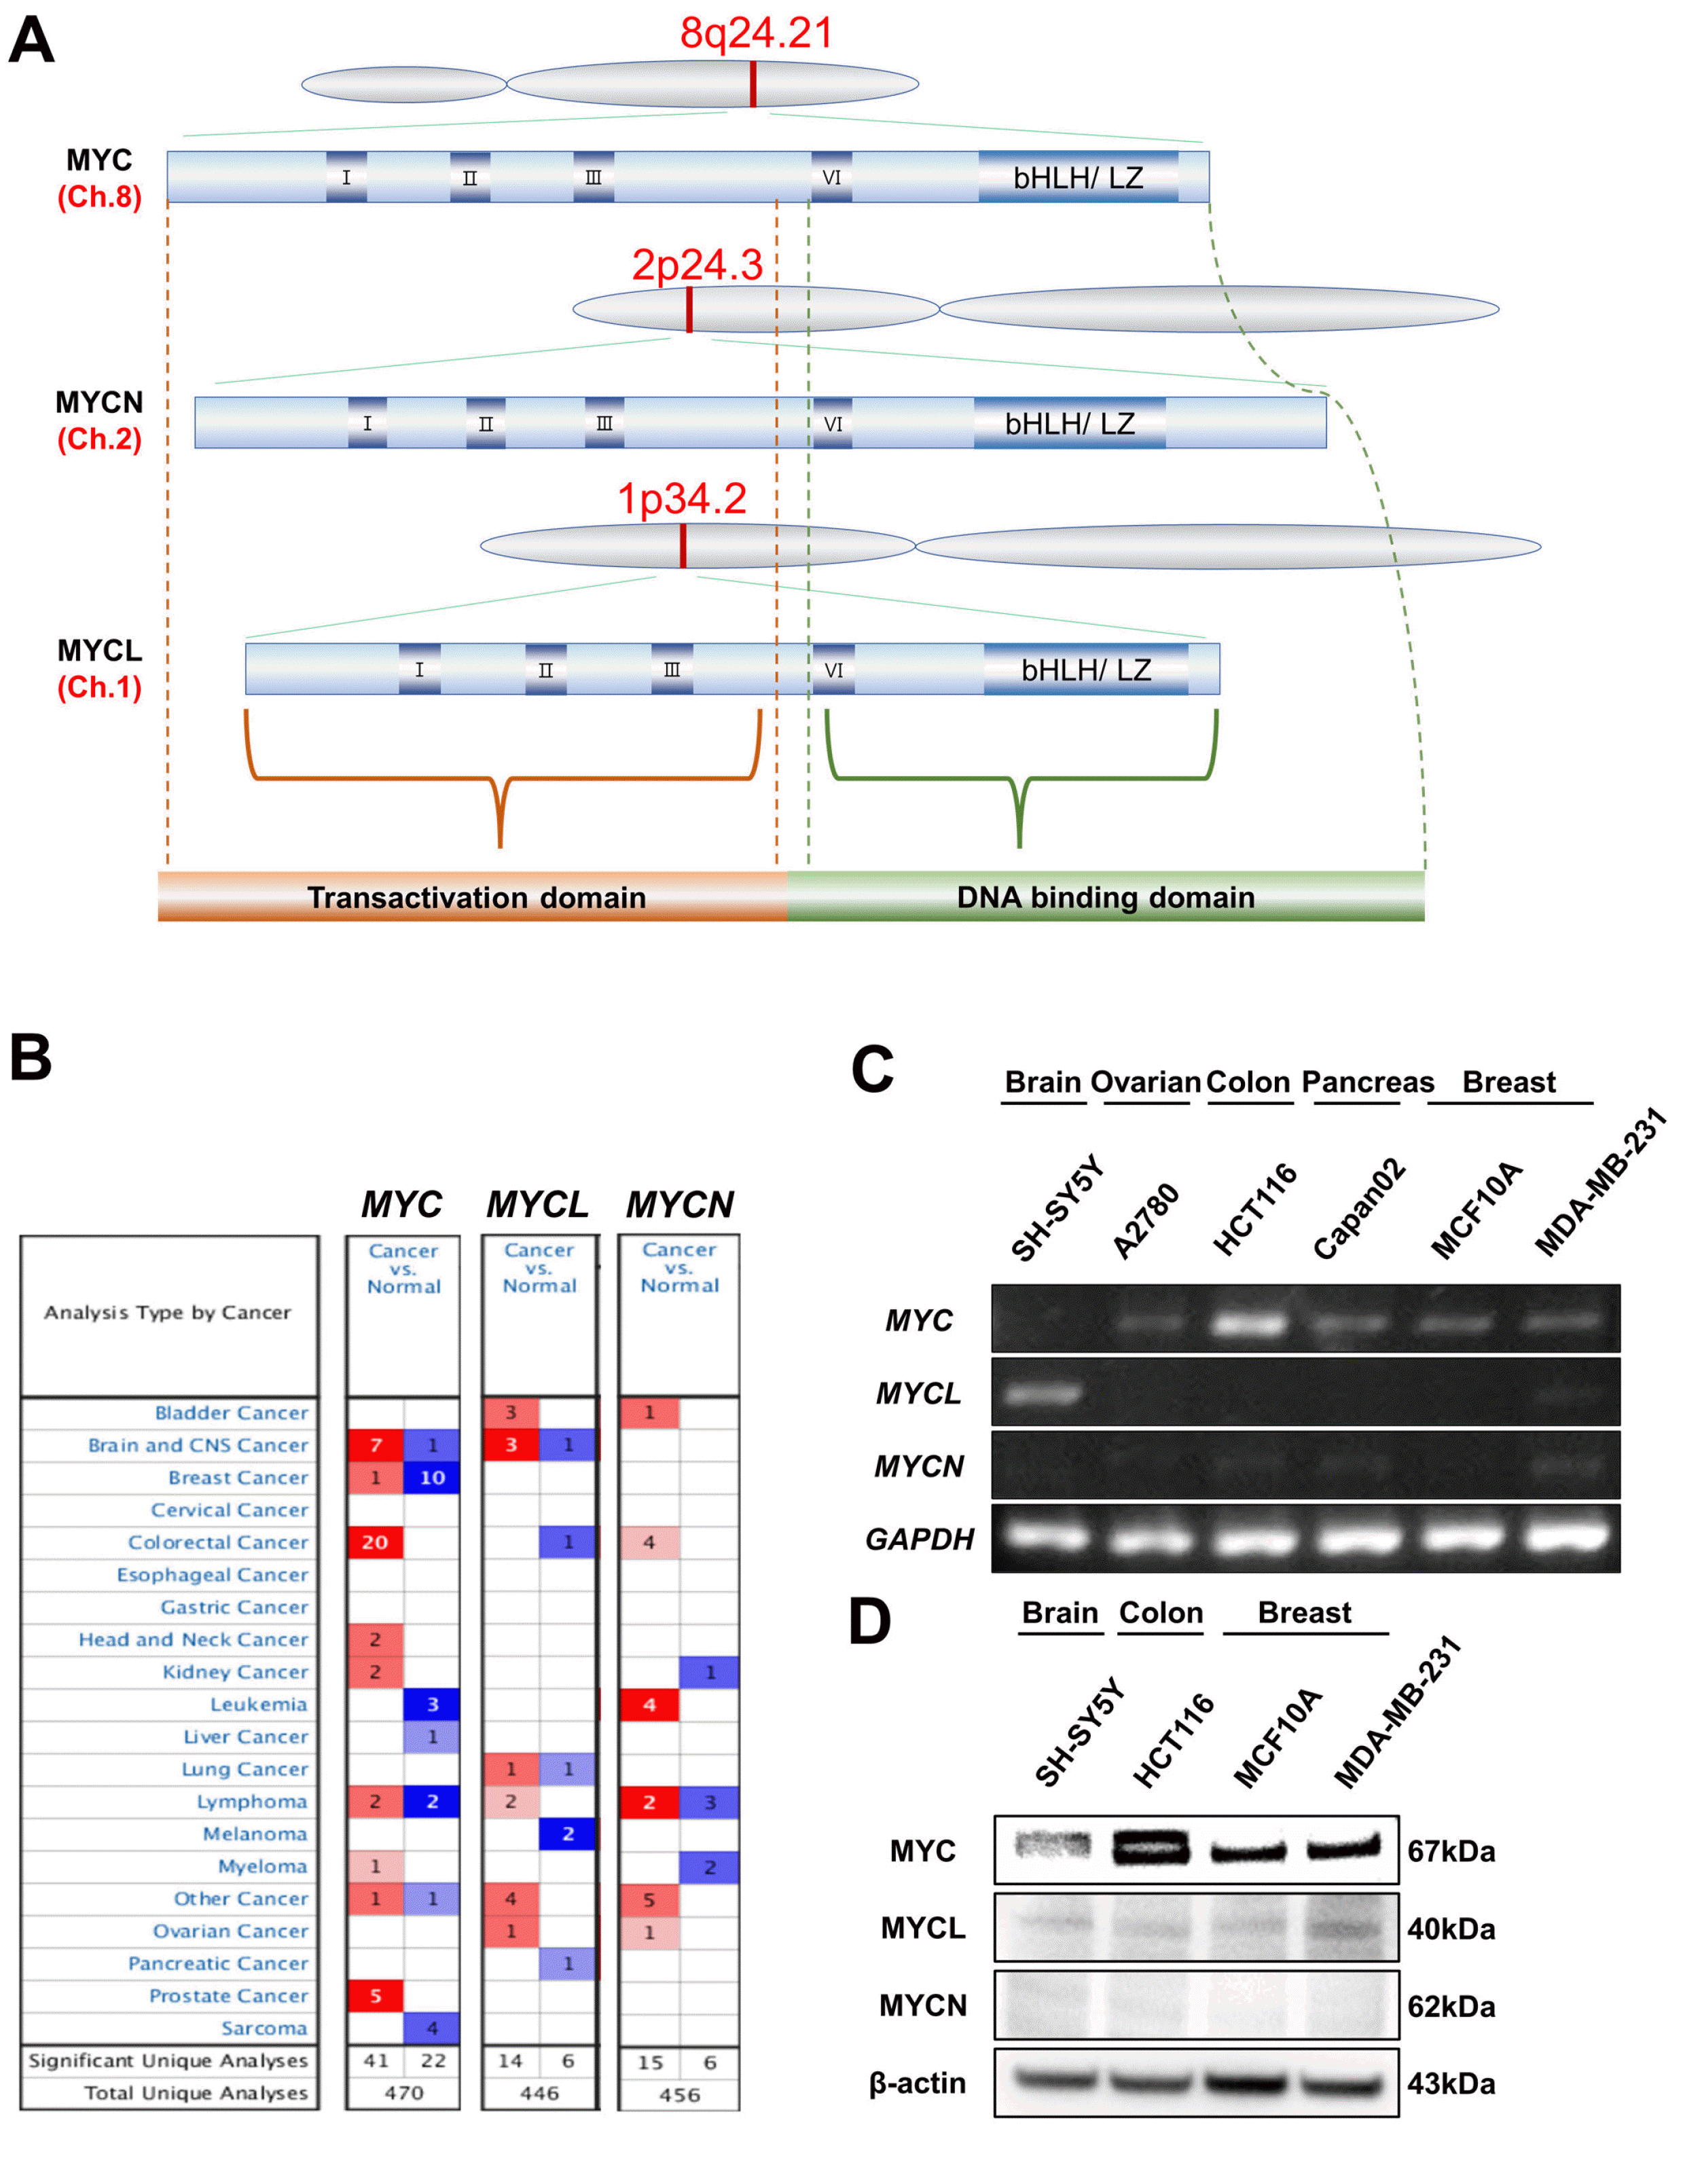
Fig. 1
MYC family structure and expression analysis in various types of cancer. (A) Architecture of MYC family. Generic representation of a mammalian MYC protein, indicating the transcriptional activation domain, MYC boxes (I, II, III), which are strictly conserved in MYC family genes and play an important role in binding to various transcriptional coactivators, canonical nuclear localization sequence (NLS), and region involved in DNA binding as basic helix-loop-helix (bHLH)/leucine zipper (LZ) domain. All trees of MYC genes are known to originate from different chromosomes (the red text denotes the chromosome number from which they are transcribed). MYC protein contains 439 amino acids. MYCN and MYCL proteins slightly differ in length (464 and 364 amino acids, respectively). (B) The comparison indicated the number of datasets with MYC family mRNA overexpression (red) and under-expression (blue) in cancer versus normal tissue. The threshold was designed using the following parameters: p-value of 1e-4, fold-change of 2, and gene ranking of 10%. (C) The MYC family gene expression in various cancers was determined using RT–PCR. (D) Protein expression levels of MYC family in various cancers using western blot analysis. MYC: myelocytomatosis oncogene.
![]()
MYC
Our systematic analyses showed that the MYC gene functions as a proto-oncogene or tumor suppressor gene and is expressed differently in various cancers (Fig. 2A, Supplementary Table S2). Interestingly, the fold-change of MYC expression in the brain and central nervous system (CNS) cancers was increased by up to 90-fold, while sarcoma showed a 6-fold reduction in expression (Fig. 2A). From the PrognoScan database, we also found that MYC expression was correlated with the clinical prognosis of cancer patients; specifically, the hazard ratio was highest in brain cancer and lowest in eye cancer (Fig. 2D, Supplementary Table S3). The Oncomine and TCGA database also revealed that, compared to normal tissues, MYC expression was overexpressed in brain, colon, and prostate cancers (Fig. 2B and 2C), which are associated with poor clinical outcomes (Fig. 2E). Moreover, we found increased MYC expression in kidney cancer (Fig. 2C), which is significantly correlated with a poor prognosis (Fig. 2E) from the TCGA database. However, the expression of MYC in breast cancer and leukemia was lower than in normal breast tissue and white blood cells (Fig. 2B and 2C). The Prognoscan database, with a p-value<0.05, showed that patients with breast and blood cancer and high MYC expression had high rates of survival (Fig. 2E), which implies that the expression of MYC may differentially regulate various types of cancer prognosis.
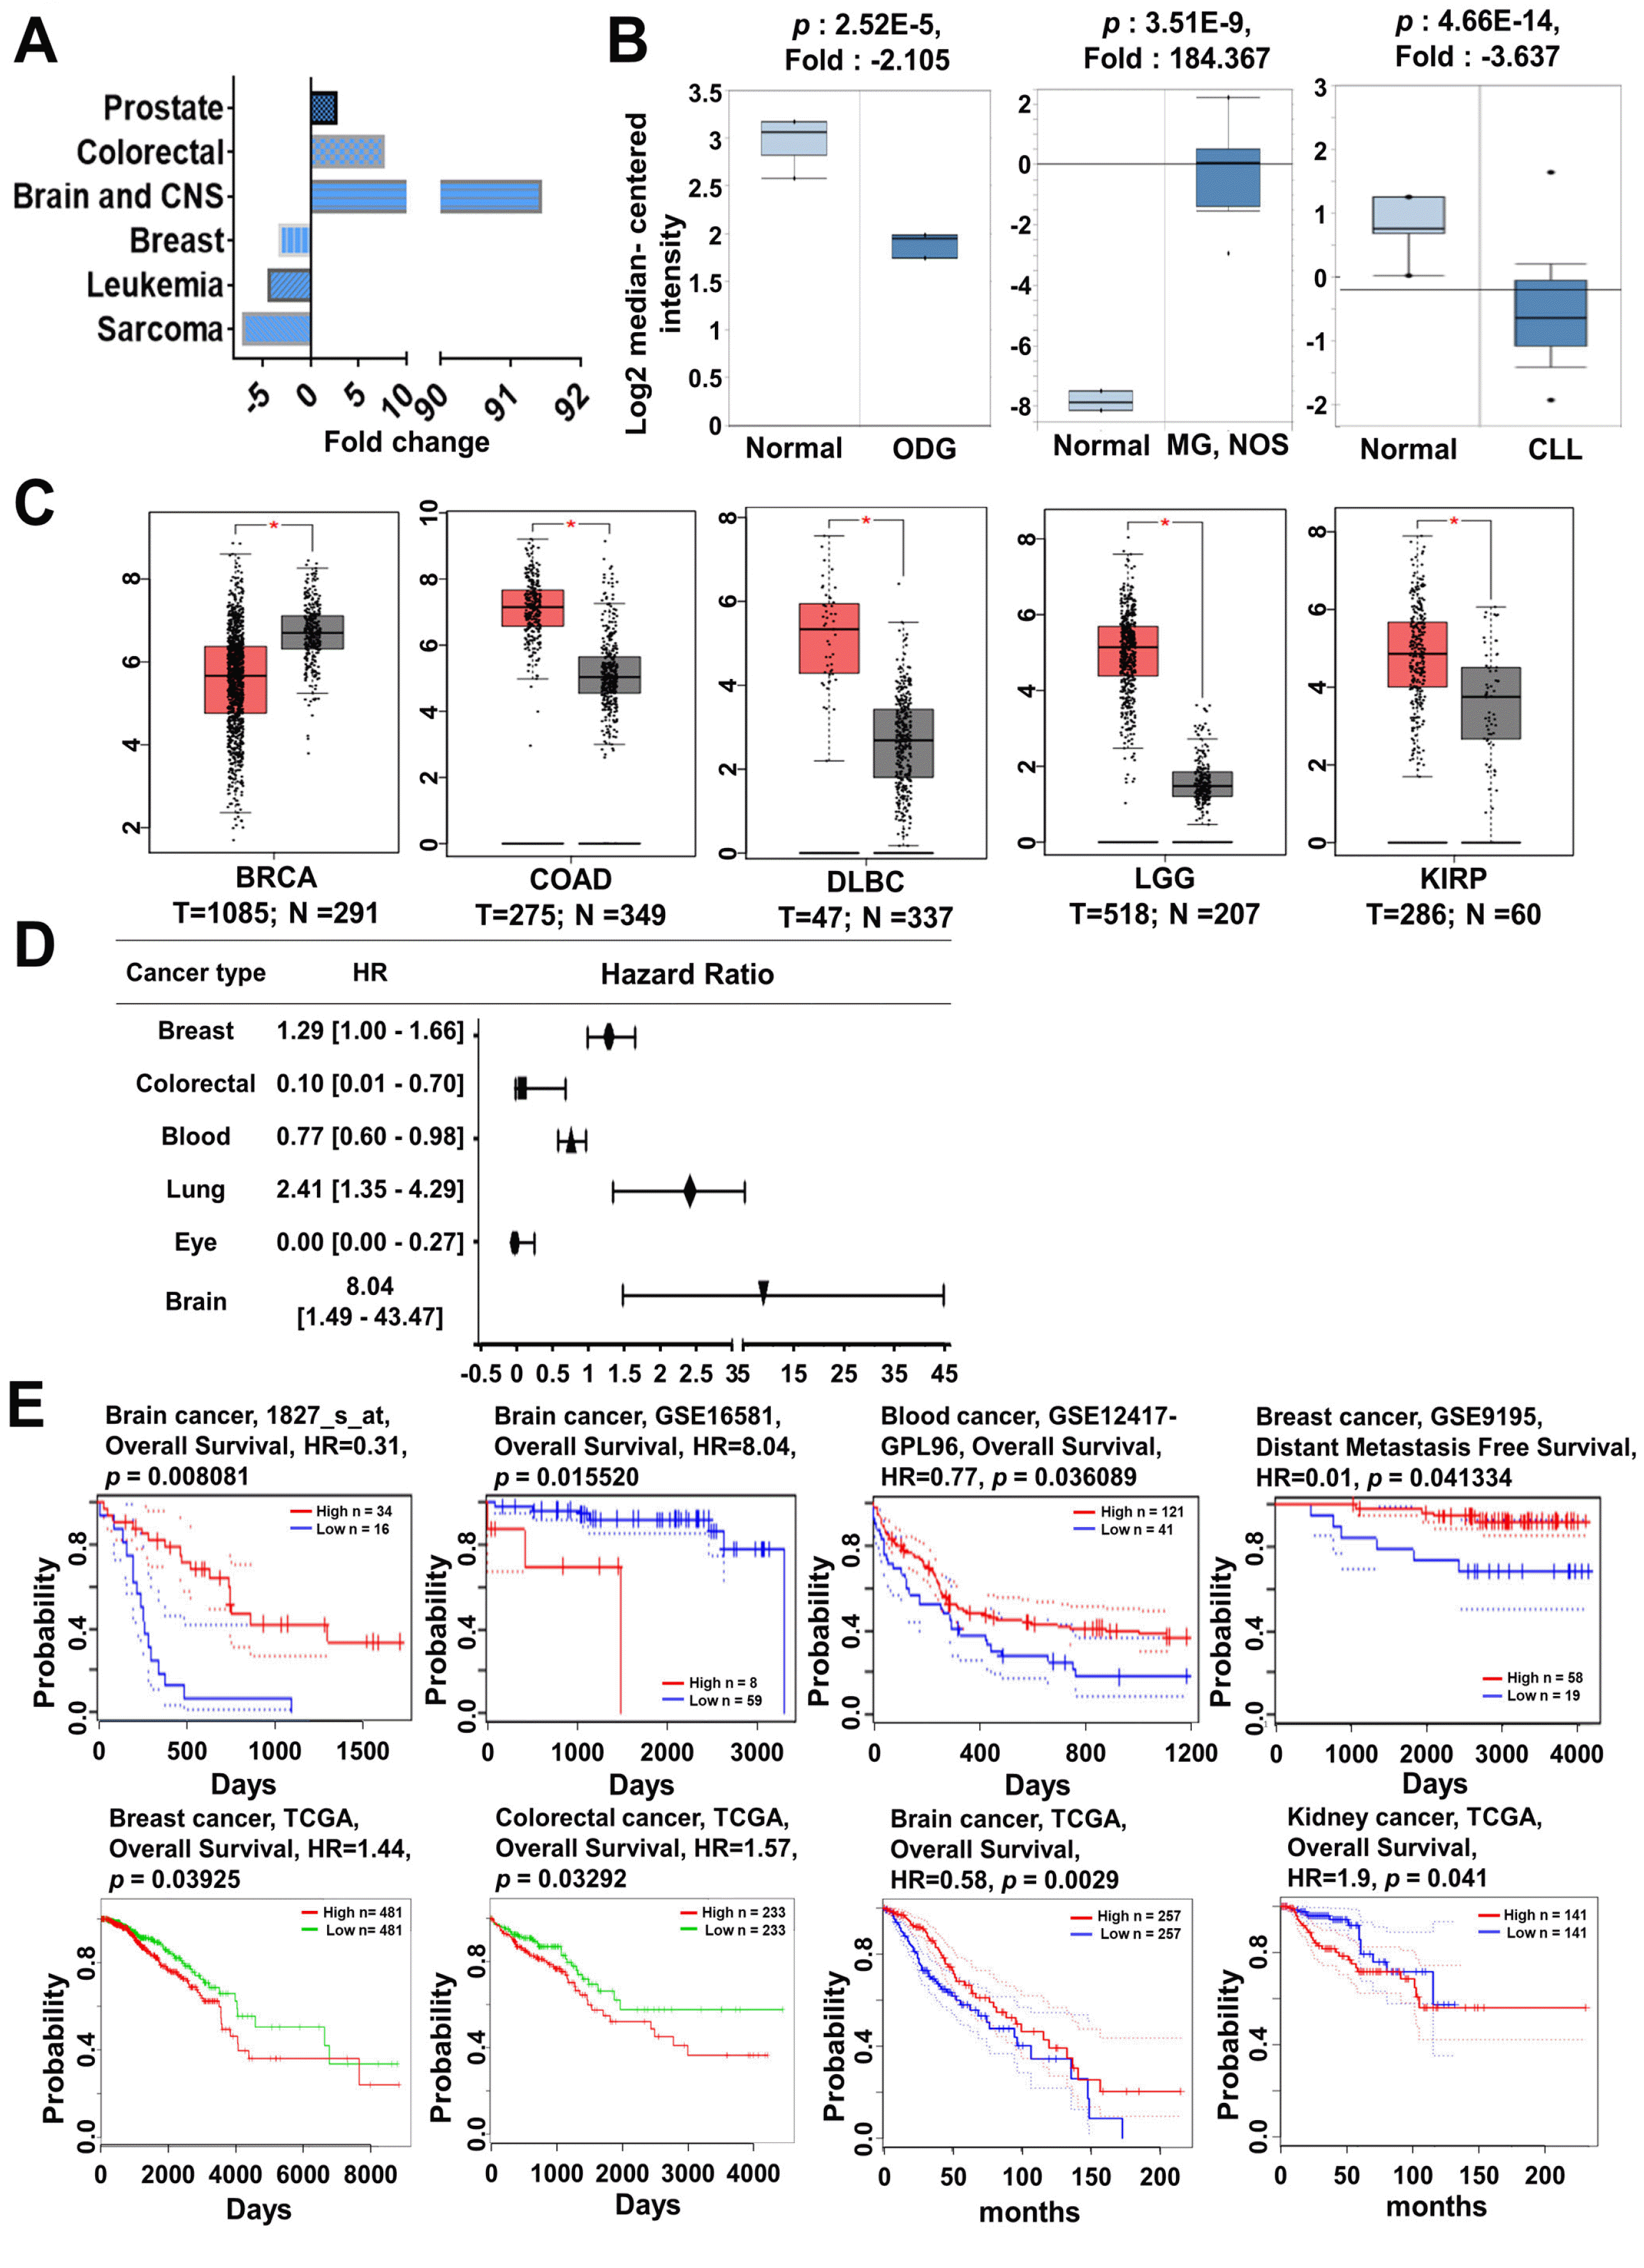
Fig. 2
MYC mRNA expression and prognosis analysis in different types of cancer. (A) MYC expression was analyzed in various types of cancers using Oncomine database. The plots show the expression of MYC in various types of cancer. (B) MYC expression was analyzed using the Oncomine database and is represented as a box plot in brain, colon, prostate, breast, and blood cancers relative to their normal tissues. (C) MYC expression was analyzed using TCGA data via GEPIA and is represented as a box plot in breast, colon, lymphoma, brain, and kidney cancers (red box plot) relative to their normal tissues (grey box plot) with a threshold of p-value<0.05. (D) The prognostic value of MYC was analyzed using the Prognoscan database and is represented as the hazard ratio. (E) Survival curve comparing patients with high (red) and low (blue/green) expression was plotted using the PrognoScan, GEPIA, and SurvExpress databases. The survival curves indicated the relationship between patient survival probability and MYC expression in various cancers, with a threshold of Cox p-value<0.05. ODG: oligodendroglioma, MG: malignant glioma, NOS: not otherwise specified, CLL: chronic lymphocytic leukemia, BRCA: breast invasive carcinoma, COAD: colon adenocarcinoma, DLBC: lymphoid neoplasm diffuses large B-cell lymphoma, LGG: brain lower grade glioma, KIRP: kidney renal papillary cell carcinoma, HR: hazard ratio, TCGA: the cancer genome atlas, GSE: gene set enrichment.
![]()
To determine the underlying signaling mechanism involved in MYC expression, next analyzed the Oncomine database to identify genes co-expressed with MYC in various cancers. The MYC co-expression profile in the brain, head-neck, lymphoma, and ovarian cancers was obtained from the Oncomine database (Supplementary Fig. S1a, c, e, and g). We then investigated whether MYC contributes to cellular signaling mechanisms. For this, we retrieved genes co-expressed with MYC from cBioPortal for brain cancer. Gene ontology (GO) for MYC co-expressed genes was determined using DAVID Bioinformatics Resources 6.8 in brain cancer. The top 10 significant GO processes involved in brain cancer development related to MYC expression were also determined (Supplementary Fig. S1b). Interesti-ngly, we found that MYC is involved in a variety of biological functions in brain cancer. The MYC co-expression profile was predominantly involved in the cell cycle and TP53 signaling pathway in brain cancer (Supplementary Fig. S1b). Similar to brain cancer, the GO process of MYC co-expression profiles in head and neck, lymphoma, and ovarian cancer were found to contribute to various biological functions (Supplementary Fig. S1d, f, and h), suggesting that MYC expression regulates cancer development by modulating various cellular signaling pathways.
Next, we determined the frequency of mutations in MYC protein using the cBioPortal database. A total of 366 mutations from 178 studies were identified in 0∼454 amino acids of MYC protein. The most frequent mutation occurred in the MYC_N domain of MYC protein, specifically at P74A/L/Q/R/S/T (Fig. 3A, upper panel). Moreover, the mutation frequency was analyzed in 44,763 samples from 178 studies and the alteration frequency was 2∼10% in 22 types of cancer (Fig. 3A, lower panel). We then identified the functional protein partners of MYC (MYC) based on previous publications and curated databases using STRING, v10.5 (Fig. 3B). The 10 predicted interacting proteins (based on confidence scores) of MYC (with the corresponding gene names) were selected including tumor protein p53 (TP53), B-cell CLL/lymphoma 2 (BCL2), cyclin-dependent kinase inhibitor 2A (CDKN2A), retinoblastoma 1 (RB1), Jun proto-oncogene (JUN), K (lysine) acetyltransferase 2A (KAT2A), V-MYB myeloblastosis viral oncogene homolog (MYB), cyclin-dependent kinase inhibitor 1A (CDKN1A), cyclin-dependent kinase 4 (CDK4), and V-AKT murine thymoma viral oncogene homolog 1 (AKT1) (Fig. 3B). Furthermore, we analyzed the mutation frequencies and copy number alterations (CNAs) for the five-gene signatures of MYC using the cBioPortal website and 153 different cancer studies. Among the 153 studies, seven different cancer studies representing 1,712 samples showed >50% alteration frequency with at least 100 samples in the dataset (Fig. 3C, left panel). The percentage of alterations for each cancer type and gene is presented in Supplementary Tables S4 and S5; the highest alteration frequency was found in ovarian cancer with a value of 91.46% and a range of 91.46∼54.35% in various types of cancers such as ovarian, esophagus, head and neck, pancreas, and colorectal cancers, and neuroendocrine prostate (NEP) cancers and lung adenocarcinoma (Fig. 3C, left panel; Supplementary Table S4). However, the amplification frequency of five-gene signatures was predominant in prostate (NEP) cancer with a value of 31.78% (Supplementary Table S4); the MYC amplification frequency was also highest in prostate (NEP) cancer with a value of 53% (Supplementary Table S5). We then analyzed the eight-gene signatures using the cBioPortal website. Among the 153 studies, 11 different cancer studies representing 2,873 samples showed a >50% alteration frequency with at least 100 samples in the dataset (Fig. 3C, right panel). As shown in Supplementary Table S6, the highest alteration frequency of eight-gene signatures was observed in uterine cancer at 96.36%, while the amplification percentage was highest in breast cancer (44.83%). Moreover, the alteration percentage of MYC was predominant in NEP cancer (Sup-plementary Table S7). As the highest alteration frequency of MYC was found in prostate cancer, we used OncoPrint to further query alterations in five-gene signatures (MYC, BCL2, TP53, MYB, and JUN) and eight-gene signatures (MYC, BCL2, TP53, MYB, JUN, CDK4, CDKN1A, and CDKN2A) using cBioPortal. The percentages of alterations in these genes in prostate cancer varied from 9∼53% for individual genes (MYC, 53%; BCL2, 9%; TP53, 29%; MYB, 12%; JUN, 21%; CDK4, 22%; CDKN1A, 18%; and CDKN2A, 21%) (Fig. 3D). Moreover, we confirmed the interacting nodes of MYC using cBioPortal. MYC was found to interact with TP53, CDKN2A, MYB, CDKN1A, BCL2, JUN, and CDK4 (Fig. 3E), suggesting that alterations in MYC expression partially modulate the development of various cancers via its association with other co-expressed genes.
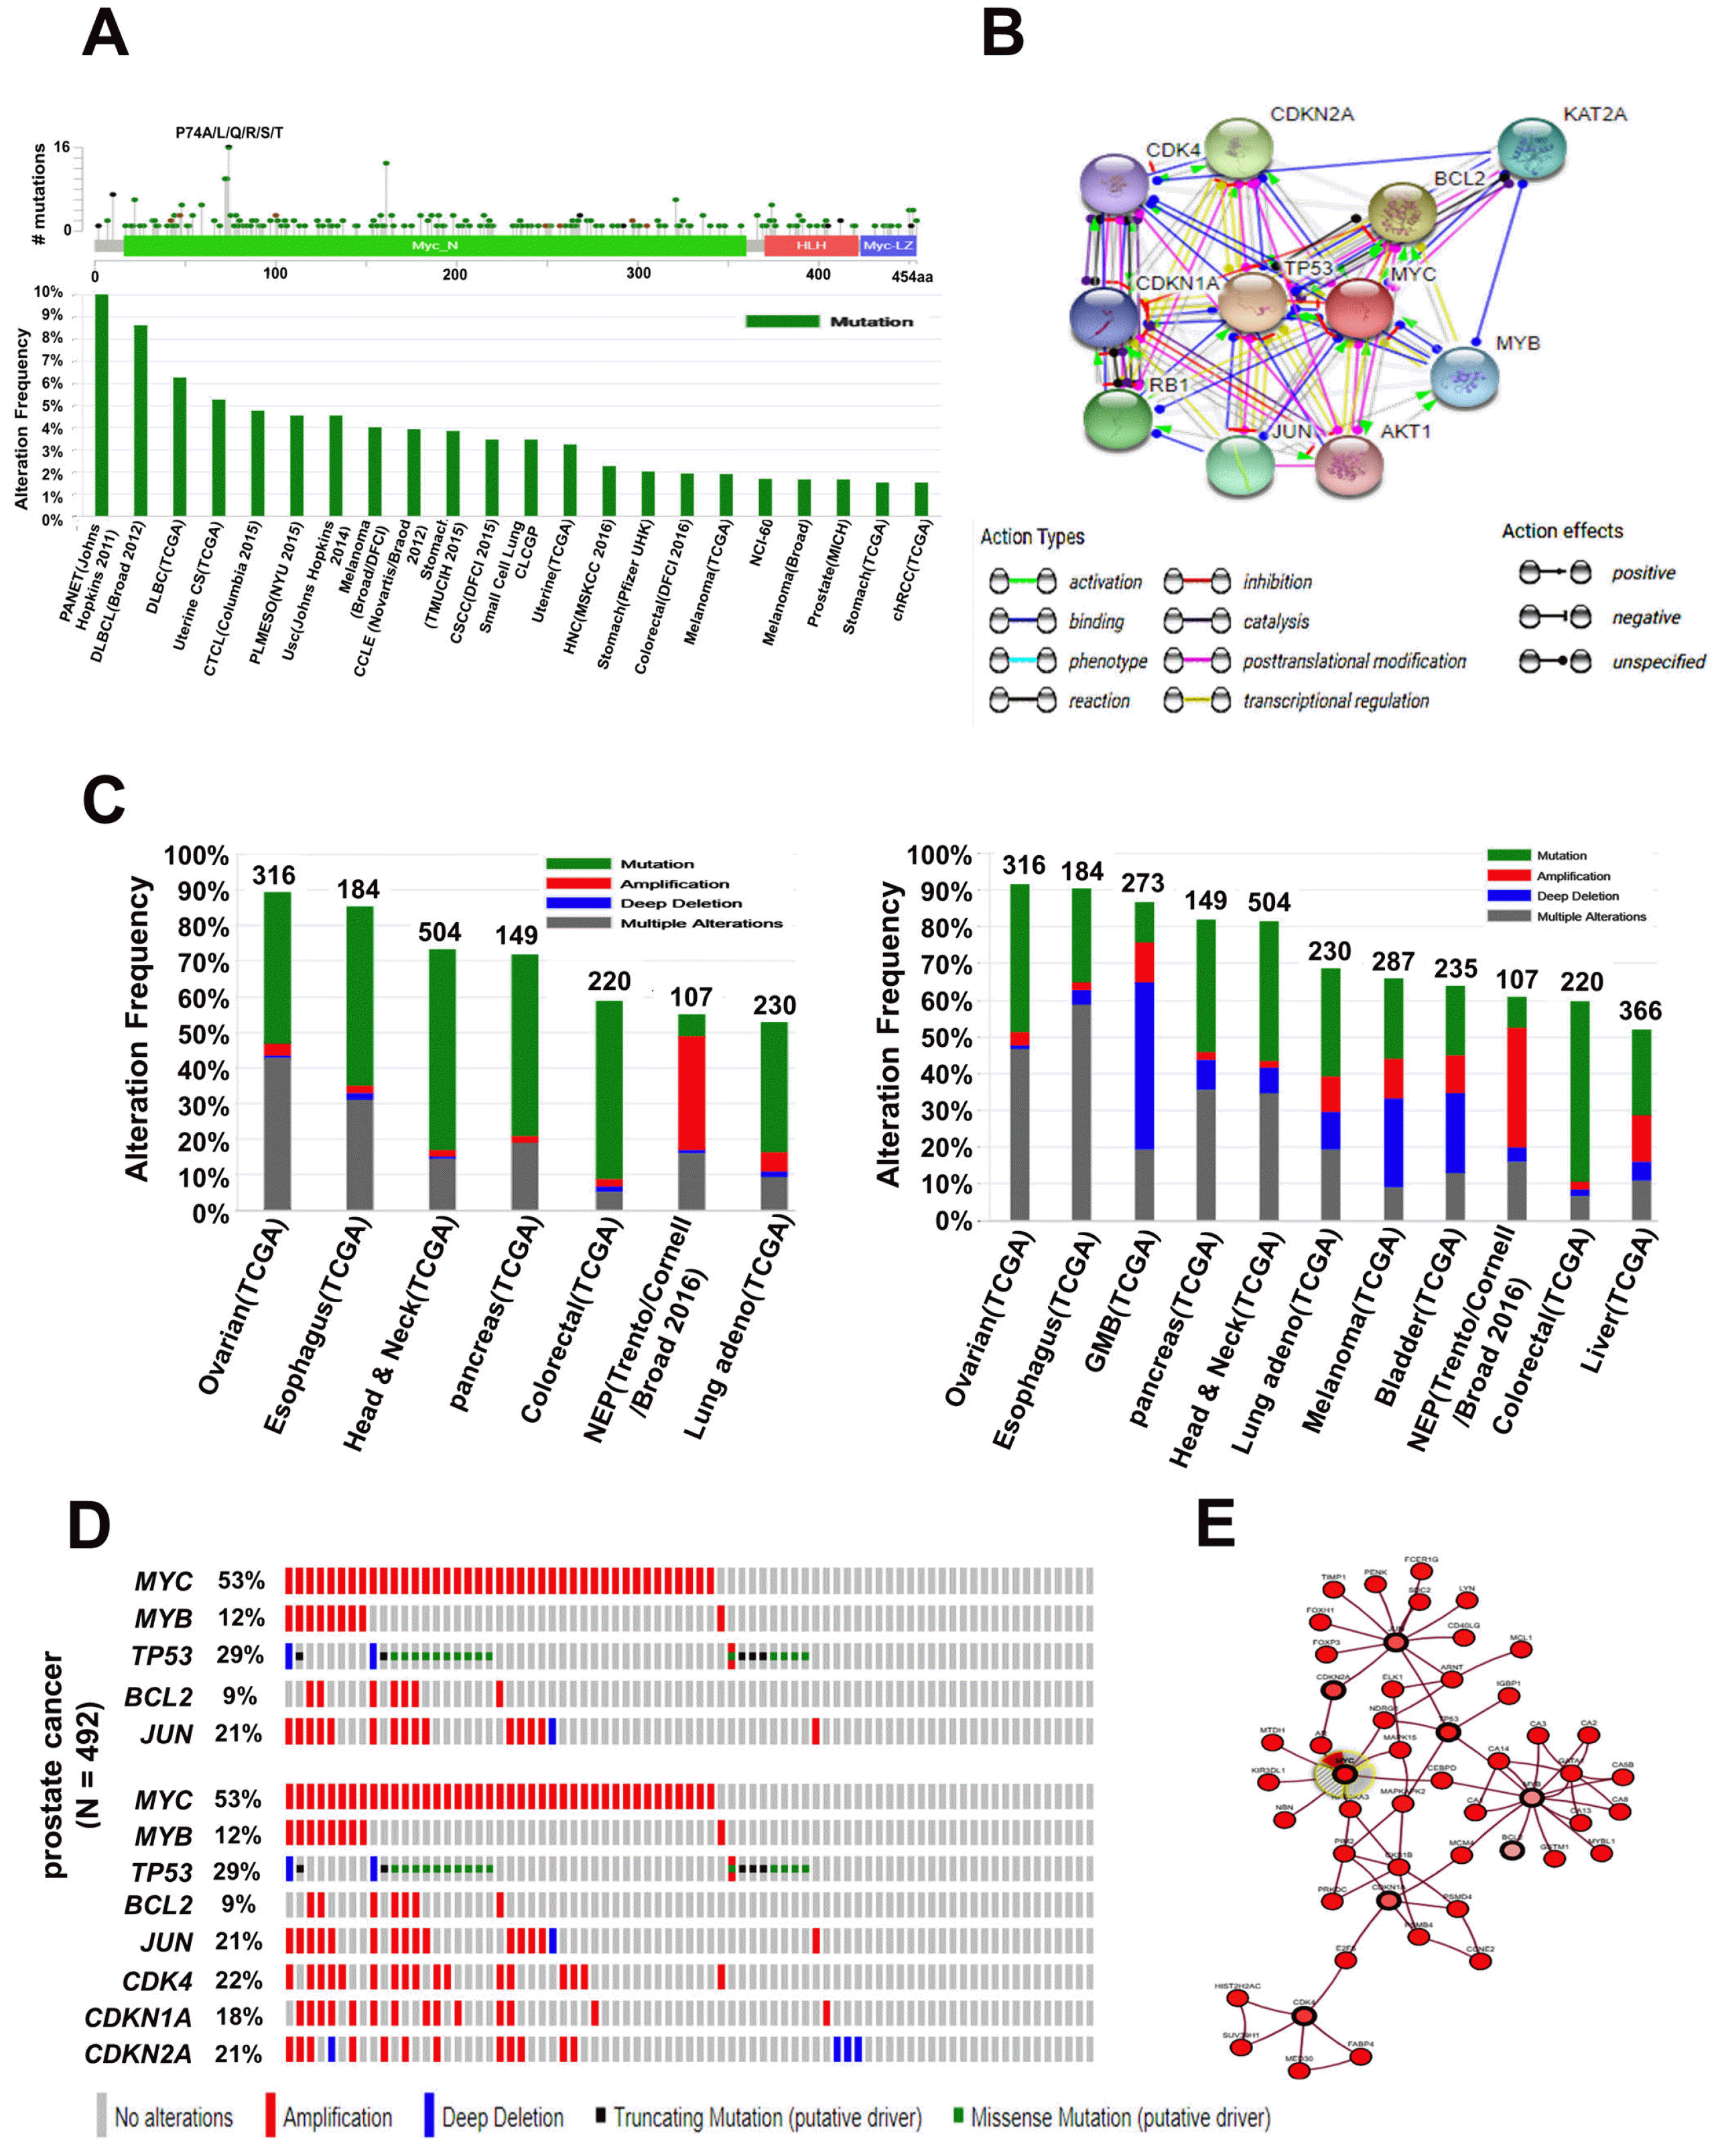
Fig. 3
MYC mutation and alteration frequency analysis in various types of cancer. (A) Mutation diagram of MYC in different types of cancer across protein domains. One hotspot (P74A/L/Q/R/S/T) represented the predominant mutations in the N-terminus of MYC (upper panel). Alteration frequencies of MYC mutation in various types of cancer (lower panel). (B) Interacting nodes display MYC protein interactions with other related proteins downloaded from STRING v10.5. (C) Copy number alterations of MYC-interacting genes and cancer subtypes were determined using cBioPortal (http://www.cbioportal.org). The alteration frequency of a five-gene signature (MYC, BCL2, TP53, MYB, JUN) (left panel) and alteration frequency of a seven-gene signature (MYC, BCL2, TP53, MYB, JUN, CDK4, CDKN1A, CDKN2A) are presented for various cancer subtypes (right panel). Only the types of cancer containing >100 samples and an alteration frequency of >50% are shown. Prostate cancer tends to amplify MYC frequently. (D) We used the Oncoprint feature of cBioPortal (http://www.cbioportal.org) to determine the copy number alteration frequency of each genes (BCL2, TP53, MYB, and JUN) in MYC within the prostate cancer subtype (upper panel); the percentages of the copy number alteration of each genes (MYC, BCL2, TP53, MYB, JUN, CDK4, CDKN1A, and CDKN2A) are presented in prostate cancer (lower panel). (E) Network view of MYC neighborhood in prostate cancer was downloaded from cBioPortal. MYC is a seed gene (indicated by a thick border), and all other genes were automatically found to be altered in prostate cancer. Darker red indicates an increased frequency of alterations (defined as mutations, copy number amplifications, or homozygous deletions) in prostate cancer. MYC: myelocytomatosis oncogene, MYB: myeloblastosis oncogene, TP53: tumor protein p53, BCL2: B-cell CLL/lymphoma 2, JUN: Jun proto-oncogene, CDK4: cyclin-dependent kinase 4, CDKN1A: cyclin-dependent kinase in- hibitor 1A, CDKN2A: cyclin-dependent kinase inhibitor 2A, STRING: search tool for recurring instances of neighboring genes, TCGA: the cancer genome atlas.
![]()
MYCL
According to the Oncomine database, similarly to MYC, the expression patterns of MYCL varied between different types of cancer (Fig. 1B). We found that the fold-change in MYCL expression was greater in the lung, ovarian, brain, lymphoma, and bladder cancer, whereas melanoma and pancreatic cancer showed lower expression than normal tissues (Fig. 4A∼C); The expression of MYCL in various cancer subtypes is summarized in Supplementary Table S8. To further elucidate the role of MYCL in cancer prognosis, the prognostic value of MYCL expression in brain, breast, colorectal, lung, ovarian, and prostate cancer patients was determined using the PrognoScan database according to the parameter of p-value<0.05 (Fig. 4D and Supplementary Table S9). Interestingly, patients with high MYCL expression showed poor clinical outcomes in lung, brain, lymphoma, and ovarian cancers, while good survival rates were observed in melanoma and pancreatic cancers (Fig. 4E), suggesting that MYCL expression is also related to differential clinical cancer prognosis.
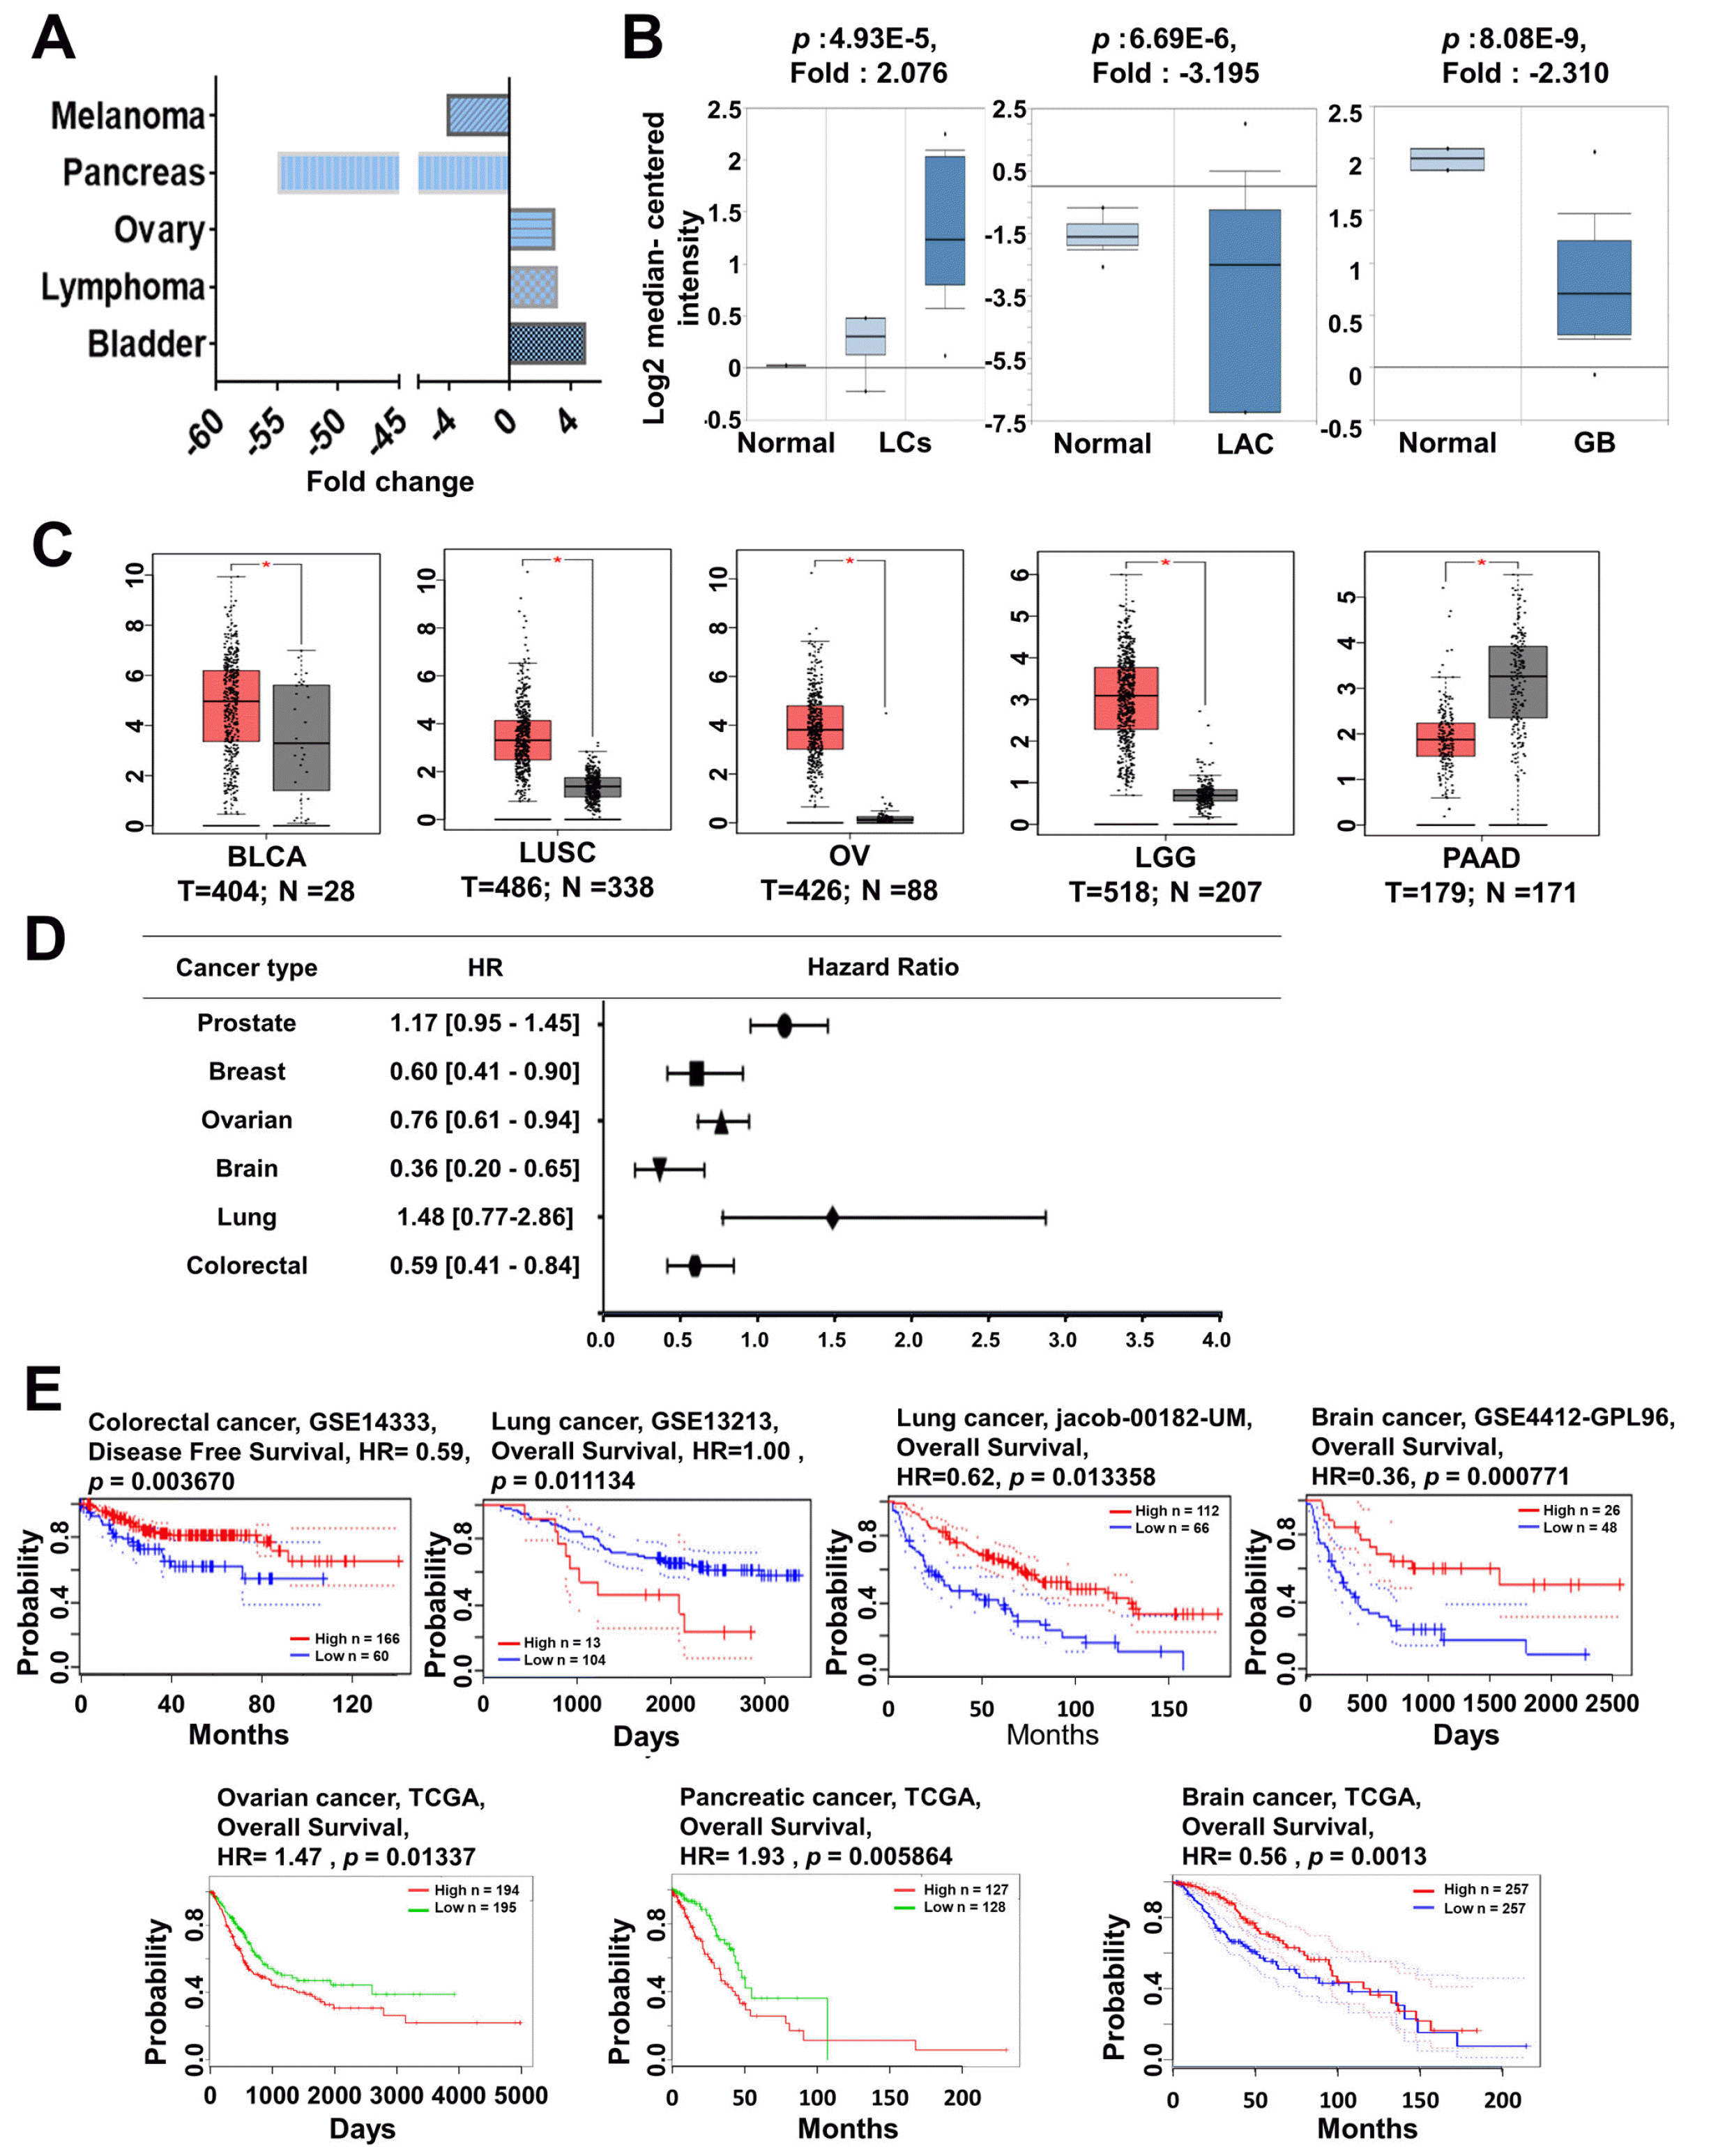
Fig. 4
MYCL mRNA expression and prognosis analysis in different types of cancer. (A) MYCL expression was analyzed in various types of cancer using the Oncomine database. The plots show the expression of MYCL in various types of cancer. (B) MYCL expression was analyzed using the Oncomine database and is represented as a box plot in lung, ovarian, brain, lymphoma, and pancreatic cancers relative to their normal tissues. (C) MYCL expression was analyzed using TCGA data via GEPIA and is represented as a box plot in lung, ovarian, brain, and pancreatic cancers (red box plot) relative to their normal tissues (grey box plot) with a threshold of p-value<0.05. (D) The prognostic value of MYCL was analyzed using the Prognoscan database and is represented as the hazard ratio. (E) The survival curve comparing patients with high (red) and low (black/blue/green) expression was plotted using the Kaplan-Meier Plotter, R2, and SurvExpress databases. Survival curves indicated the relationship between patient survival and MYCL expression in various cancers with a threshold of Cox p-value<0.05. LCs: lung cancers, LAC: lung adeno-carcinoma, OSC: ovarian serous cystadenocarcinoma, AOG: anaplastic oligodendroglioma, NKC: natural killer cell, TL: T-lymphocyte, TLNKC: T-lymphocyte and natural killer cell, CHL: classical Hodgkin’s lymphoma, BLCA: bladder urothelial carcinoma, LUSC: lung squamous cell carcinoma, OV: ovarian serous cystadenocarcinoma, LGG: brain lower grade glioma, PAAD: pancreatic adenocarcinoma, GB: glioblastoma, HR: hazard ratio, TCGA: the cancer genome atlas, GSE: gene set enrichment, GEPIA: gene expression profiling interactive analysis.
![]()
Next, we focused on the underlying mechanism of cancer development involving MYCL expression. We analyzed the co-expression profile of MYCL using Oncomine database (Supplementary Fig. S2a, c, e, and g). The co-expression profile of MYCL was investigated using a large cluster of 12,624 genes across 45 cutaneous melanoma, 18 benign melanocytic skin nevus, and 7 normal tissues (Sup-plementary Fig. S2a), and 5,388 genes across 31 ovarian serous adenocarcinoma and 3 normal samples (Supplementary Fig. S2c), 19,574 genes across 10 colon carcinoma and 10 normal samples (Supplementary Fig. S2e), and 5,388 genes across 10 pancreatic adenocarcinoma and 5 normal samples (Supplementary Fig. S2g). Interestingly, this also suggests that MYCL and its associated genes are downregulated in melanoma, which may lead to metastatic tumor progression (Supplementary Fig. S2a). Furthermore, we identified genes co-expressed with MYCL in cBioPortal and investigated the GO using DAVID Bioinformatics Resources 6.8 for melanoma; the GO results showed the top 10 significant GO processes contributing to melanoma development (Supplementary Fig. S2b). Among the 10 biological functions, no common biological function for MYCL was found between melanoma, ovarian, colorectal, and pancreatic cancers (Supplementary Fig. S2b, d, f, and h). MYCL was found to be involved in several biological functions, including endocytosis pathway in melanoma, extracellular matrix (ECM)-receptor interactions, focal adhesion in ovarian cancer, N-glycan biosynthesis and spliceosome in colorectal cancer, and shigellosis and various signal transduction pathways in pancreatic cancer (Supplementary Fig. S2b, d, f, and h), which implies that the expression of MYCL could regulate cancer progression with the help of its co-expression genes.
Using cBioPortal, next, we determined the number of mutation alterations in the MYCL protein arm. We found that mutations arose all over the MYCL protein sequence and highlighted one hotspot (A303V) representing common founder mutations in the helix-loop-helix (HLH) domain of MYCL (Fig. 5A, upper panel). The mutation alteration frequency of MYCL was approximately 1.6% in uterine CS (TCGA) and ranged from 0.2∼1.6% (Fig. 5A, lower panel). We then focused on the proteins interacting with MYCL using the STRING v10.5 database and selected the 10 predicted functional protein partners of MYCL based on previous publications and curated databases (Fig. 5B). The selected proteins with the corresponding gene names were as follows: rearranged MYCL fusion (RLF), complement component 1 q subcomponent binding protein (C1QBP), peptidylprolyl isomerase E (PPIE), collagen type IX alpha 2 (COL9A2), immediate early response 5 (IER5), zinc finger and BTB domain containing 48 (ZBTB48), zinc finger and SCAN domain containing 22 (ZSCAN22), HKR1, GLI-Kruppel zinc finger family member (HKR1), GLI family zinc finger 4 (GLI4), and tumor protein p53 (TP53) (Fig. 5B). Among them, five genes, including MYCL, TP53, RLF, PPLE, and COL9A2, showed high alterations in various cancers and were predominantly altered in ovarian cancer. The five-gene signature results were analyzed in 5 different cancer studies representing 1,373 samples showing a >50% alteration frequency with at least 100 samples in the dataset (Fig. 5C, left panel; Supplementary Tables S10); furthermore, seven genes, MYCL, TP53, RLF, PPLE, COL9A2, IER5, and GLI4, showed a relatively higher amplification than the five-gene signatures and were also predominantly altered in ovarian cancer. The results for the seven-gene signatures analyzed 7 different cancer studies representing 1,969 samples containing a >50% alteration frequency with at least 100 samples in the dataset (Fig. 5C, right panel; Supplementary Table S11). Next, we used the OncoPrint data from a query for alterations in the five- and seven-gene signatures. For the five-gene signature, the percentages of alterations among ovarian cancers varied from 10% to 96% for individual gene alterations, i.e., MYCL, 10%; TP53, 96%; RLF, 10%; PPLE, 10%; COL9A2, 10%. Two additional gene alterations were IER5 (3%) and GLI4 (23%) (Fig. 5D, Supplementary Table S12, and S13). The interacting network of the MYCL protein was also confirmed using cBioPortal (Fig. 5E), which suggested that MYCL and its co-expressed genes are involved in the progression of various cancers.
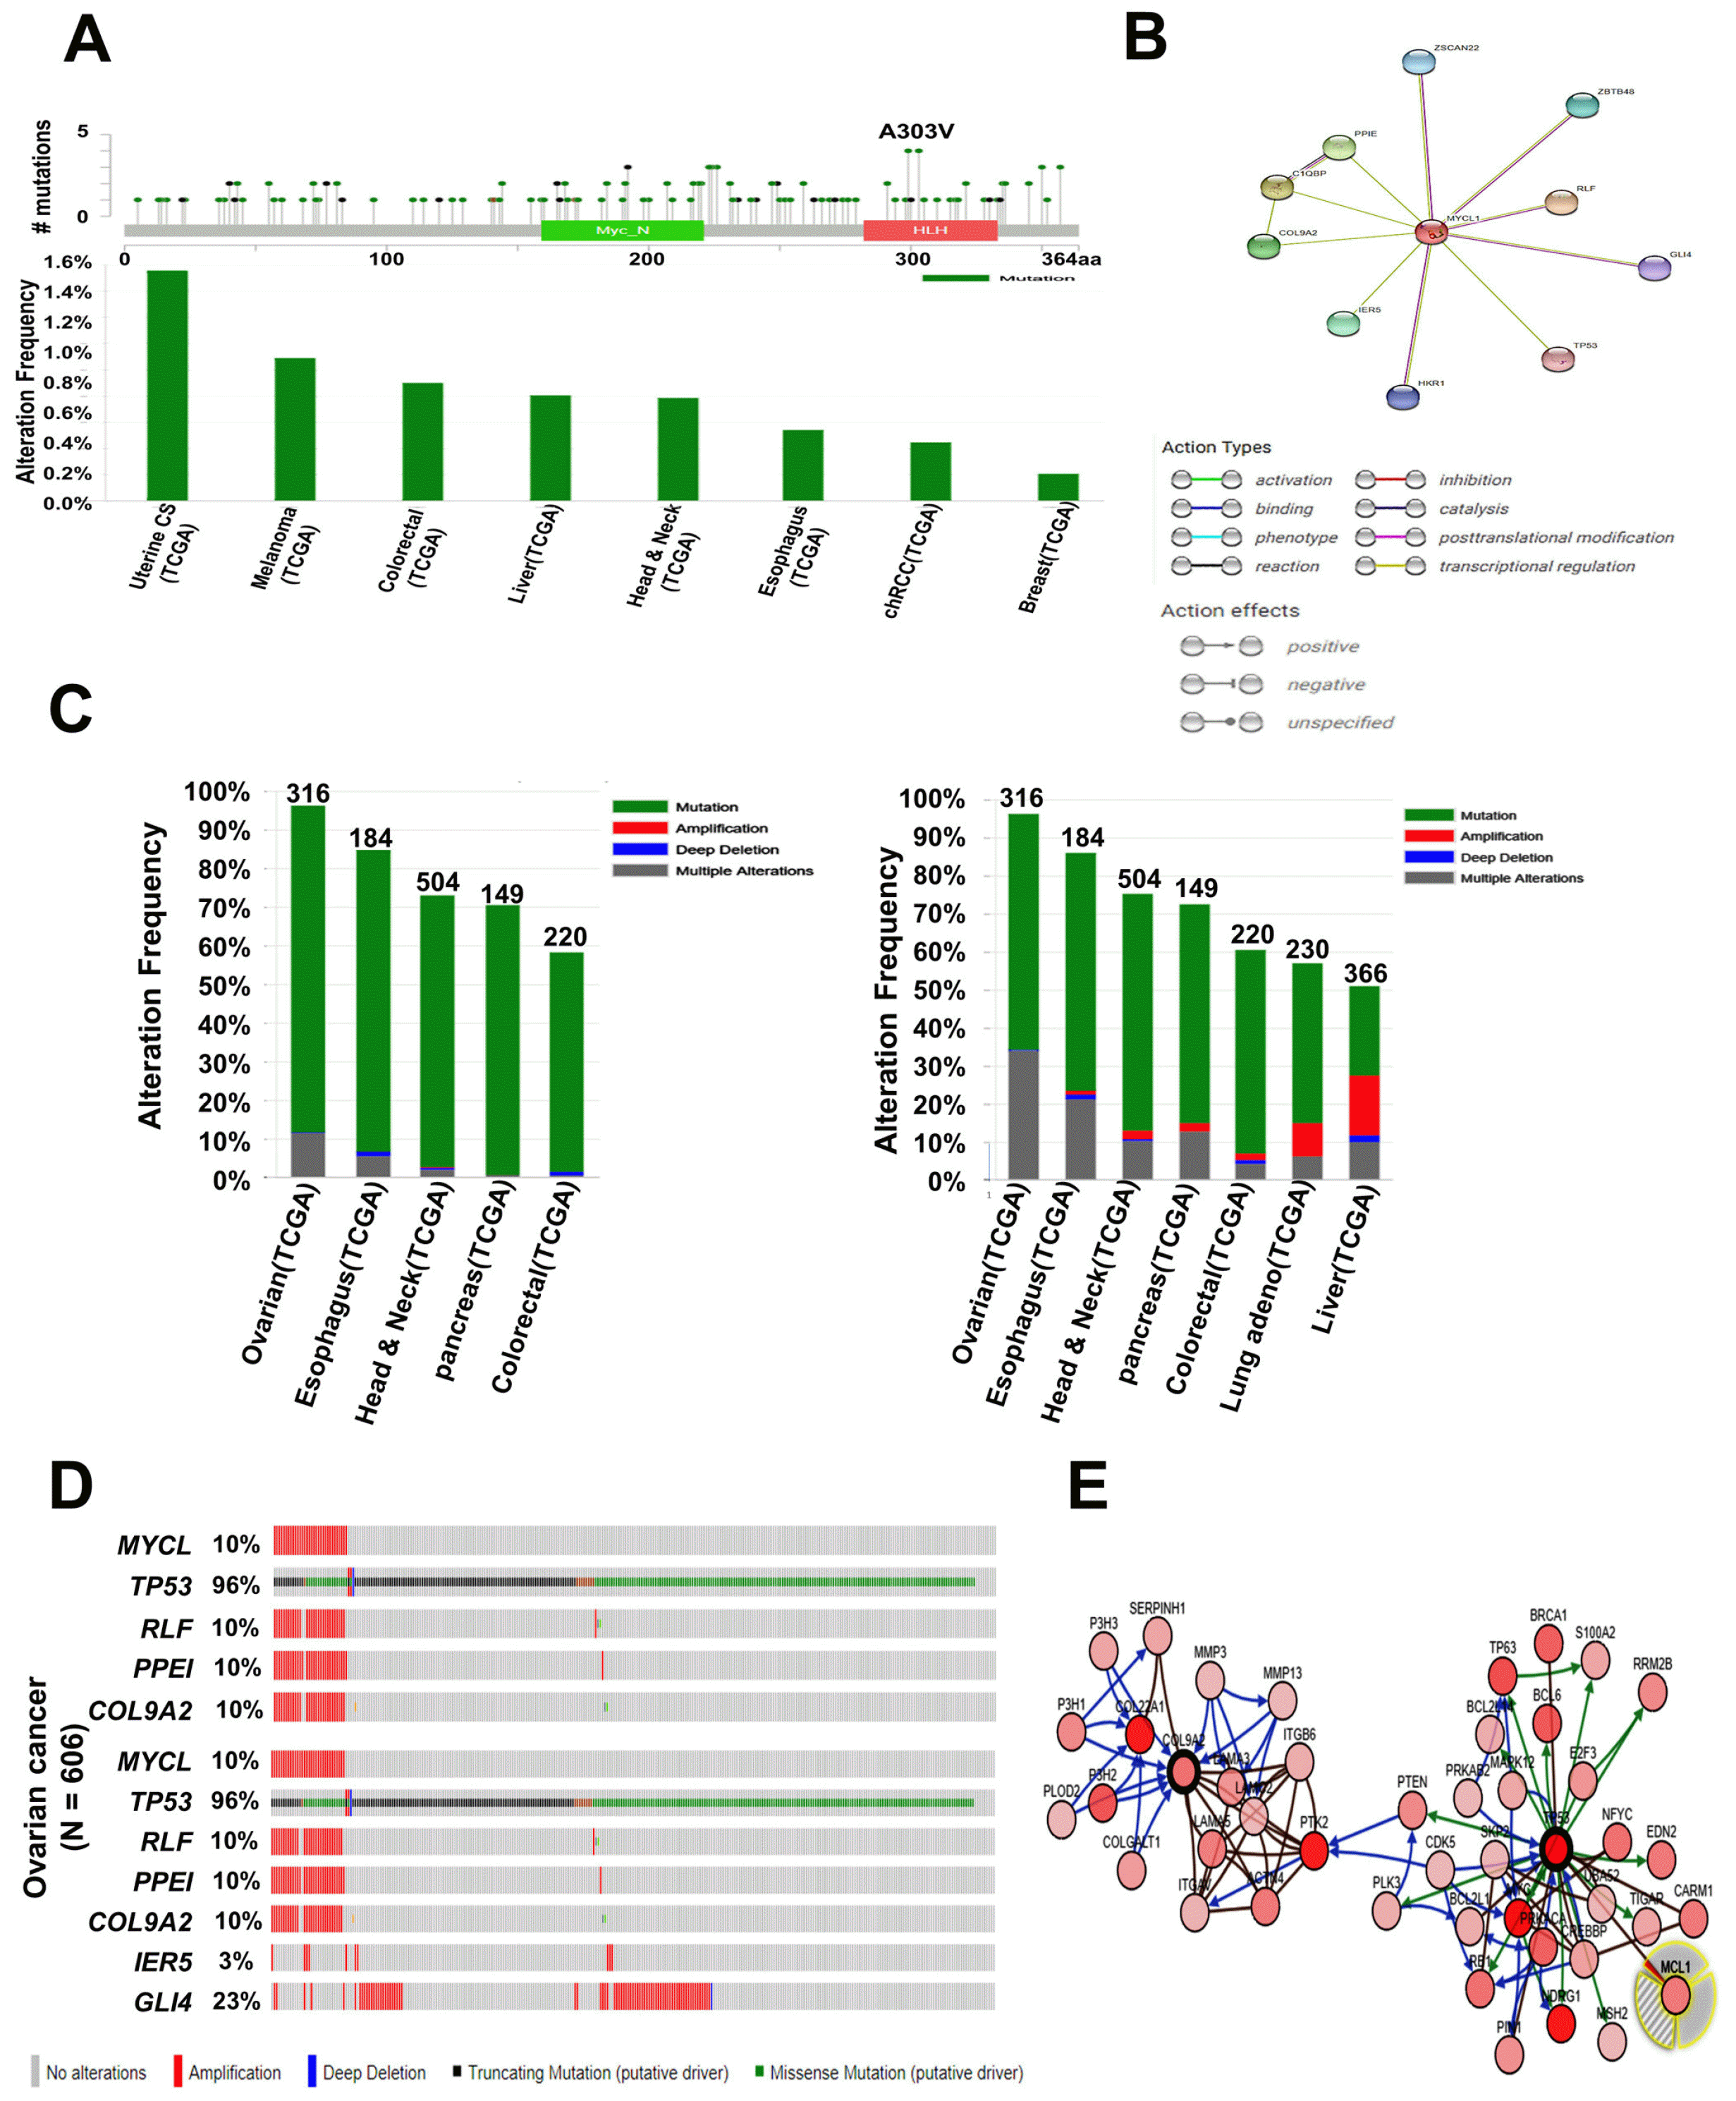
Fig. 5
MYCL mutation and alteration frequency analysis in various types of cancer. (A) Mutation diagram of MYCL in different types of cancer across protein domains. One hotspot (A303V) represented the predominant mutations in the MYCL HLH domain (upper panel). Alteration frequencies of MYCL mutation are shown in various types of cancer (lower panel). (B) Interacting nodes display MYCL protein interactions with other related proteins, retrieved from STRING v10.5. (C) The copy number alterations of MYCL-interacting genes and cancer subtypes were determined using cBioPortal (http://www.cbioportal.org). The alteration frequencies of a five-gene signature (MYCL, TP53, RLF, PPLE, COL9A2) (left panel) and a seven-gene signature (MYCL, TP53, RLF, PPLE, COL9A2, IER5, GLI4) were determined in various cancer subtypes (right panel). Only the types of cancer containing >100 samples and an alteration frequency of >50% are shown. (D) Ovarian cancer tends to amplify MYCL frequently. We used the Oncoprint feature of cBioPortal (http://www.cbioportal.org) to determine the copy number alteration frequencies of each genes (TP53, RLF, PPLE, and COL9A2) in MYCL within ovarian cancer subtypes (upper panel); the percentages of alterations of each genes (MYCL, TP53, RLF, PPLE, COL9A2, IER5, and GLI4) is presented in ovarian cancer (lower panel). (E) Network view of the MYCL neighborhood in ovarian cancer was downloaded from cBioPortal. MYCL is a seed gene (indicated by a thick border), and all other genes were automatically found to be altered in ovarian cancer. Darker red indicates an increased frequency of alterations (defined as mutations, copy number amplifications, or homozygous deletions) in ovarian cancer. TCGA: the cancer genome atlas, STRING: search tool for recurring instances of neighboring genes.
![]()
MYCN
To determine the status of MYCN expression in the different types of cancer, we first used the Oncomine database to evaluate MYCN expression in various types of cancer with the thresholds described above. The expression of MYCN was upregulated in ovarian, leukemia, and colorectal cancer, while MYCN expression was downregu-lated in myeloma, kidney cancer, and lymphoma (Fig. 6A and B; Supplementary Table S14). Moreover, from the TCGA database, we found that the expression of MYCN was upregulated in leukemia and ovarian cancer (Fig. 6C), which is in agreement with the data from the Oncomine database. Similarly, to other MYC members, the diversity of MYCN expression in various cancers suggests that they may play a role as oncogenes or tumor suppressors. We then focused on the correlation between the expression of MYCN and cancer prognosis using various survival databases. To determine the effect of MYCN on clinical outcomes, the prognostic value of MYCN expression in brain, colorectal, breast, lung, blood, skin, ovarian, and eye cancer patients was determined using the PrognoScan database according to the parameter of a p-value<0.05 (Fig. 6D and Supplementary Table S15). Moreover, high levels of MYCN expression were associated with a poor survival rate in ovarian and colorectal cancer patients, while the survival rate of kidney and blood cancer patients was increased when MYCN expression was high (Fig. 6E). Our clinical meta-analysis data showed that high expression of MYCN in ovarian and colon cancer led to a poor prognosis. These results suggest that high expression of MYCN is directly correlated with the clinical prognosis of cancer patients.
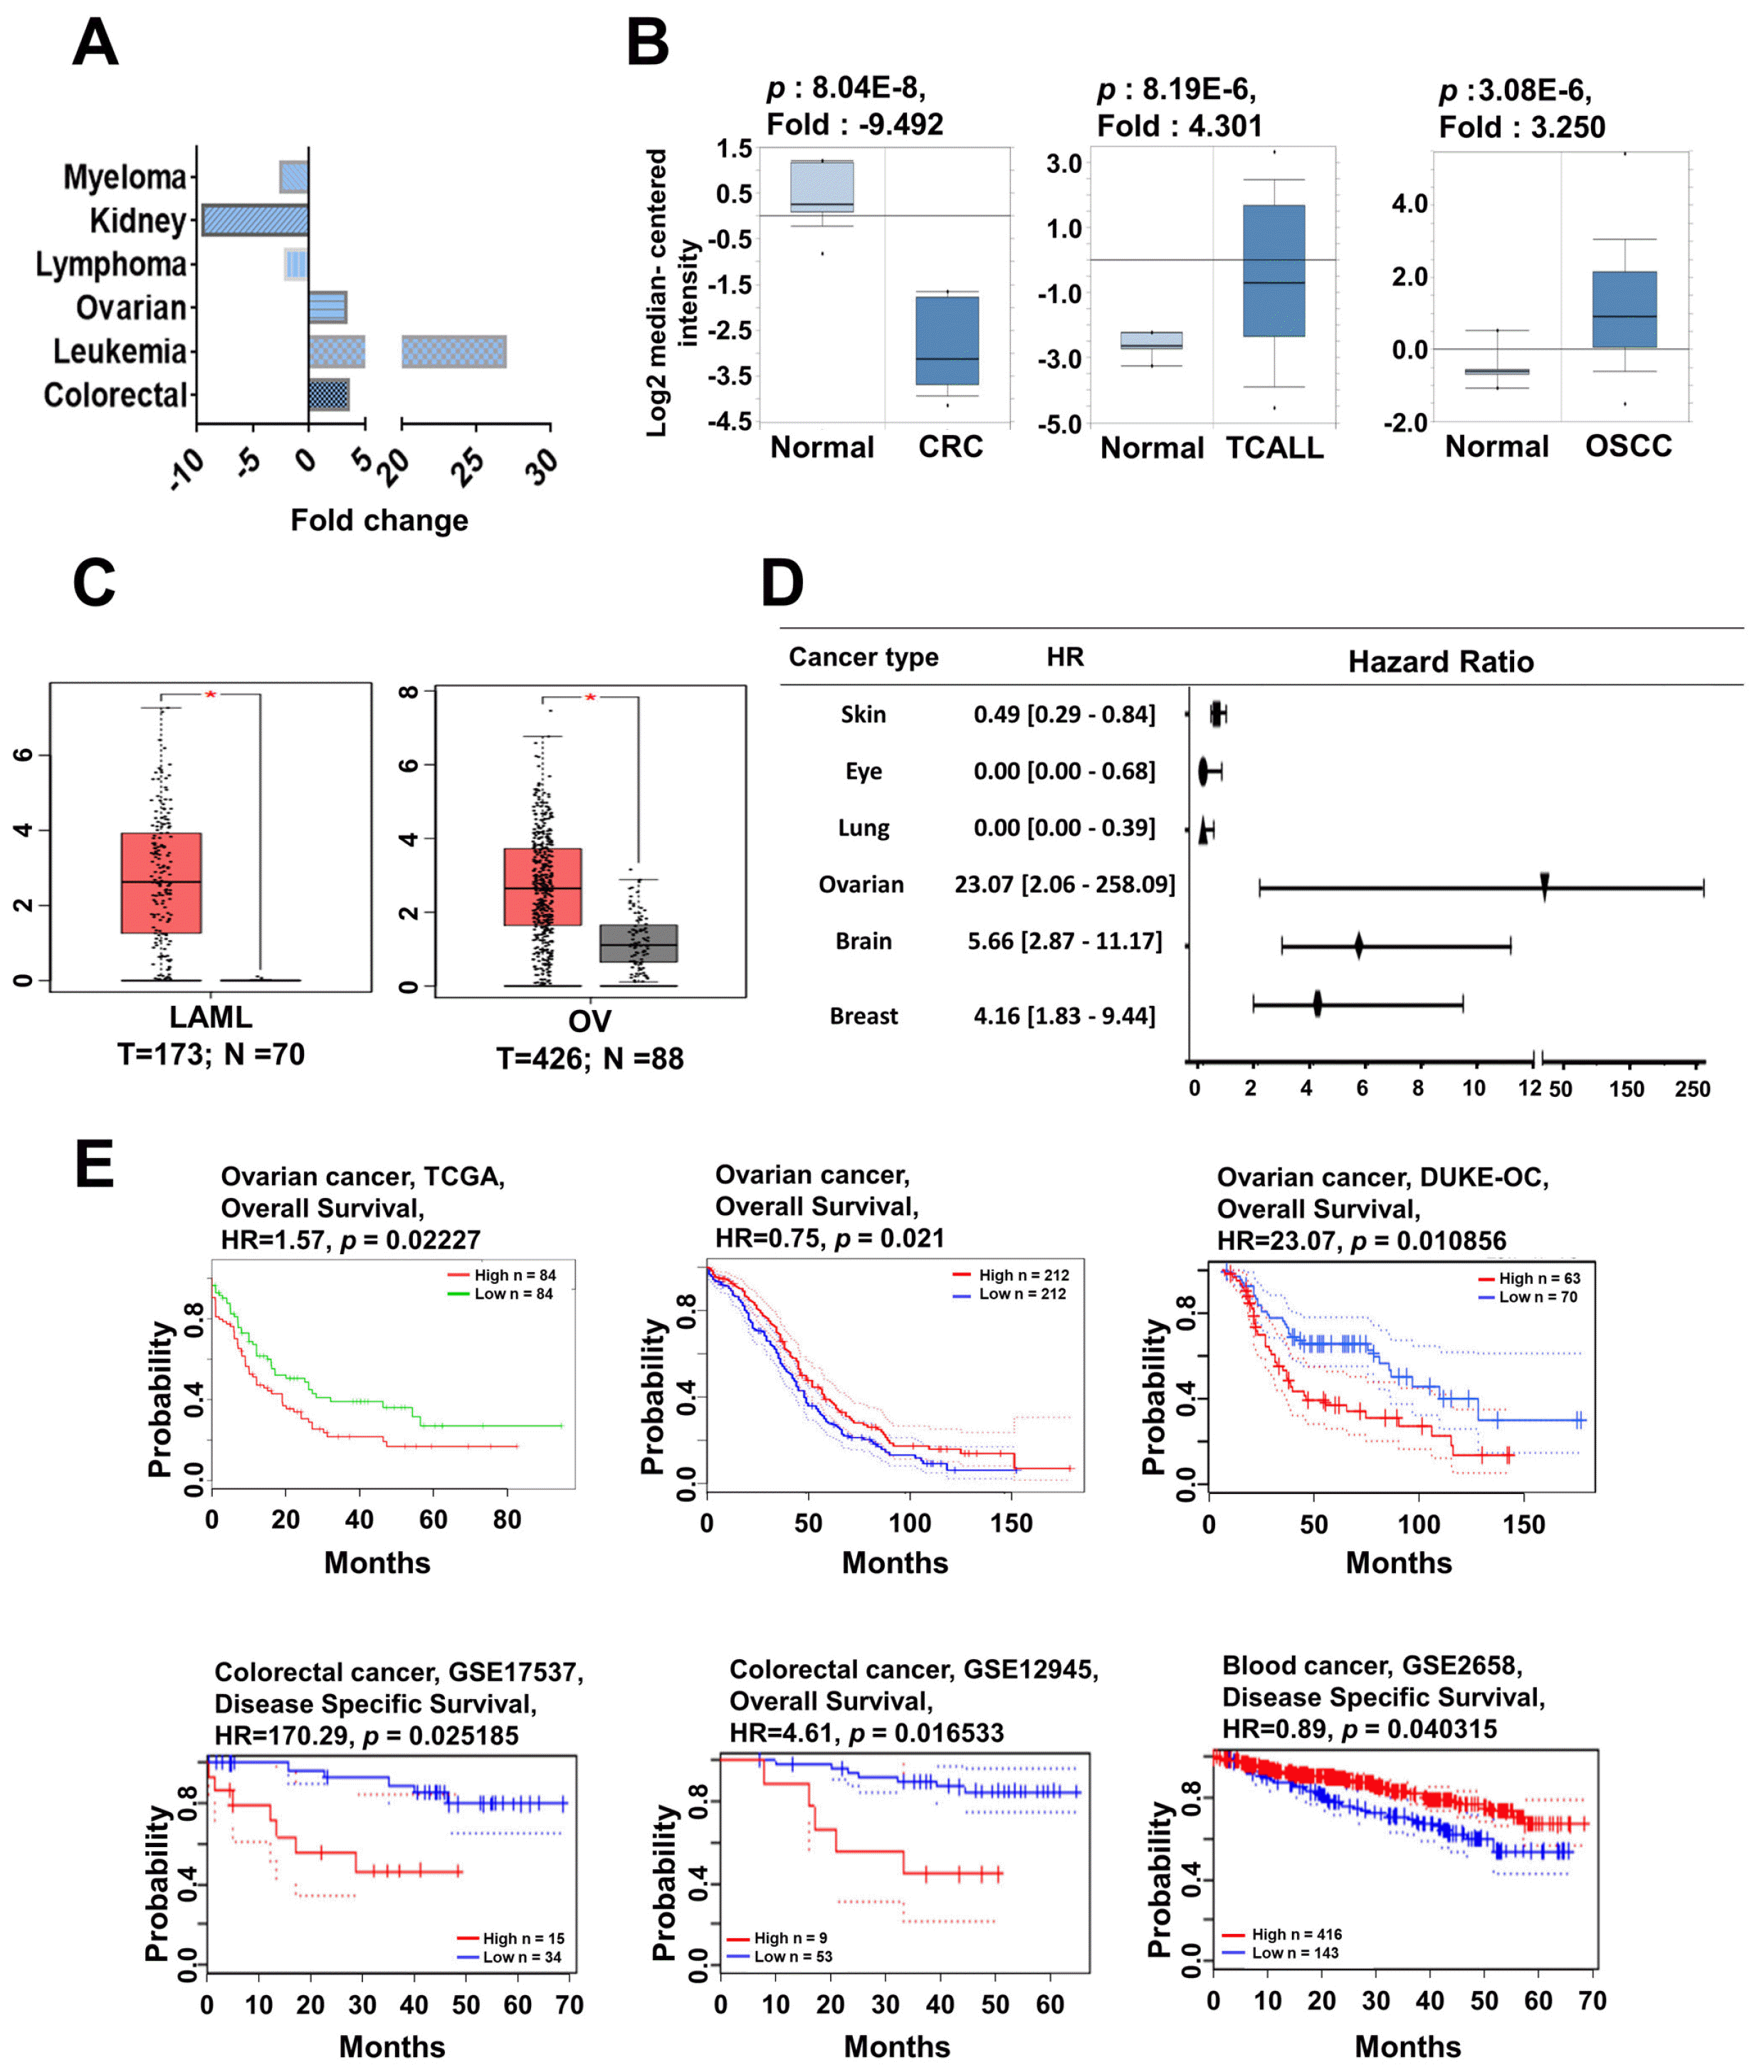
Fig. 6
MYCN mRNA expression and prognosis analysis in different types of cancer. (A) MYCN mRNA expression was analyzed in various types of cancer using the Oncomine database. The plot shows the expression of MYCN in various types of cancer. (B) MYCL mRNA expression was analyzed using the Oncomine database and are represented as box plots in renal, leukemia, ovarian, and rectal cancers relative to their normal tissues. (C) MYCL mRNA expression was analyzed using TCGA data via GEPIA and is presented as box plots in leukemia and ovarian cancers (red box plot) relative to their normal tissues (grey box plot) with a threshold of p-value<0.05. (D) The prognostic value of MYCN was analyzed using the Prognoscan database and presented as the hazard ratio. (E) The survival curve comparing patients with high (red) and low (blue) expression was plotted using the PrognoScan, GEPIA, SurvExpress databases. The survival curves indicated the relationship between patient survival probability and MYCL expression in various types of cancer with a threshold of Cox p-value<0.05. CRC: clear cell renal cell carcinoma, TCALL: T-cell childhood acute lymphoblastic leukemia, OSCC: ovarian serous cystadenocarcinoma, LAML: acute myeloid leukemia, OV: ovarian serous cystadenocarcinoma, GEPIA: gene expression profiling interactive analysis, HR: hazard ratio, TCGA: the cancer genome atlas, GSE: gene set enrichment, GEPIA: gene expression profiling interactive analysis.
![]()
To determine the underlying mechanism of cancer progression based on MYCN expression, the co-expression profile of MYCN in leukemia, ovarian, and kidney cancer was extracted from the Oncomine database (Supplementary Fig. S3a, c, and e). The co-expression profile of MYCN was identified in a large cluster of 12,624 genes across 19 chronic adult T-cell leukemia/lymphoma, 22 acute adult T-cell leukemia/lymphoma, and 6 normal tissues (Supplementary Fig. S3a), 5,338 genes across 31 ovarian serous adenocarcinoma and 3 normal samples, and 12,624 genes across 10 clear cell renal cell carcinoma and 10 normal samples (Supplementary Fig. S3c and e). Next, we extracted the co-expression profile of MYCN using cBio-Portal and determined the GO using DAVID Bioinforma-tics Resources 6.8 in leukemia, which revealed the top 10 significant GO process contributions in leukemia (Supplementary Fig. S3b). Among the 10 biological functions, no common biological function for MYCN was found between leukemia, ovarian, and renal cancer, indicating that MYCN has variable effects in regulating cancer progre-ssion. In leukemia, MYCN was found to predominantly contribute to biological functions, including the role of lysosomes and proteasomes (Supplementary Fig. S3b). Moreover, MYCN predominantly contributed to ECM-receptor interactions and the calcium signaling pathway in ovarian cancer, and the cell cycle and small cell lung cancer in renal cancer (Supplementary Fig. S3d and f), suggesting that MYCN expression partially contributes to cancer progression by modulating diverse signaling pathways.
Next, using cBioPortal, we identified mutations located in the MYCN protein sequence and found one hotspot, E47Gfs*8/P45Rfs*86. Mutations were commonly found in the N-terminus of the MYCN protein (Fig. 7A, upper panel). We then evaluated the MYCN alteration frequency of mutations in various types of cancer with a range of 1∼9%, where ∼9% of mutations predominantly occurred in lung adenocarcinoma (Fig. 7A, lower panel). The predicted functional partners of MYCN were downloaded from STRING v10.5 and used to display the interacting nodes (Fig. 7B). The 10 predicted interacting proteins of MYCN (with the corresponding gene names) included: tumor protein p53 (TP53), MYCN downstream regulated 1 (NDRG1), cyclin-dependent kinase inhibitor 2A (CDKN2A), B-cell CLL/lymphoma 2 (BCL2), cyclin D1 (CCND1), vascular endothelial growth factor A (VEGFA), neurotrophic tyrosine kinase receptor type 1 (NTRK1), Wilms tumor 1 (WT1), phosphatase and tensin homolog (PTEN), and sonic hedgehog (SHH) (Fig. 7B). Among the 10 genes, we analyzed the five-gene signatures (MYCN, NDRG1, NTRK1, PTEN, and TP53) of mutations and CNAs using cBioPortal for 153 different cancer studies. The results of 12 different cancer studies representing 3,083 samples containing a >50% alteration frequency with at least 100 samples in the dataset were analyzed (Fig. 7C, left panel) and the seven-gene signatures (MYCN, NDRG1, NTRK1, PTEN, TP53, CCND1, and VEGFA) of mutations and CNAs using the cBioPortal tool with 153 different cancer studies (Fig. 7C, right panel). The five and seven-gene signatures showed high alteration frequencies of 52∼92% in various cancers; the highest alteration frequency was observed in ovarian cancer with a value of ∼92% (Fig. 7C, Supplementary Tables S16-S19). The percentages of alterations in the seven individual genes in ovarian cancer varied as follows: MYCN, 4%; NDRG1, 38%; NTRK1, 7%; PTEN, 6%; TP53, 58%; CCND1, 7%; and VEGFA, 5%. The TP53 gene was predominantly amplified in ovarian cancer (Supplementary Table S17). Additionally, NEP cancer was found to present gene alterations for the above five- and seven-gene signatures, where amplification was the most common alteration (Fig. 7D). This implies that MYCN may be overexpressed or underexpressed, regulated CNAs and mutations in various cancers, and was correlated with clinical outcomes. Taken together, our systematic analysis provided their roles in several cancers based on clinical data on MYC family genes (Fig. 7E).
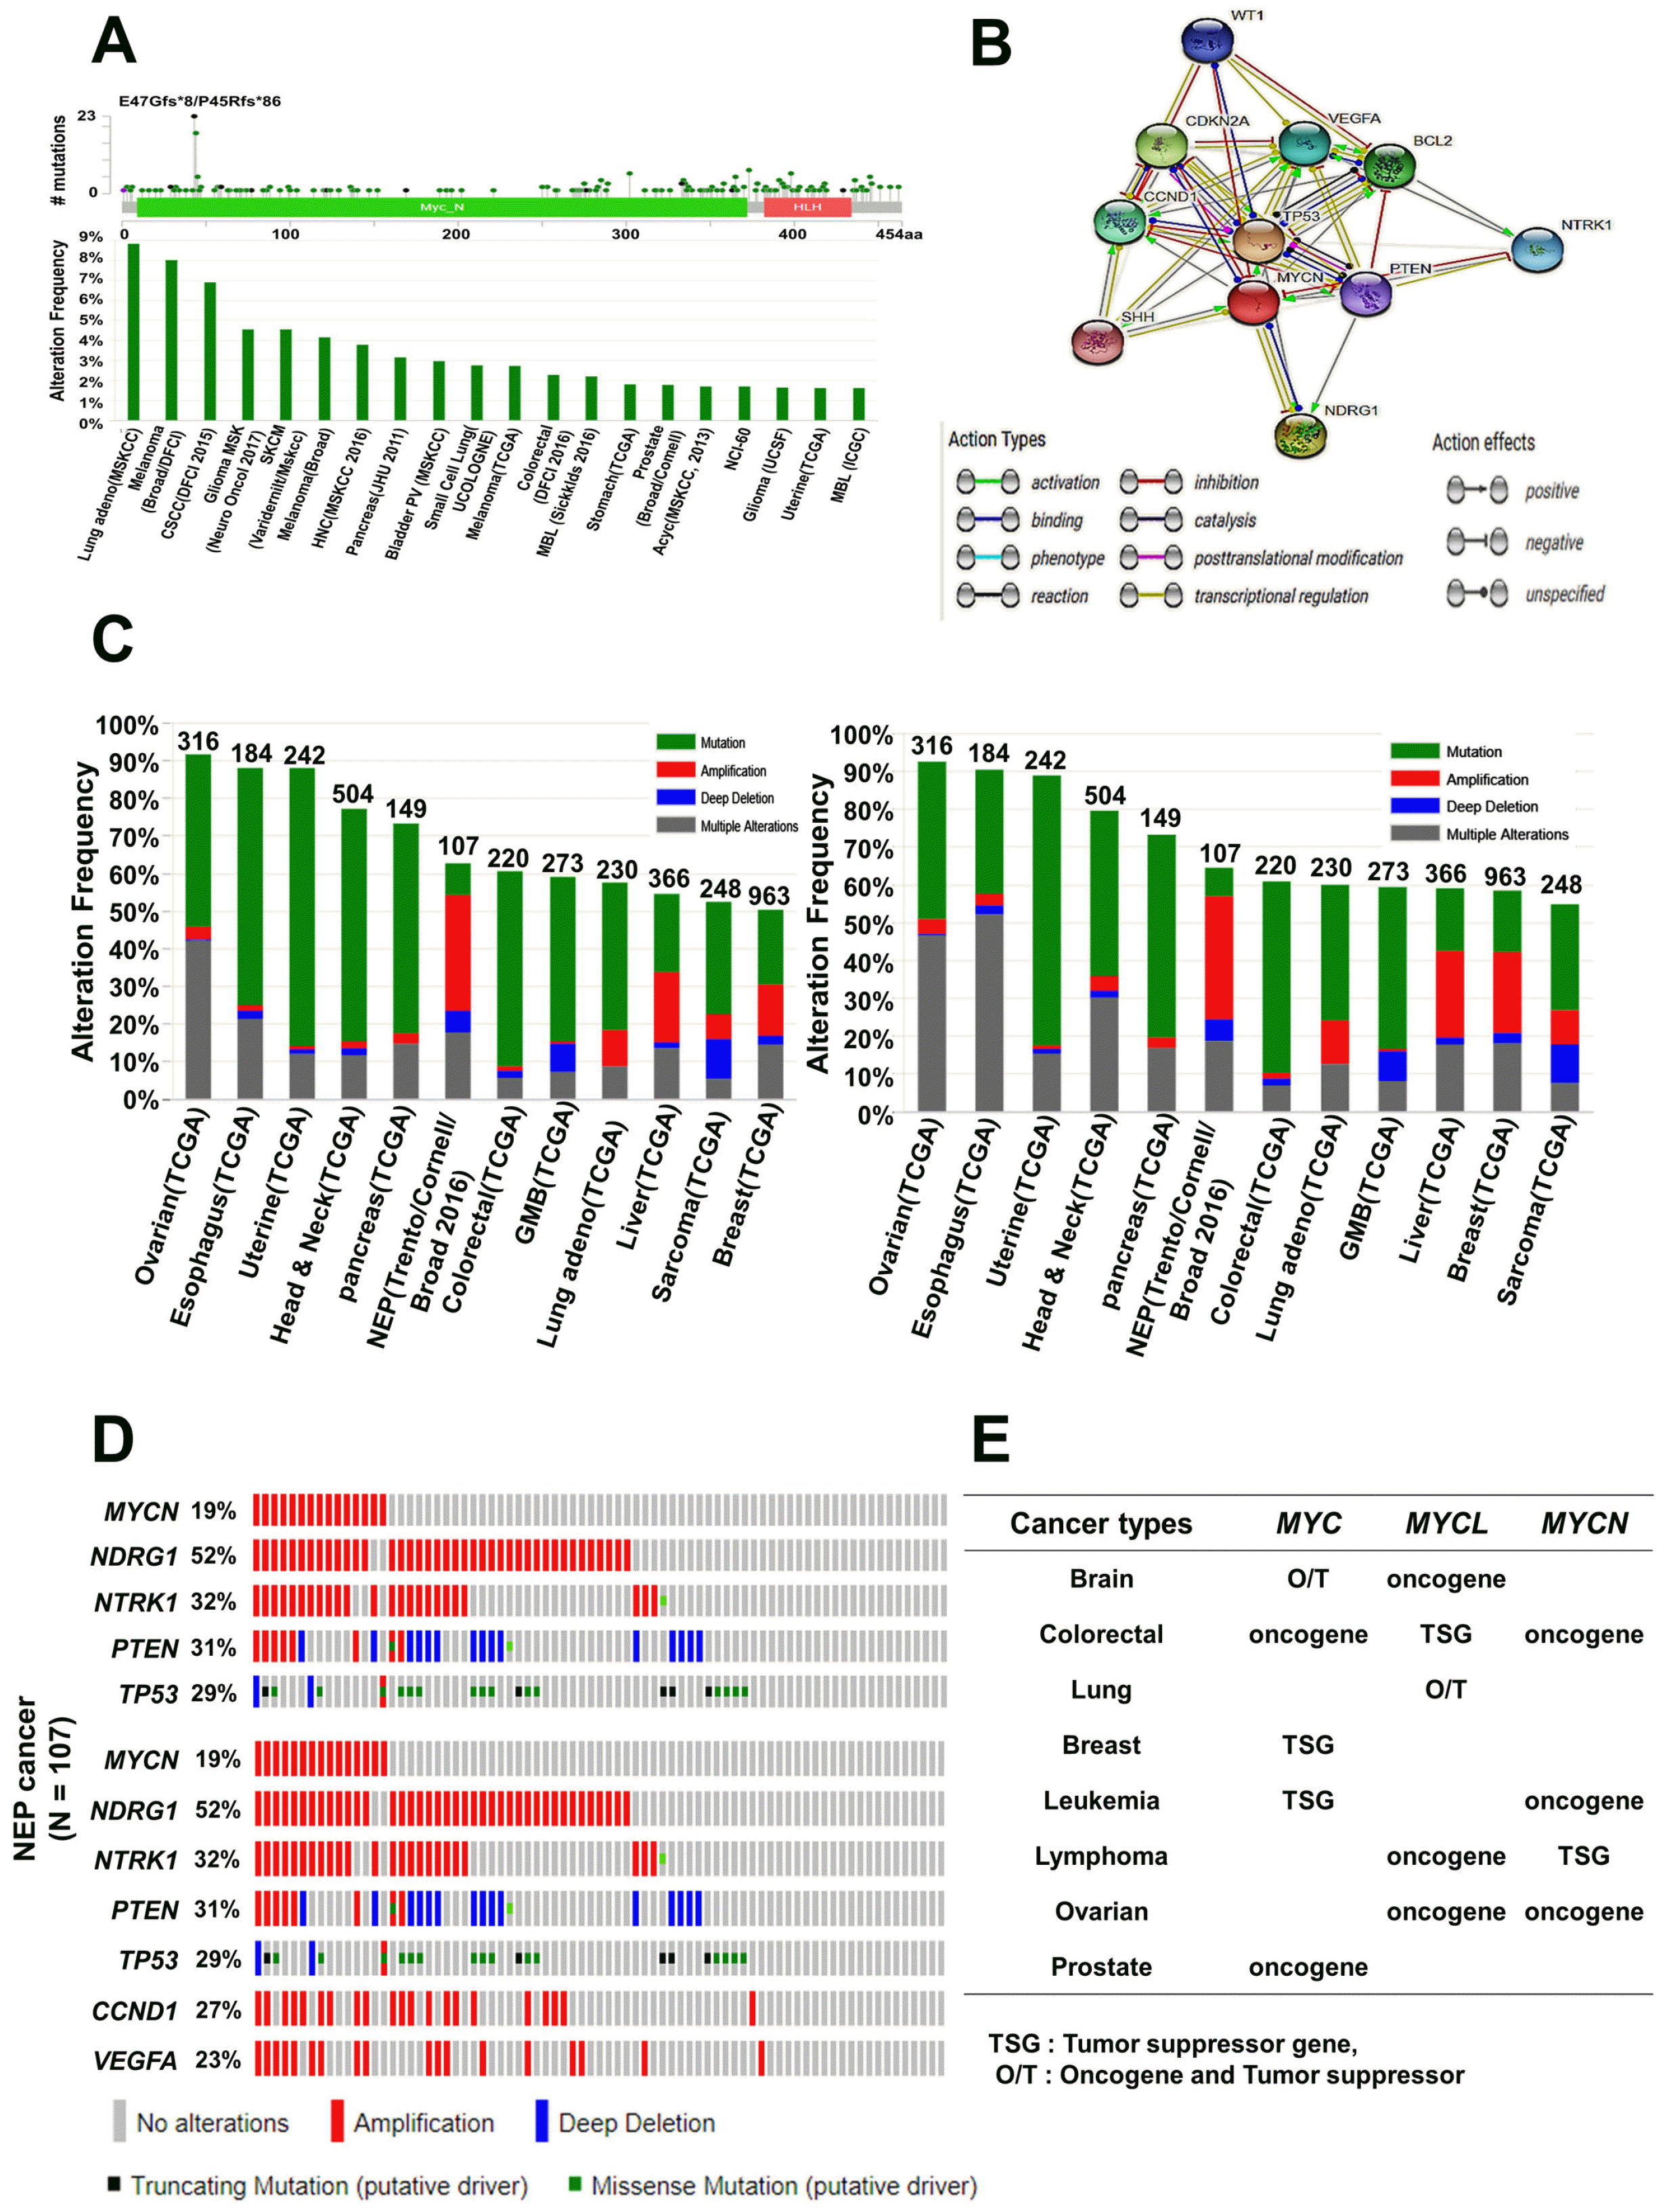
Fig. 7
MYCN mutation and alteration frequency analysis in various types of cancer. (A) Mutation diagram of MYCN in different types of cancer across protein domains. One hotspot (E47Gfs*8/P45Rfs*86) represented predominant mutations in the N-terminal domain of MYCN (upper panel). Alteration frequencies of MYCN mutation are shown in various types of cancer (lower panel). (B) Interacting nodes of MYCN protein with other related proteins are displayed, obtained using STRING v10.5. (C) The copy number alterations of MYCN-interacting genes in various cancer subtypes were determined using cBioPortal (http://www.cbioportal.org). The alteration frequencies of a five-gene signature (MYCN, NDRG1, NTRK1, PTEN, TP53) (left panel) and a seven-gene signature (MYCN, NDRG1, NTRK1, PTEN, TP53, CCND1, VEGFA) were determined in various cancer subtypes (right panel). Only the types of cancers containing >100 samples and an alteration frequency of >50% are shown. (D) NEP cancer tends to amplify MYCN frequently. We used the Oncoprint feature of cBioPortal (http://www.cbioportal.org) to determine the mutation and copy number alteration frequencies of each genes (NDRG1, NTRK1, PTEN, and TP53) in MYCN within the NEPC cancer subtype (upper panel); the percentages of alterations of each genes (MYCN, NDRG1, NTRK1, PTEN, TP53, CCND1, and VEGFA) is presented in NEPC cancer (lower panel). (E) The summary of predictive role of MYC family genes in different cancers is based on the consistent analyses of gene expression and clinical outcomes. NEP: neuroendocrine prostate, MYC: myelocytomatosis oncogene, O/T: oncogene and tumor suppressor, NDRG1: MYCN downstream regulated 1, NTRK1: neuro-trophic tyrosine kinase receptor type 1, PTEN: phosphatase and tensin homolog, TP53: tumor protein p53, CCND1: cyclin D1, VEGFA: vascular endothelial growth factor A, NEP: neuroendocrine prostate, STRING: search tool for recurring instances of neighboring genes.
![]()
MYC family genes co-occurrence and clinical outcomes
We systematically analyzed the clinical outcome of each MYC gene expressed simultaneously in five types of cancer, including breast, ovarian, gastric, lung, and liver cancer, using the Kaplan-Meier plotter database. We retrieved the clinical outcome data from the Kaplan-Meier plotter database and then carried out a multivariate survival analysis. In this multivariate survival analysis, the co-expression of MYC family genes was found to be significant (p<0.05) and correlated with patient survival in various cancers (Fig. 8). In lung cancer, the overall percentage of patient survival with MYChigh/MYCLhigh was poor, and MYClow/MYCNhigh and MYCLlow/MYCNlow showed a poor prognosis (Fig. 8A). In patients with gastric cancer, MYClow/MYCLlow showed the lowest survival rates, and MYClow/MYCNhigh and MYCLlow/MYCNhigh were correlated with poor prognosis (Fig. 8B), suggesting that partial co-expression of MYCN may be associated with poor prognosis in gastric cancer. However, the multivariate survival rate was significantly decreased with MYChigh/MYCLlow and MYChigh/MYCNlow and MYCLlow/MYCNhigh showed poor clinical outcomes in liver cancer (Fig. 8C). Moreover, we carried out a multivariate analysis for breast and ovarian cancer, however, the patient survival was not significant upon co-expression of MYC/MYCL, MYC/MYCN, and MYCL/MYCN (Supplementary Fig. S4a and b). These results suggest that co-expression of MYC/MYCL, MYC/MYCN, and MYCL/MYCN influence the propensity of tumors to change from malignant to benign or from benign to malignant, and affecting cancer prognosis.
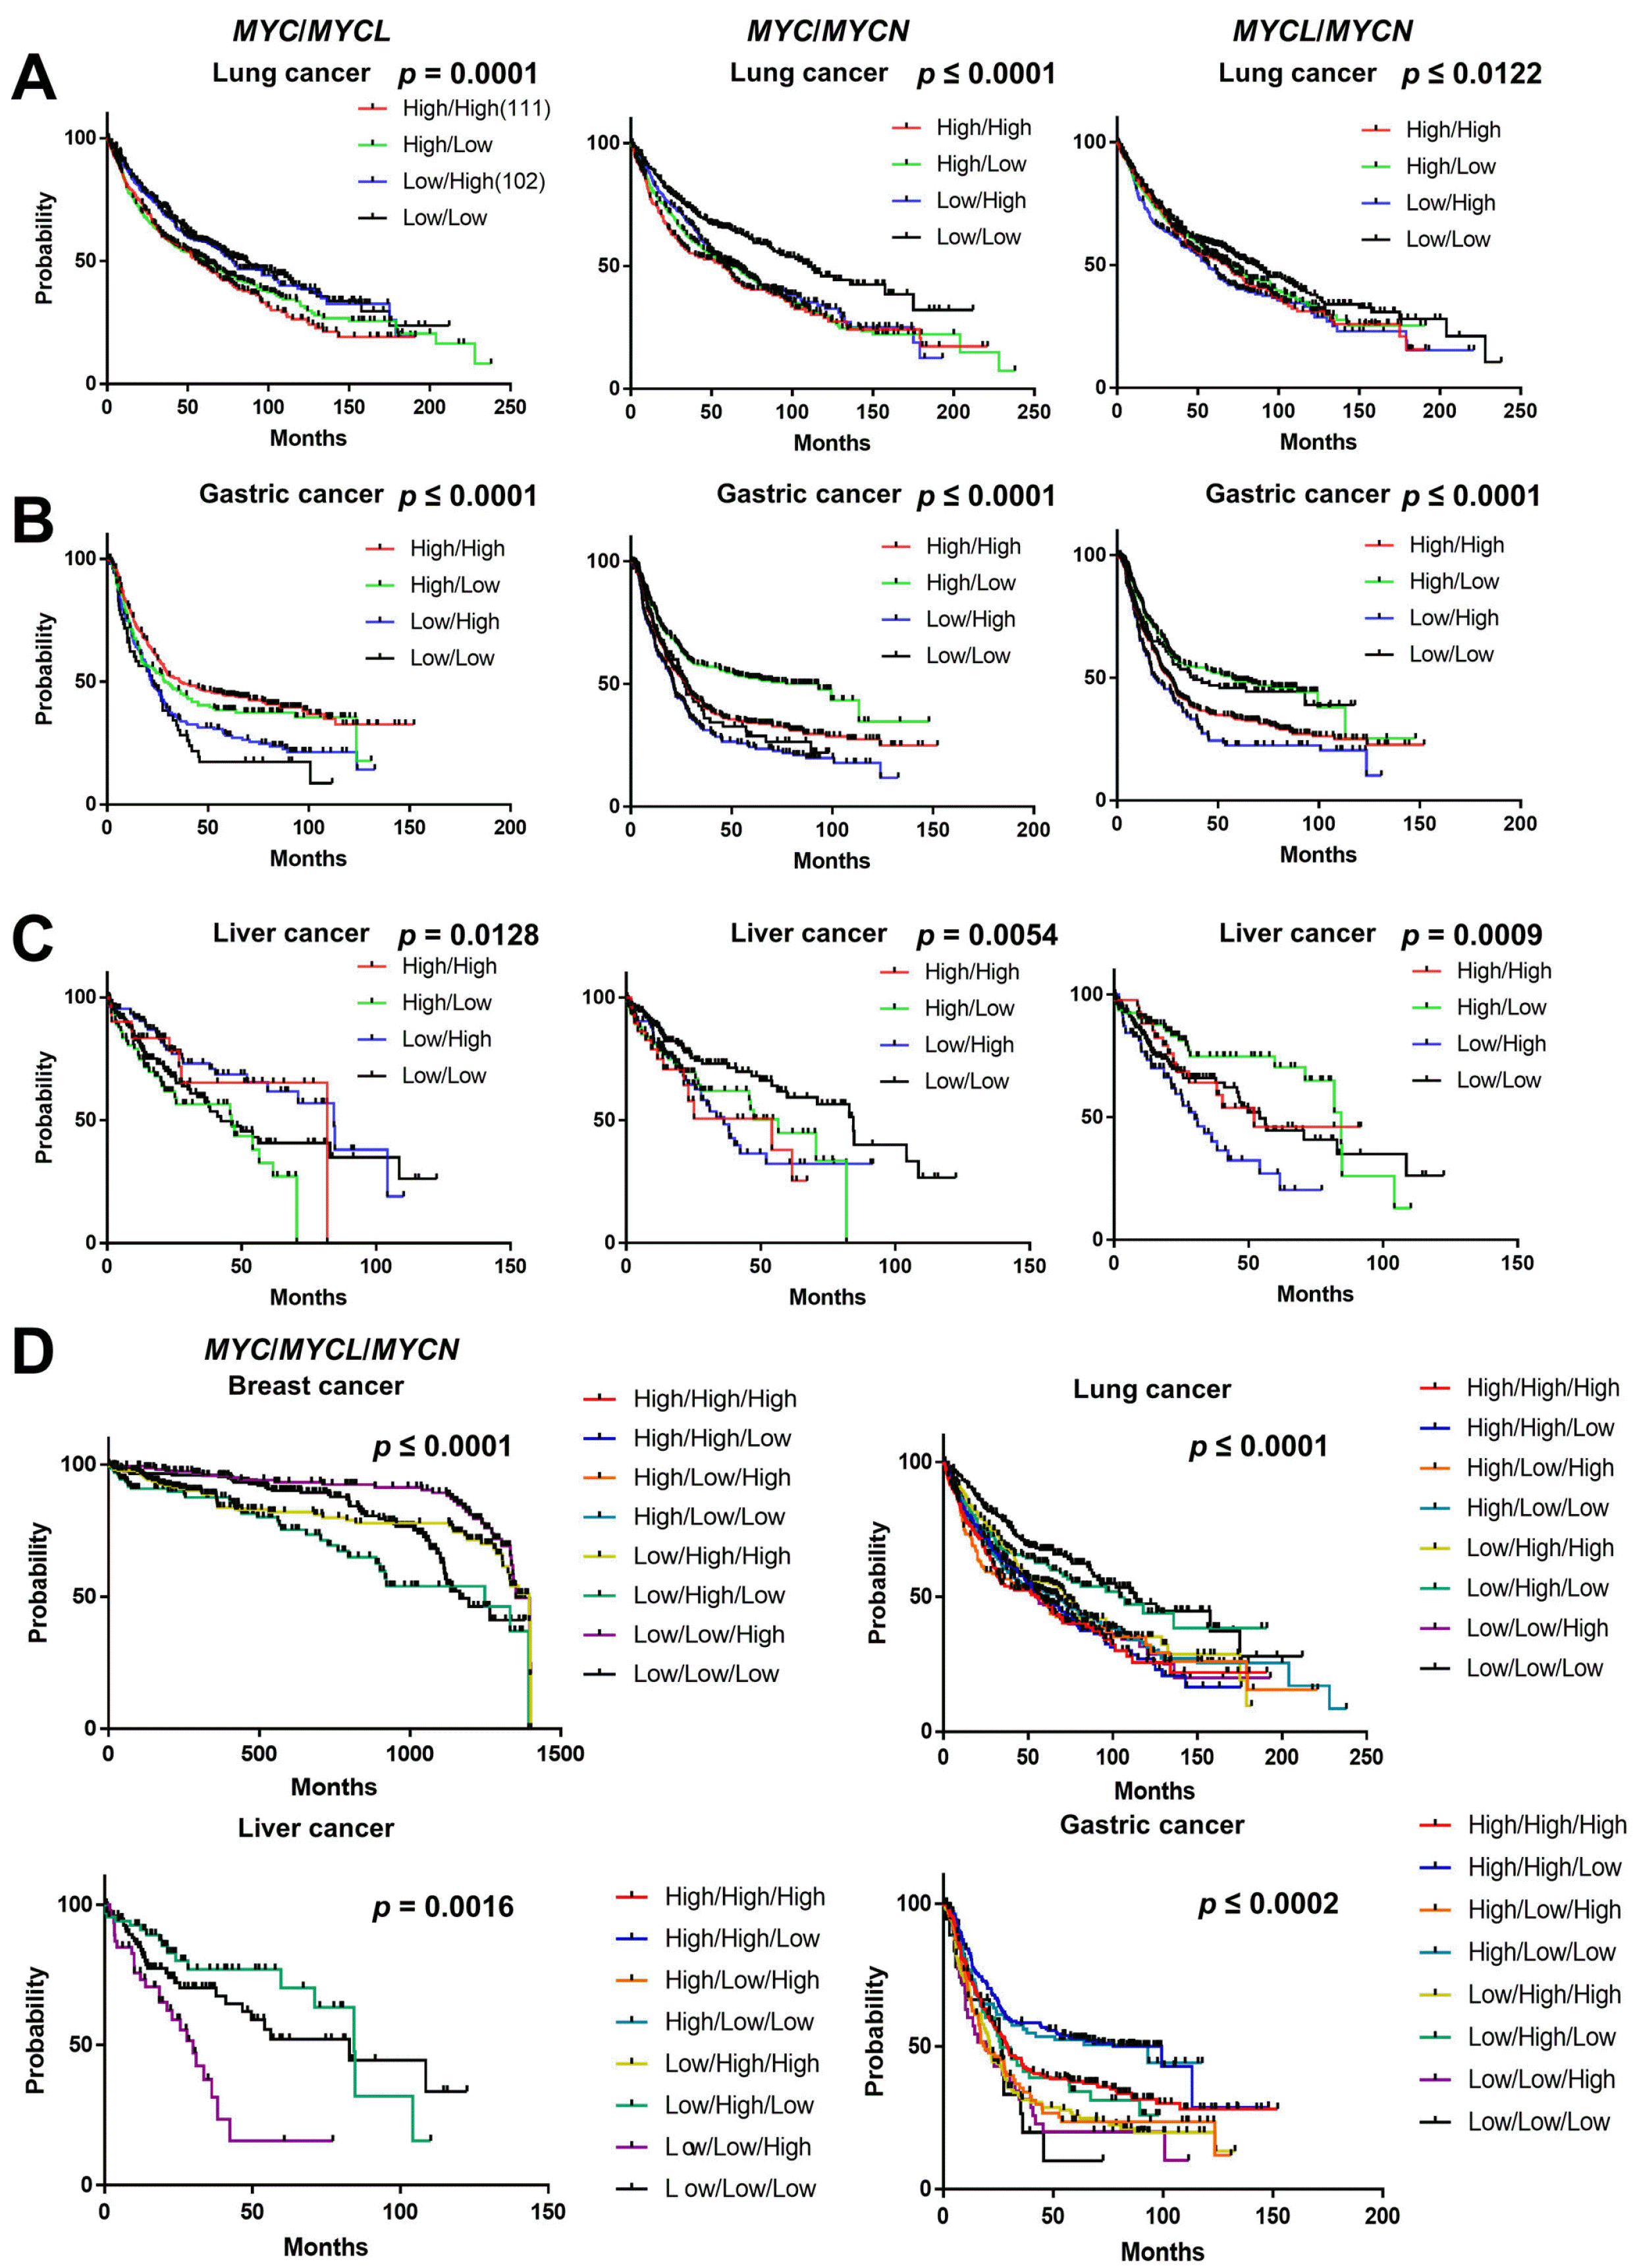
Fig. 8
The relationship between the co-occurrence of MYC family genes and the clinical outcomes in various types of cancer. Multivariate survival analysis of MYC/MYCL, MYC/MYCN, and MYCL/MYCN was performed using data from Kaplan-Meier Plotter in lung (A), gastric (B), and liver (C) cancer. Multivariate survival analysis of MYC/MYCL/MYCN was performed using data from Kaplan-Meier Plotter in breast, lung, gastric, and liver cancer (D). All the survival curves were obtained using GraphPad Prism 7. A p-value<0.05 was considered signi-ficant. MYC: myelocytomatosis on-cogene.
![]()
Next, we analyzed the relationship between the co-occurrence of MYC family genes (MYC/MYCL/MYCN) and their clinical outcomes. We found that patient survival was significantly (p<0.05) regulated by the co-expression of MYC family genes in various cancers (Fig. 8D and Supplementary Fig. S4c). The data on the clinical outcomes of breast, lung, liver, ovarian, and gastric cancer were retrieved from the Kaplan-Meier Plotter database. The multivariate survival analysis showed that the co-occurrence of MYC/MYCL/MYCN was significantly related to the clinical outcomes in breast, lung, liver, and gastric cancer (Fig. 8D). Interestingly, a poor prognosis was observed with a low expression of all three MYC family genes in gastric cancer, indicating the tumor suppressor role of MYC family genes, whereas co-expression of MYC family genes may function as an oncogene in liver cancer (Fig. 8D). However, a non-significant survival probability was observed in ovarian cancer (Supplementary Fig. S4c), suggesting that, depending on the type of cancer, the expression of different MYC genes can either promote or suppress the development of cancer.
Discussion
MYC has been found to be an oncogene by a number of previous studies (23, 24). However, some studies have demonstrated that MYC plays the role of a tumor-su-ppressor, and thus its role in cancer is under debate (25-27). In this systematic study, we compiled previously published genome-wide RNAseq data to detect alterations in the expression, copy numbers, mutations, and deletions of MYC family genes in various types of cancer and their associations with clinical cancer outcomes using several free-access web portals, including Oncomine, cBioPortal, and Prognoscan. Taken together, our systemic analysis provided a comprehensive view based on clinical data for the therapeutic targeting of MYC family genes.
Using the Oncomine database, we found that MYC family genes were differentially expressed in several types of cancer, including brain, breast, colorectal, leukemia, lymphoma, myeloma, and prostate cancer. Several studies also have demonstrated that MYC family genes are related to cancer progression and prognosis (13, 24, 28, 29). MYC promotes transcription by generating heterodimers with MAX and directly binding to DNA at E-box sequences. In contrast, transcription suppression depends initially on the repressive interaction of MYC/MAX with MIZ-1 at initiator elements of DNA. Moreover, a recent study demonstrated a distinctive mechanism of the MYC gene modulation in which MYC bound to retinoic acid receptor α (RARα) was recruited to the RAR DNA binding sequences. In leukemia cells, this MYC/RARα complex functioned either as an inhibitor or activator of RARα-dependent targets via a phosphorylation switch. Thus, un-phosphorylated MYC may interact with RARα to inhibit the expression of RAR targets, which is necessary for differentiation, thereby regulating leukemia malignancy (25). Moreover, MYCL and MYCN were reported to be differentially expressed in various cancers, including brain, breast, lung, and prostate cancer (13, 30-34). To further investigate the relationship between overall survival (OS) and MYC family gene expression, we performed an OS analysis of clinical patients’ data with high or low expression of MYC family genes using Prognoscan. Overall, a high expression of MYC was correlated with poor brain, colorectal, prostate, and kidney cancer prognosis, while a good prognosis was observed for breast and leukemia, which agrees with previously published studies (35-37). According to a previous report (38), among high-grade gliomas, histologically classic glioblastomas and anaplastic oligodendrogliomas follow markedly different clinical cou-rses because survival rates varied depending on the type of cancer. Similarly, we also found that various cohorts of brain cancer including meningioma, glioma, and lower-grade glioma have different prognoses associated with MYC expression (Fig. 2E). This means that the direction of treatment targeting the MYC is important depending on the type of brain cancer. The expression of MYCL and MYCN was also reported to be associated with clinical outcomes in various cancer patients (30, 39-41), supporting our systematic analysis.
There are somatically four majors acquired factors involved in cancer cells, including genetic, epigenetic, transcriptomic, and proteomic alterations (41-43). Thus, we employed cBioPortal to investigate important mutations and copy number alterations in the selected MYC gene family signature in various cancers. The MYC, MYCL, and MYCN mutations predominantly arose at the MYC_N domain in various cancers with the ranges (lowest to highest) of alteration frequencies of MYC family interacting genes were 53∼92% for MYC, 50∼97% for MYCL, and 55∼94% for MYCN. Interest has grown for prostate, ovarian, and NEP cancers due to the predominance of ampli-fication. Especially, highest amplification frequencies of MYC and MYCN including interacting genes were found in prostate and NEP cancer, respectively (Fig. 3D and 7D). The alteration of copy numbers and mutations in MYC family genes could play a potential role in the regulation of cancer progression and prognosis.
cBioPortal was also used to perform interactive analysis and elucidate the altered networks of MYC family proteins. Our systematic analysis showed that MYC family genes could be co-expressed with other potential genes which may participate in crucial cellular signaling pathways. The STRING v10.5 analysis demonstrated that MYC could interact with MYB and with TP53, BCL2, JUN, CDK4, CDKN1A, and CDKN2A. Moreover, MYCL and MYCN were found to interact with six proteins, including TP53, RLF, PPLE, COL9A2, IER5, and GLI4 (for MYCL) and NDRG1, NTRK1, PTEN, TP53, CCND1, and VEGFA (for MYCN). Most of the proteins interacting with MYC were found to be cancer-regulating proteins. Importantly, MYC family genes are known to interact with TP53, thereby contributing to a variety of signaling pathways in cancer in humans. The somatic mutations of TP53 also frequently occur in most cancers (44). Moreover, TP53 plays an anti-proliferative role during various stresses and physical processes, including aging, and targets the early inactivation of cancer (45). Thus, MYC family genes may play a role as a tumor suppressor or oncogene by regulating mutations in the p53 protein.
Like other functional genes, the MYC family genes coordinate cellular pathways in cooperation with other sub-generic genes. Therefore, to predict the clinical anti-cancer effects of targeting MYC, several sub-signaling pathways related to MYC should be considered. For these, we identified the co-expressed genes in the TCGA database using the cBioPortal web. The retrieved genes were analyzed using DAVID functional annotation to determine the underlying signaling mechanism for the MYC family in cancer development (Supplementary Fig. S1∼S3). In addition to MYC, TP53 was found to contribute to cancer development by regulating the cell cycle and apoptosis through the TP53 signaling pathway, as reported in a previous study (46). We determined the major biological functions of MYCL, which was found to contribute predominantly to endocytosis in melanoma progression. MYCL was also correlated with the TP53 signaling pathway, which may partially explain its role in cancer regulation (47). Similarly, a previous study reported that NDRG1 was correlated with PTEN in endometrial carcinoma (48); this correlation may be regulated by MYCN expression.
Our systematic analysis not only confirmed the relationship between MYC expression and their sub-signaling pathways, but also the effect between co-occurrence of MYC, MYCL, and MYCN expression on the survival rates of cancer patients. These effects varied depending on the type of cancer. Recent studies have shown that overexpre-ssion of MYC in cells in vitro can inhibit cell motility, invasiveness, and metastasis and acts as a tumor suppressor (49). In the case of MYC, the expression of MYC in vivo suppresses the invasion and migration of the tumor and regulates prognosis, resulting in an increase in cell migration when the expression of MYC is lost. This is because MYC prevents JNK-dependent cell invasion and migration in human, drosophila, and lung adenocarcinoma cell lines (50), suggesting that the expression of MYC family genes can regulate the clinical outcomes of various cancers. Moreover, our multivariate survival analysis revealed that co-expression of MYC family genes may regulate clinical outcomes in various cancers. Taken together, previous reports and our systematic analysis suggest that therapeutic strategies for the targeting of cancer development could be developed to regulate MYC family genes. Our study has enhanced our understanding of the correlation between MYC family gene expression and cancer prognosis, indicating the potential of MYC as a potential target for therapeutic strategies.
 XML Download