Journal List > Int J Stem Cells > v.16(2) > 1516082826

Shang, Feng, and Xia: The Suppression Effects of Fat Mass and Obesity Associated Gene on the Hair Follicle-Derived Neural Crest Stem Cells Differentiating into Melanocyte by N6-Methyladenosine Modifying Microphthalmia-Associated Transcription Factor

Abstract

Background and Objectives

Melanocyte (MC), derived from neural crest stem cell (NCSC), are involved in the production of melanin. The mechanism by which NCSC differentiates to MC remains unclear. N6-methyladenosine (m6A) modification was applied to discuss the potential mechanism.

Methods and Results

NCSCs were isolated from hair follicles of rats, and were obtained for differentiation. Cell viability, tyrosinase secretion and activity, and transcription factors were combined to evaluated the MC differentiation. RT-qPCR was applied to determine mRNA levels, and western blot were used for protein expression detection. Total m6A level was measured using methylated RNA immunoprecipitation (MeRIP) assay, and RNA immunoprecipitation was used to access the protein binding relationship. In current work, NCSCs were successfully differentiated into MCs. Fat mass and obesity associated gene (FTO) was aberrant downregulated in MCs, and elevated FTO suppressed the differentiation progress of NCSCs into MCs. Furthermore, microphthalmia-associated transcription factor (Mitf), a key gene involved in MC synthesis, was enriched by FTO in a m6A modification manner and degraded by FTO. Meanwhile, the suppression functions of FTO in the differentiation of NCSCs into MCs were reversed by elevated Mitf.

Conclusions

In short, FTO suppressed the differentiating ability of hair follicle-derived NCSCs into MCs by m6A modifying Mitf.

Introduction

Melanocyte (MC) is a specific class of melanin-producing cells, which play a decisive role in the presentation of vertebrate skin, hair, eyes and other pigments (1, 2). In pigmented diseases such as vitiligo and chloasma, it is important to study the developmental and regulatory mechanism of MCs (3). Current studies suggest that vertebrate MCs originate from the neural crest of the ectoderm (4). These neural crest stem cells (NCSCs) can differentiate into broad lineages such as peripheral neurons, endocrine cells, bone, cartilage, connective tissue, and MCs (5). However, the mechanism by which NCSC specifically differentiated into the melanocytic lineage remains unclear.
The synthesis of MC in animals is regulated by a large number of transcription factors and the process is complex. As a key transcription factor in MCs, microphthalmia-as-sociated transcription factor (Mitf) can be induced by MC-stimulating hormone. Activation of Mitf gene in MCs plays a key role in melanin synthesis (4, 6, 7). In addition, Mitf can effectively intervene the expression and regulation of tyrosinase gene family in MC synthesis, which plays an important role in the formation of MCs and affects the survival, migration, proliferation and differentiation of MCs (8-10). Therefore, it is urgent to study the regulatory role of Mitf in the study of melanin production.
Methylation of the 6th nitrogen atom position on RNA adenine (i.e., m6A) is the most abundant chemical modifi-cation on eukaryotic mRNA. Unlike epigenetic modifications of DNA and histones that operate primarily at the transcriptional level, RNA methylation regulates gene expression primarily at the post-transcriptional level (11). m6A modifi-cation regulates various differentiation abilities of stem cells. For instance, N6-Adenosine-Methyltransferase Subunit (ME TTL) 14 contributed to leukemogenesis by suppressing hematopoietic stem differentiation (12). Reduction of total m6A mRNA levels in mouse embryonic stem cells triggers their differentiation (13). METTL3 promoted the differentiation of adipose stem cells into vascular smooth muscle cells by increasing the overall m6A modification levels (14). However, m6A modification in NCSC differentiation is rarely reported. The purpose of this study was to investigate the role of m6A modification and Mitf in the differentiation of NCSCs into MCs.

Materials and Methods

Isolation of NCSC

Male SD rats (100∼150 g) were provided by the Experi-mental Animal Center of The First Affiliated Hospital, and College of Clinical Medicine of Henan University of Scie-nce and Technology). After the rats were sacrificed, the tentacle pads were taken, and the complete hair follicles (covered with connective tissue sheath) were dissected out. The outer root sheath of the hair follicle was removed, and the carina intact was left (15). It was attached to a 35 mm petri dish coated with rat tail glue in advance, and after 30 min, the culture medium DMEM/F12 (1:1 ratio, Invi-trogen) with 2% B27 (Invitrogen), 20 ng/ml EGF (Pepro-Tech), and 40 ng/ml bFGF (PeproTech) was added to culture at 37℃ and 5% O2. After 6 days, the hair follicles were removed and subcultured by 0.25% trypsin digestion (Invitrogen). This study was approved by the Experimen-tal Animal Center of The First Affiliated Hospital, and College of Clinical Medicine of Henan University of Science and Technology.

Differentiation of NCSC

The adherent NCSCs were collected and digested into a single cell suspension, and then were inoculated on cove-rslips. NCSCs were cultured in different differentiation-in-ducing agents for 2∼3 weeks (16): 1. melanogenic differentiation medium containing M254 (Invitrogen), 1% HMGS (Invitrogen), 100 nm ET-3 (Sigma), 100 ng/ml SCF (Pepro-Tech); 2. smooth muscle differentiation medium containing DMEM (Invitrogen), 20% FBS (Invitrogen), 100 ng/ml TGF-/β (PeproTech); 3. neural differentiation medium containing DMEM/F-12 and FBS.

RT-qPCR

Total RNA was extracted by the TRIZOL Reagent according to the manufacturer’s instruction (Invitrogen), and the RNA concentration was measured by NanoDrop. Then the corresponding DEPC water, dNTP, randomprimer were added with sample RNA for reverse transcription according to the instructions of Invitrogen SuperScriptTM Reverse Transcriptase Kit. Next, cDNA sample was aspirated and mixed with Green Master Mix (Promega) qRT-PCR amp-lification. The reaction conditions is: (94℃/30 seconds→55℃/30 seconds→72℃/1 minute)×30∼35 cycles→72℃/5 minutes. The PCR product was added to 1.5% agarose gel, electrophoresed at 100 V for 30 min, and observed under UV light. The data was analyzed using 2-ΔΔCt relative expression method. Thrice experiments were repeated. The primer sequence are of PCR is shown in Table 1.

Analysis of stem cell markers

Nestin, p75, Sox10, Snail-1, Twist-1, Myo10, Msx2, Klf4 and Wnt1 were amplified using ExTaq DNA polymerase (Takara). The PCR products were visualized on 2% agarose gels and ethidium bromide staining (17).

Immunofluorescent staining

Differentiated NCSCs were firstly fixed with 4% paraformaldehyde for 15 min, and washed 3 times with PBS. 2% TritonX-100 solution was added for permeabilization, and 2% BSA solution was added and blocked for 2 h. Primary antibodies bought from abcam (1:2000 anti-β-Tubulin III; 0.034 μg/ml anti-SMA; 1:100 anti-tyrosina-se) were added at 4℃ overnight. Secondary antibody was added, and incubated at room temperature in the dark for 2 h. Finally, 10 μg/ml DAPI solution was added for 2 min, and then fluorescent mounting medium was added, stained cells were observed under a fluorescent microscope (NI-KON TE 2000).

Western blot analysis

Total protein was extracted with RIPA buffer (Beyo-time) and quantified by the BCA protein detection kit (Thermo Fisher) in accordance with the manufacturer’s instruction. Protein was electrophoresed on 10% SDS-PAGE and therewith transferred to PVDF membranes (Millipore). Afterwards, membranes were sealed with 5% nonfat milk for 1 h and treated with the specific primary antibodies for tyrosinase (1:1000, abcam, MA, USA), Mitf (1:200, abcam), FTO (1:1000, abcam) and GAPDH (1:2000, abcam) at 4℃ overnight. Following conjugation to HRP-labeled secondary antibody, the bands were visualized by ECL reagent (Thermo Fisher).

CCK-8

CCK-8 assay was used to detect the proliferation ability of cells. The specific operation was carried out in strict accordance with the kit instructions (AmyJet Technology). The absorbance of each well sample was measured at 450 nm (BioTek) with the absorbance as ordinate and time as abscissa to draw the growth curve.

Cell transfection

Cells were divided into the following 8 groups: 1. NCSCs with no treatment; 2. NCs with no treatment; 3. NCSCs transfected with elevated FTO plasmids (NCSC+FTO); 4. NCSCs transfected with empty vector of elevated FTO (NCSC+vector); 5. MCs transfected with elevated FTO plasmids (MC+FTO); 6. MCs transfected with empty vector of elevated FTO (MC+vector); 7. MCs transfected with elevated FTO and lv-nc plasmids (MC+FTO+lv-nc); 8. MCs transfected with elevated FTO and lv-Mitf plasmids (MC+FTO+lv-Mitf). Transfection performance was carried out under the guidance of Lipofectamine 2000 (Invi-trogen) (18). After transfection, RT-qPCR and western blot were used to test the transfection efficiency of each group of cells.

Tyrosinase activity evaluation

MCs were lyzed and centrifuged to obtain a supernatant as source of tyrosinase. The dopa rate oxidation method was used for the determination (19). Phosphate buffer, 10 mmol/L L-dopa and the solution to be tested were added to the 96-well plate in turn, and 100 U/ml tyrosinase was added in a water bath for 10 min. Afterwards, the absorbance value was measured at 475 nm by a microplate reader.

RNA immunoprecipitation (RIP) experiment

MCs were lysed in RIP lysis buffer and immunopre-cipitated by magnetic beads (Millipore) conjugated to FTO antibody or IgG in RIP buffer at 4℃ for 6 h based on the Magna RIP RNA-Binding Protein Immunopreci-pitation Kit (Millipore). After elution and proteinase K digestion, bound RNAs were subjected to RT-qPCR analysis.

Methylated RNA immunoprecipitation (MeRIP)

MCs with elevated FTO were subjected to MeRIP assay using Magna MeRIPTM m6A Kit (Millipore) under the guidance of manufacturer’s instructions. In short, 200 μg isolated RNA was fragmented into 100 nucleotides, followed by the immunoprecipitation with 10 μg m6A antibody (Millipore) or anti-mouse IgG which was linked to Magna ChIP Protein A/G Magnetic Beads (20). The m6A precipitated RNA was eluted with 6.7 mM N6-methyla-denosine 5’-monophosphate sodium salt. And modification of m6A towards particular genes was determined by RT-qPCR analysis.

Dual luciferase reporter gene experiment

Cells were co-transfected with plasmids containing 3’-UTR of wild or mutant fragments from Mitf and overexpressed FTO vector using Lipofectamine 2000 according to the manufacturer’s protocol. At 24 h after transfection, firefly and renilla luciferase activities were measured consecutively by using dualluciferase reporter assay system (Promega). Finally, ratios of luminescence from firefly to renilla luciferase were calculated.

mRNA stability assay

MCs were administered with 2 μg/ml actinomycin D (Si-gma) and cultured at 37℃ to block transcription for 0, 1, 2, 3, 4, and 5 h (21). Mitf was determined by RT-qPCR analysis at every point in time.

Statistical analysis

SPSS 25.0 was used to analyse the statistical data. The data was shown as the mean±SD. Student’s t-test and analysis of variance (ANOVA) were used to assess the statisti-cal significance of differences between two and multiple groups, respectively. p<0.05 was regarded to be statistically significant. All experiments were repeated at least three times.

Results

Neural crest origin and pluripotency of differentiation of NCSCs

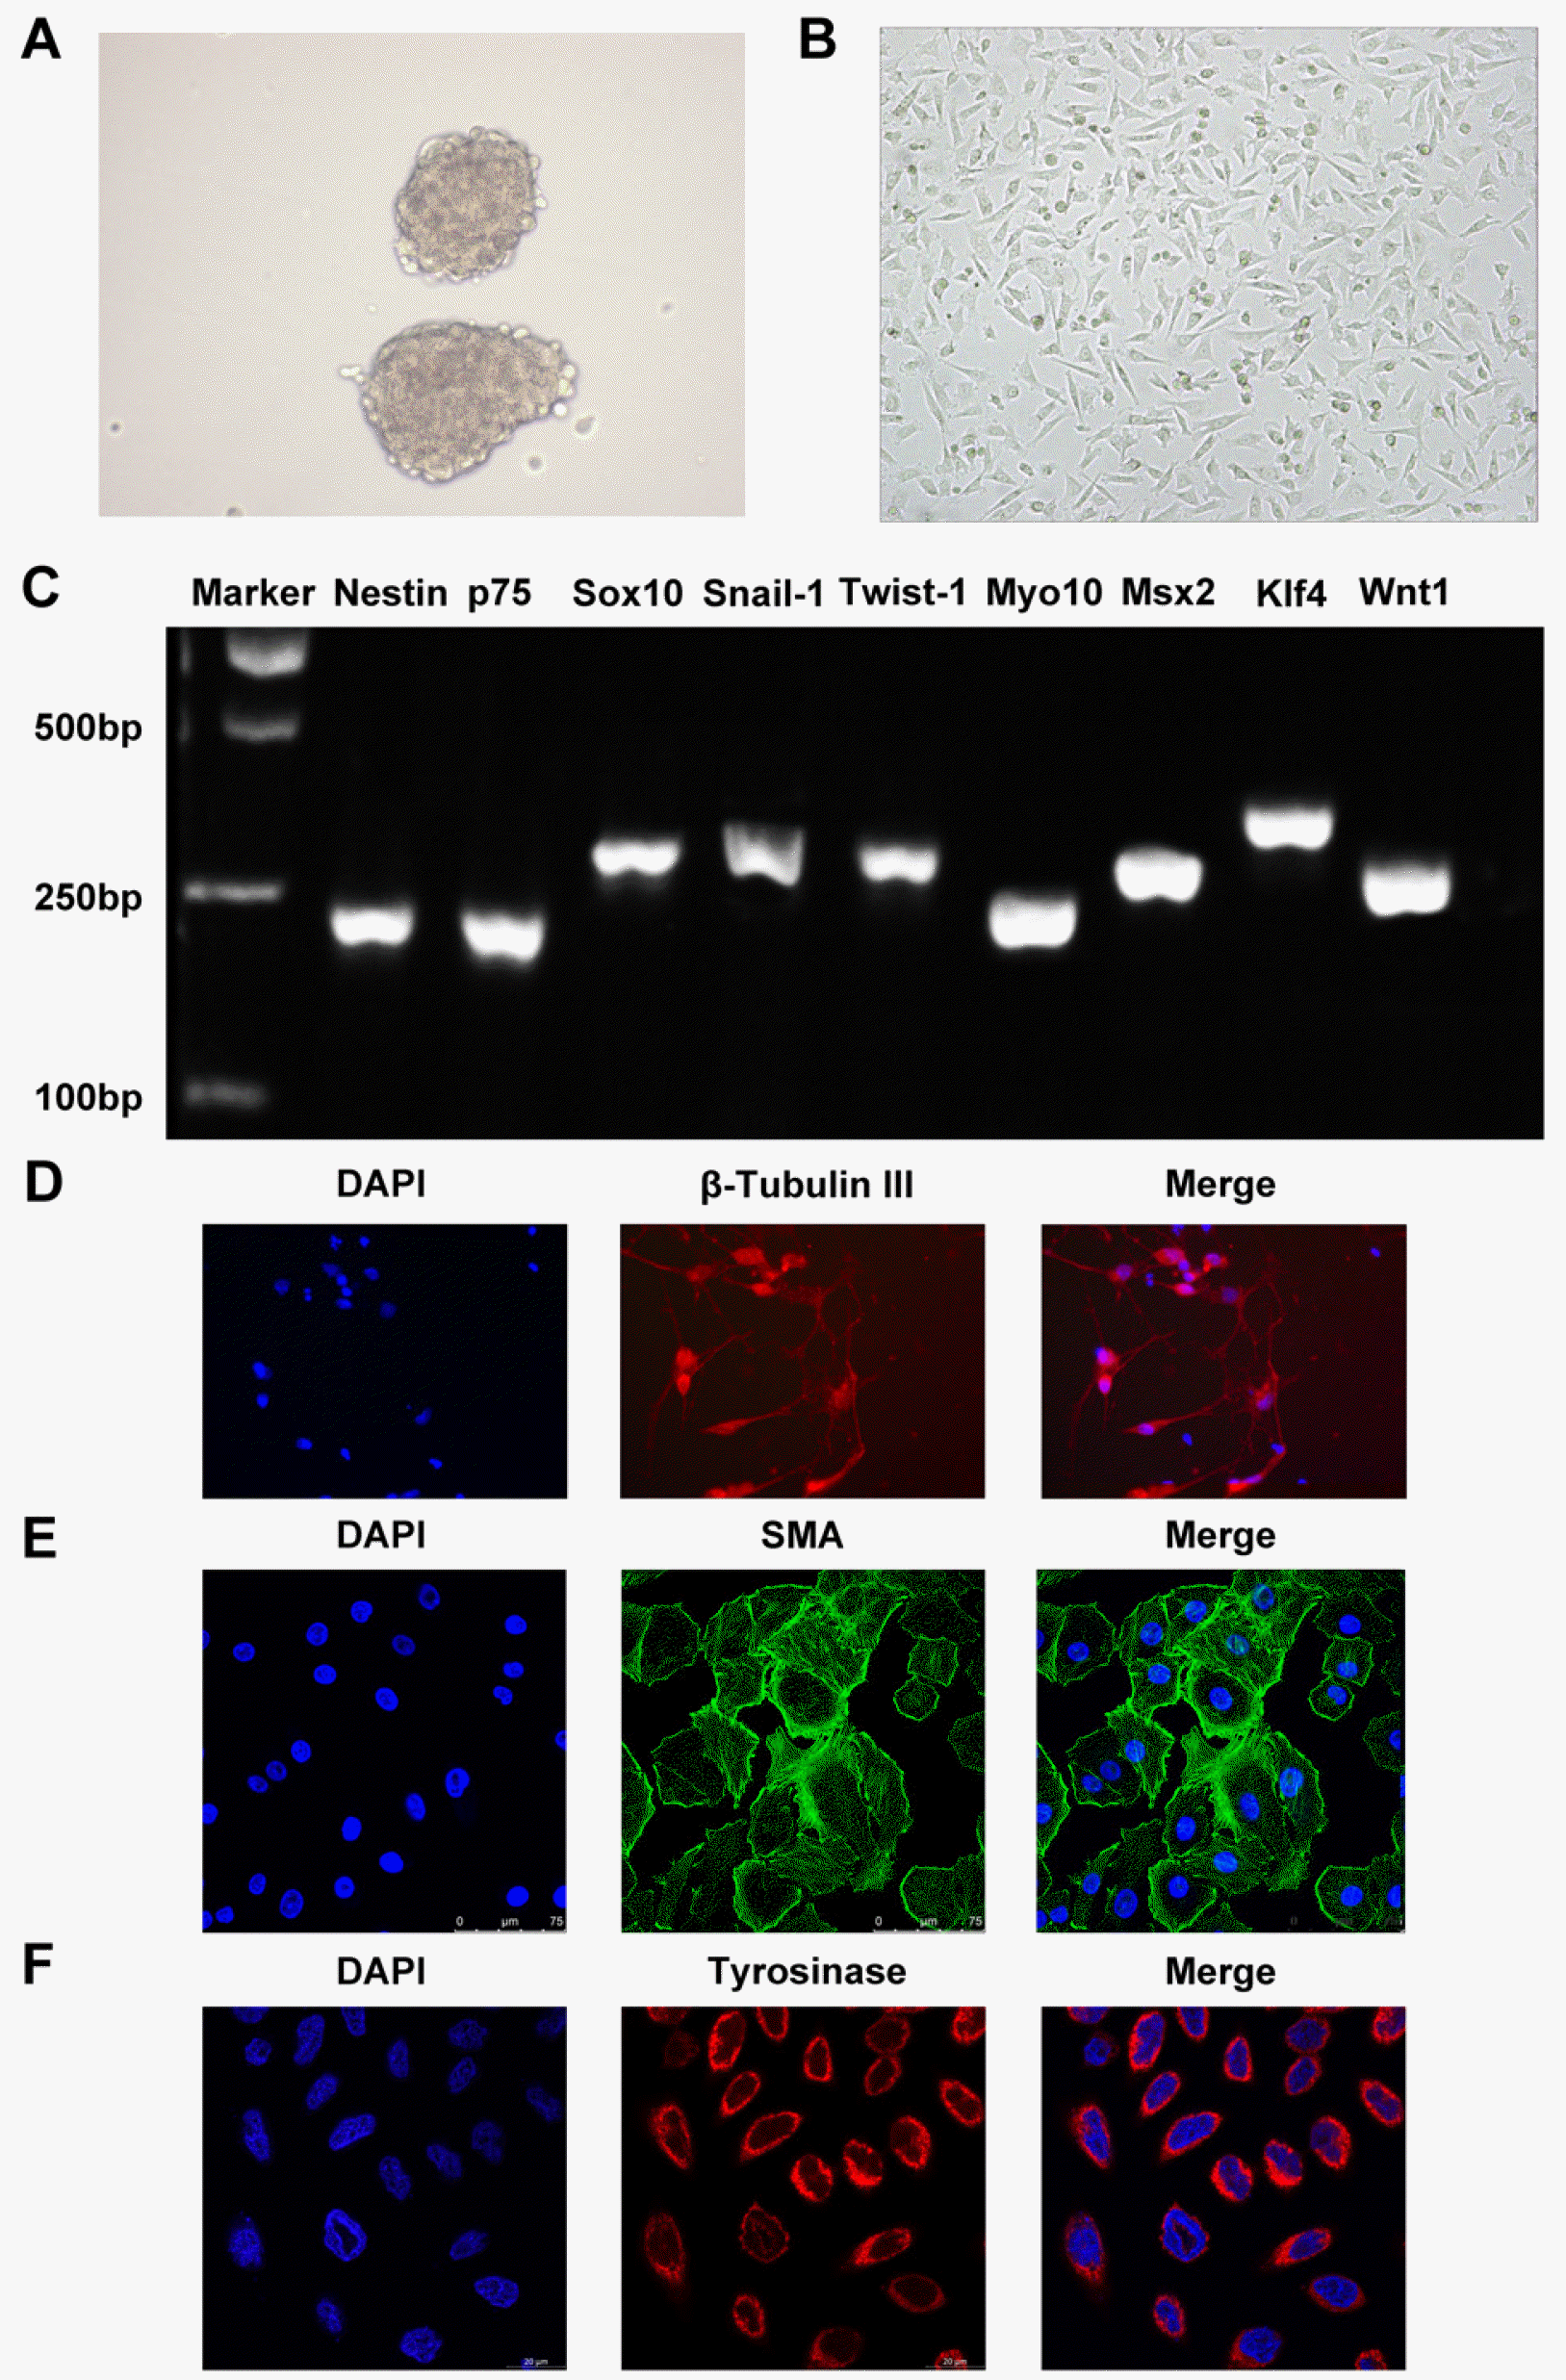
NCSCs isolated from the hair follicle bulge of rat tentacles grew clonally in a suspended state (Fig. 1A) or an adherent state (Fig. 1B) when cultured. Meanwhile, this isolated NCSCs expressed Nestin, NCSCs-specific markers such as p75, Sox10, Snail-1, Twist-1, stem cell markers containing MyO10, Msx2, and some general stem cell markers including Klf4 and Wnt1 (Fig. 1C). Meanwhile, these markers were detected in fibroblast as a negative control, and the results demonstrated that NCSCs-specific markers were not expressed in fibroblast (Supplementary Fig. S1A). Furthermore, NCSC surface marker proteins including p75 and HNK1 were also found to expressed in isolated NCSCs through flow cytometry analysis (Supplementary Fig. S1B). In addition, under the induction of various specific culture media, NCSCs can be directed to differentiate into neurons (Fig. 1D), smooth muscle cells (Fig. 1E) and MCs (Fig. 1F) and correspondingly express specific markers β-Tubulin III, SMA and tyrosinase.

Culture and identification of MCs derived from NCSCs

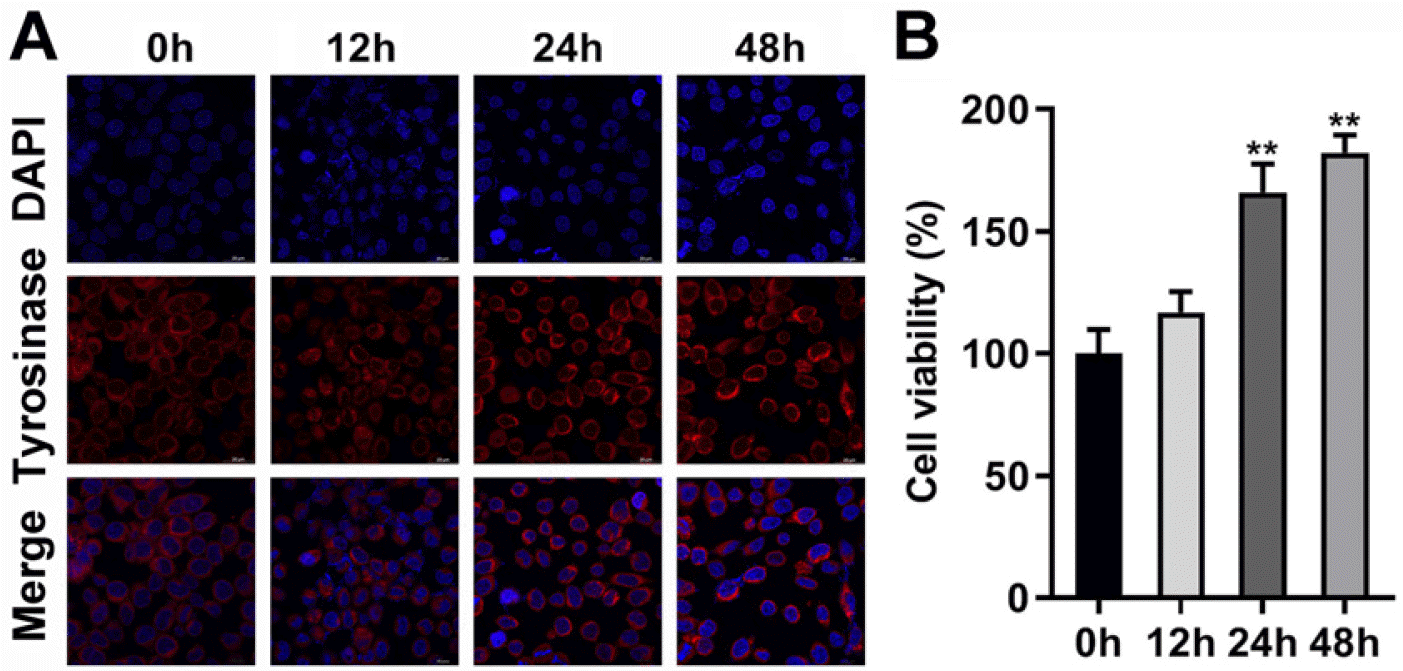
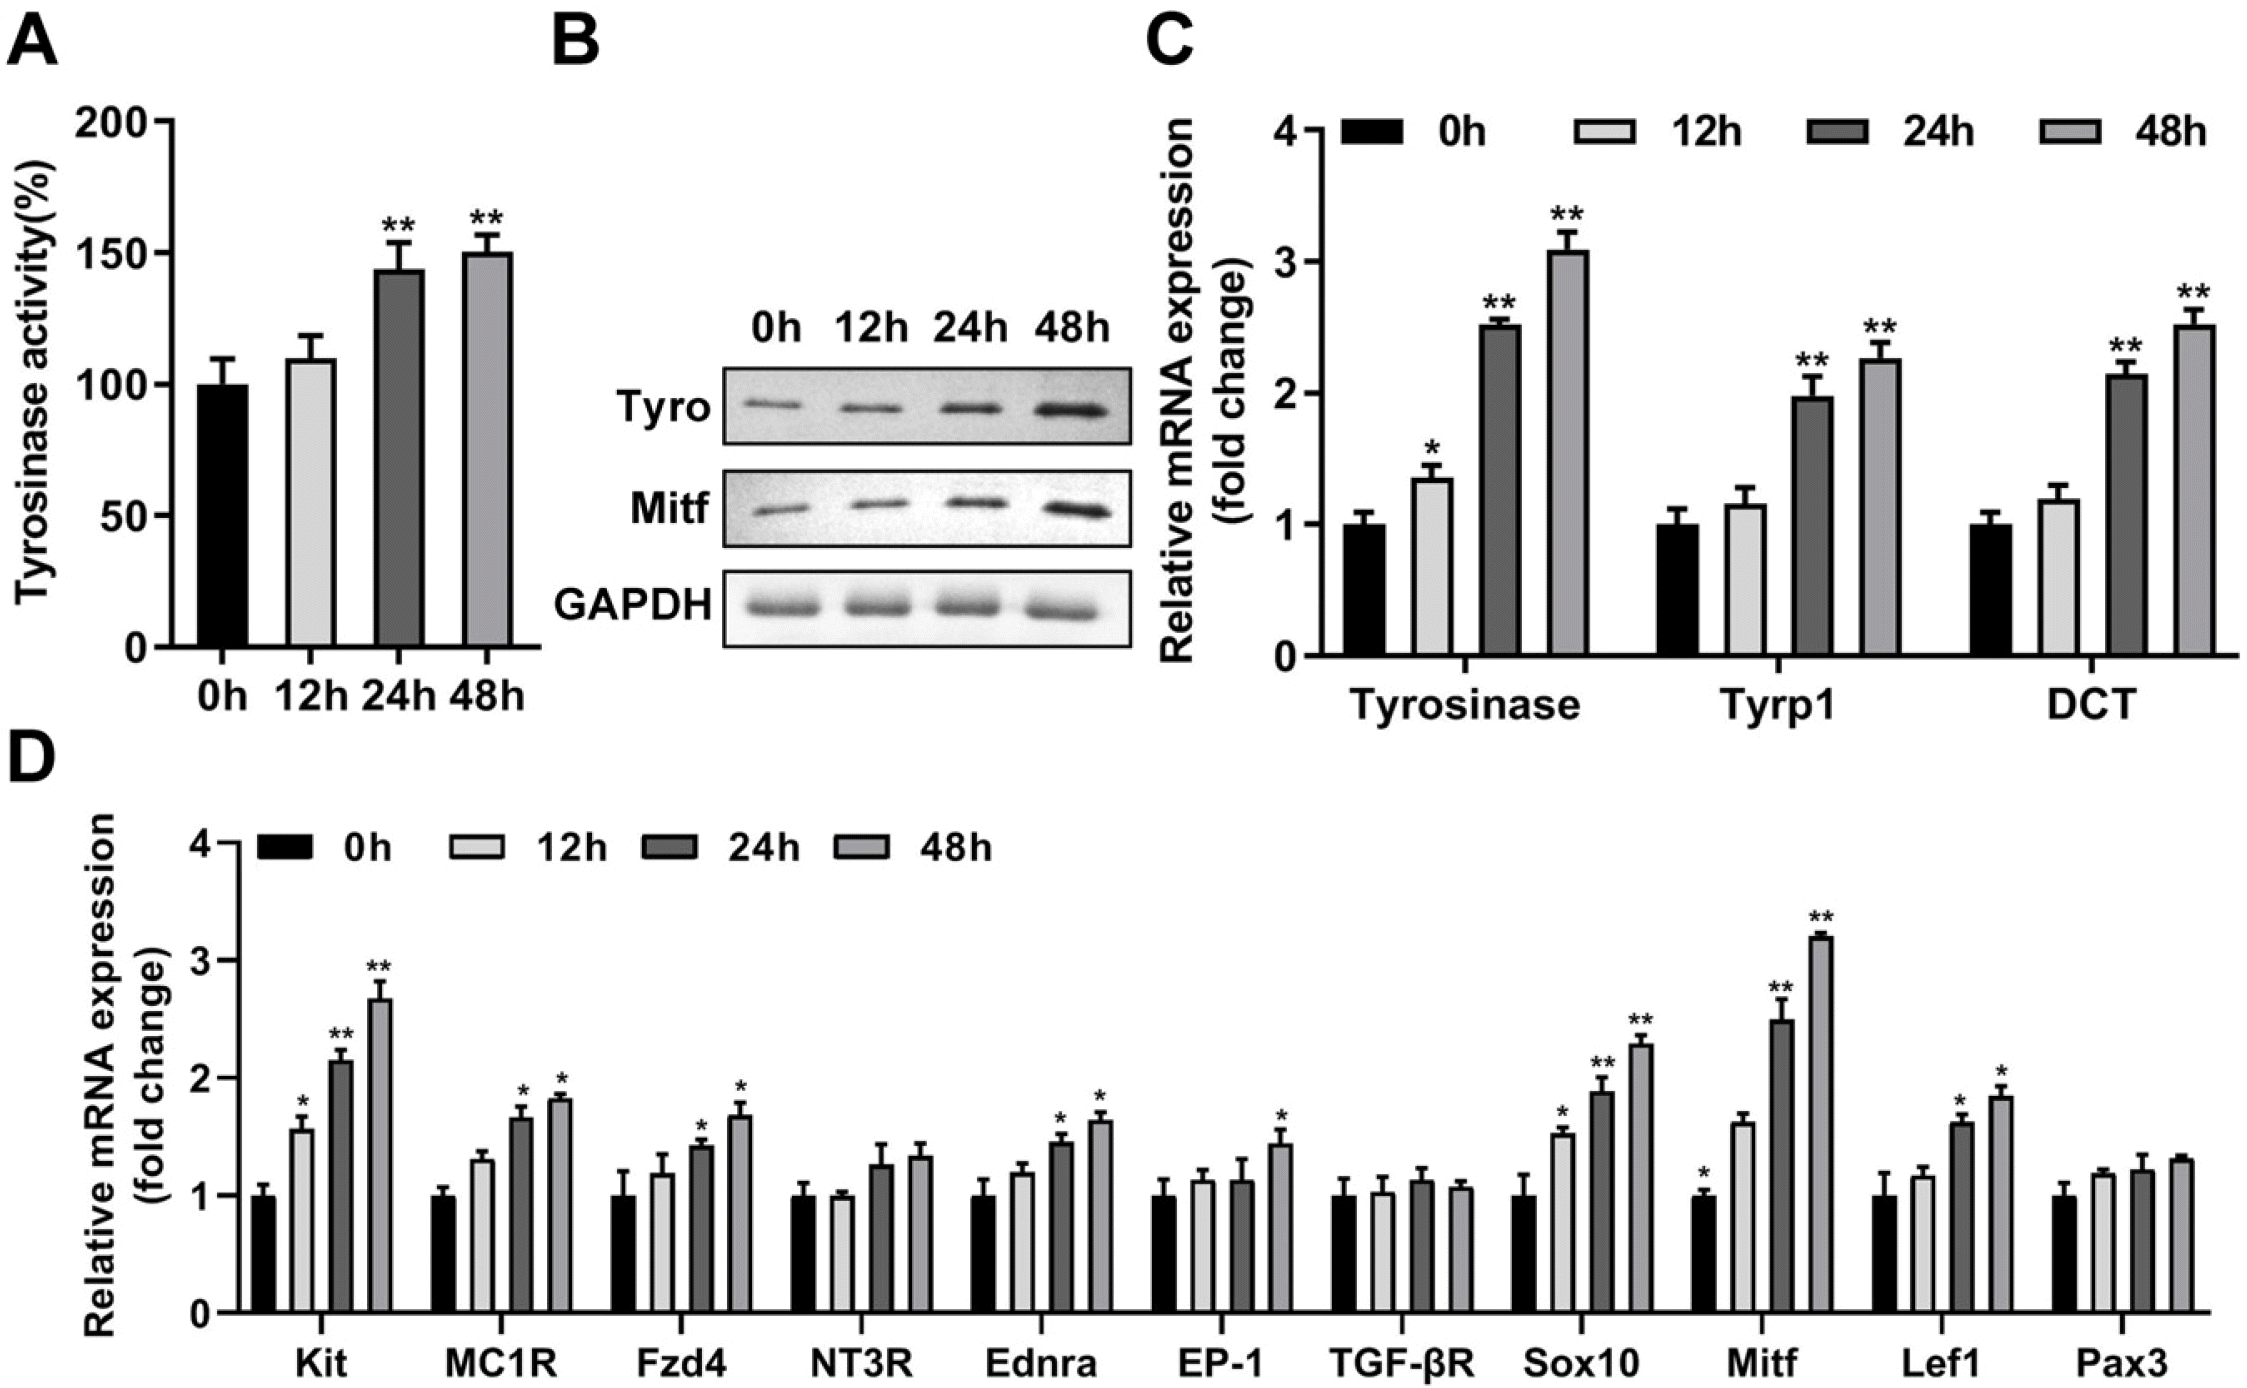
The culture medium of NCSCs in the adherent growth state was replaced with the MC differentiation-inducing medium M254 for 48 h, and the resulting tyrosinase-stained cells were prominently increased (Fig. 2A). With the extension of differentiation culture time, the viability of NCSCs and MCs derived from NCSCs was significantly increased, demonstrating that the increased number of MCs (Fig. 2B). The tyrosinase activity (Fig. 3A), and protein levels of tyrosinase and Mitf (Fig. 3B) of differentiated MCs were elevated with the passage of time of differentiation culture. Furthermore, mRNA expressions of key genes (22) involved in melanin production including tyrosinase, tyrosinase-related protein-1 (Tyrp1), and dopachrome tautomerase (DCT) were also prominently increased (Fig. 3C). Meanwhile, a series of receptors of melanogenic stimulants on MCs (Kit, MC1R, Fzd4, NT3R, Ednra, EP-1, TGF-βR) and transcription factors (Sox10, Mitf, Lef1, Pax3) were detected, and the results demonstrated that Kit, MC1R, Fzd4, Ednra, Sox10, Mitf, and Lef1 were prominently upregulated with the prolongation of differentiation time (Fig. 3D).

FTO participates in the differentiation NCSCs into MCs

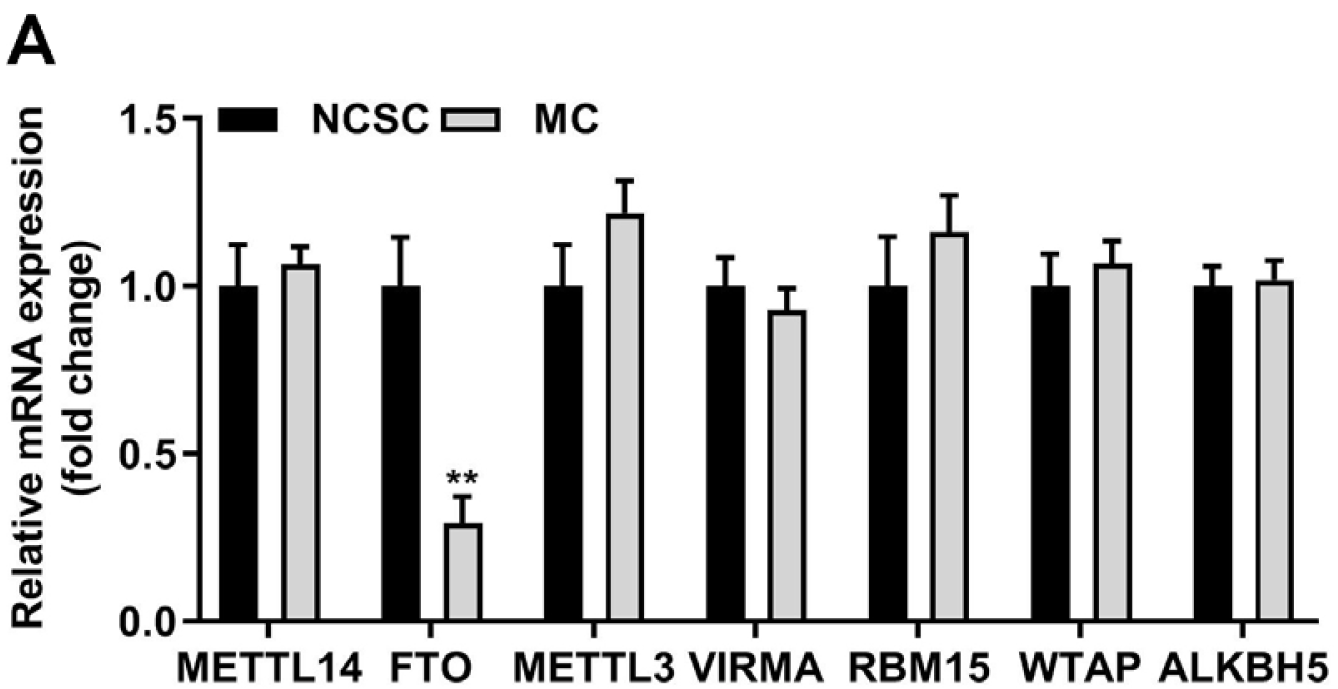
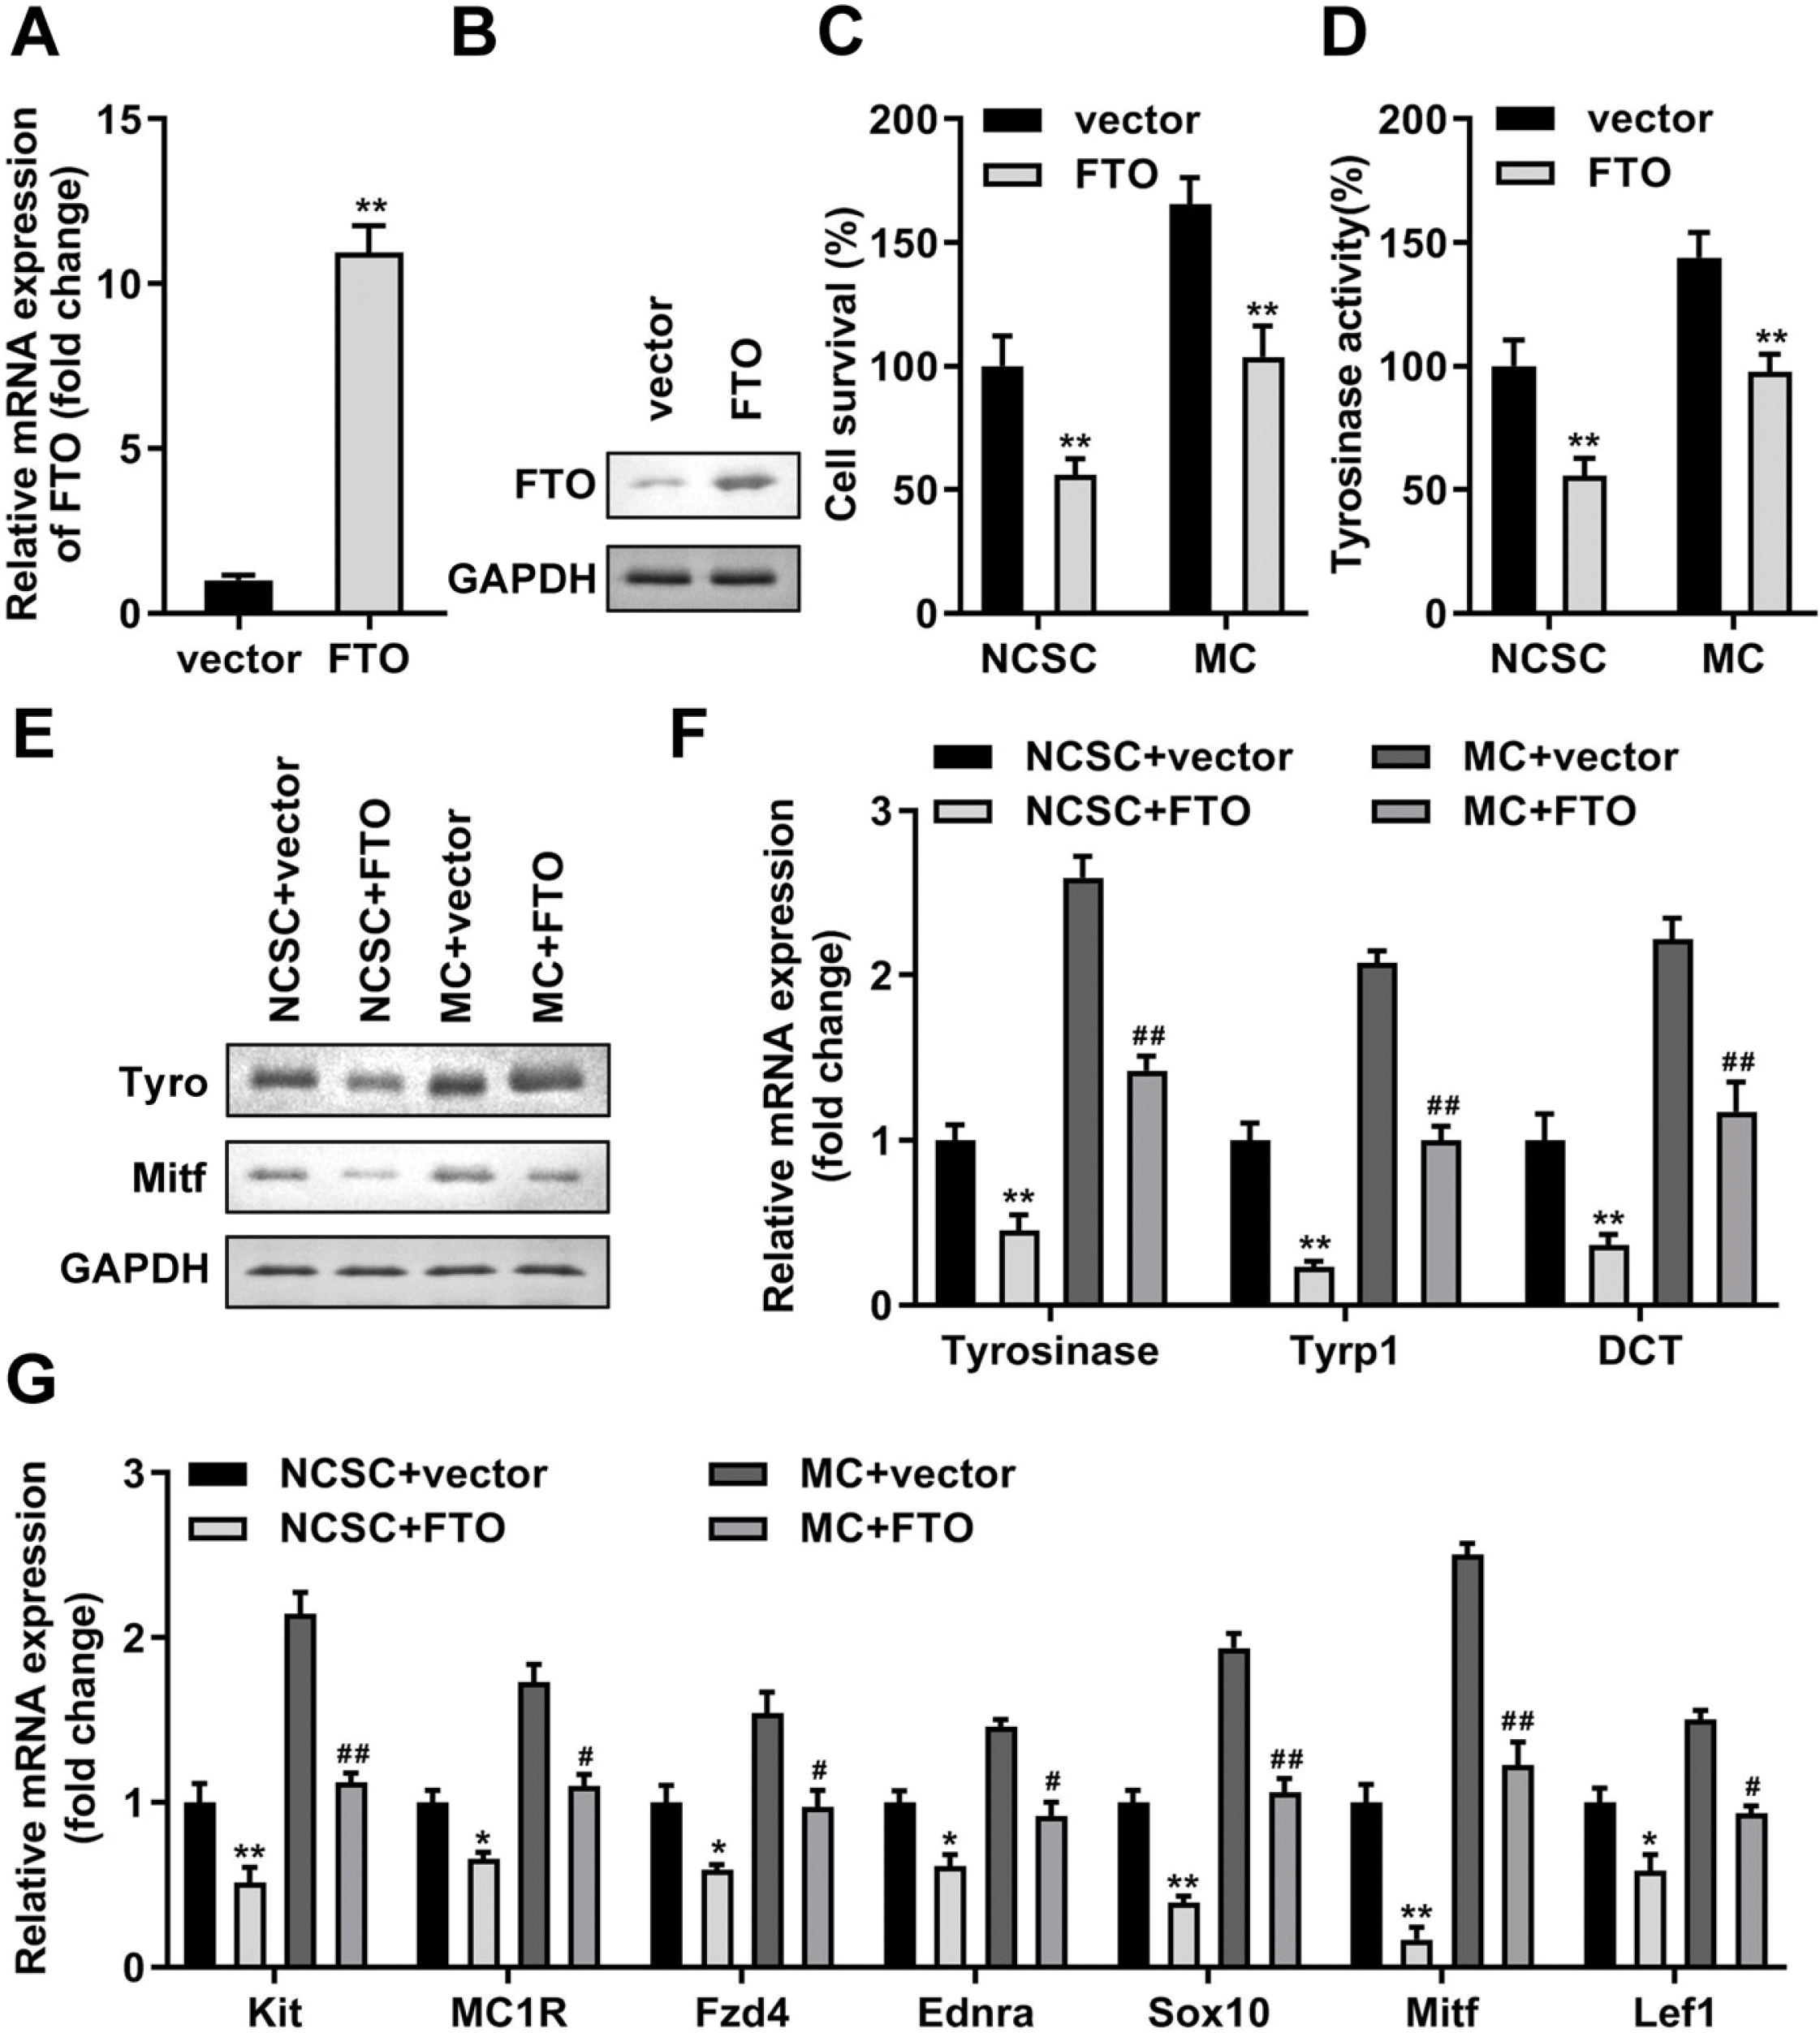
Afterwards, mRNA of seven m6A-associated genes were accessed by RT-qPCR from primary NCSCs and differentiated MCs, and the consequence revealed that FTO was prominently lowly expressed in MCs compared with NCSC group (Fig. 4). Then, we elevated both protein and mRNA levels of FTO in NCSCs (Fig. 5A and 5B) and obtained differentiated MCs. Increased FTO dramatically decreased cell viability (Fig. 5C), tyrosinase activity (Fig. 5D), levels of tyrosinase, Mitf, Tyrp1, and DCT (Fig. 5E and 5F). Meanwhile, melanogenic stimulants and transcription factors of MCs and NCSCs were all suppressed by the upregulation of FTO (Fig. 5G).

FTO can modify Mitf by m6A methylation to weaken the stability of Mitf

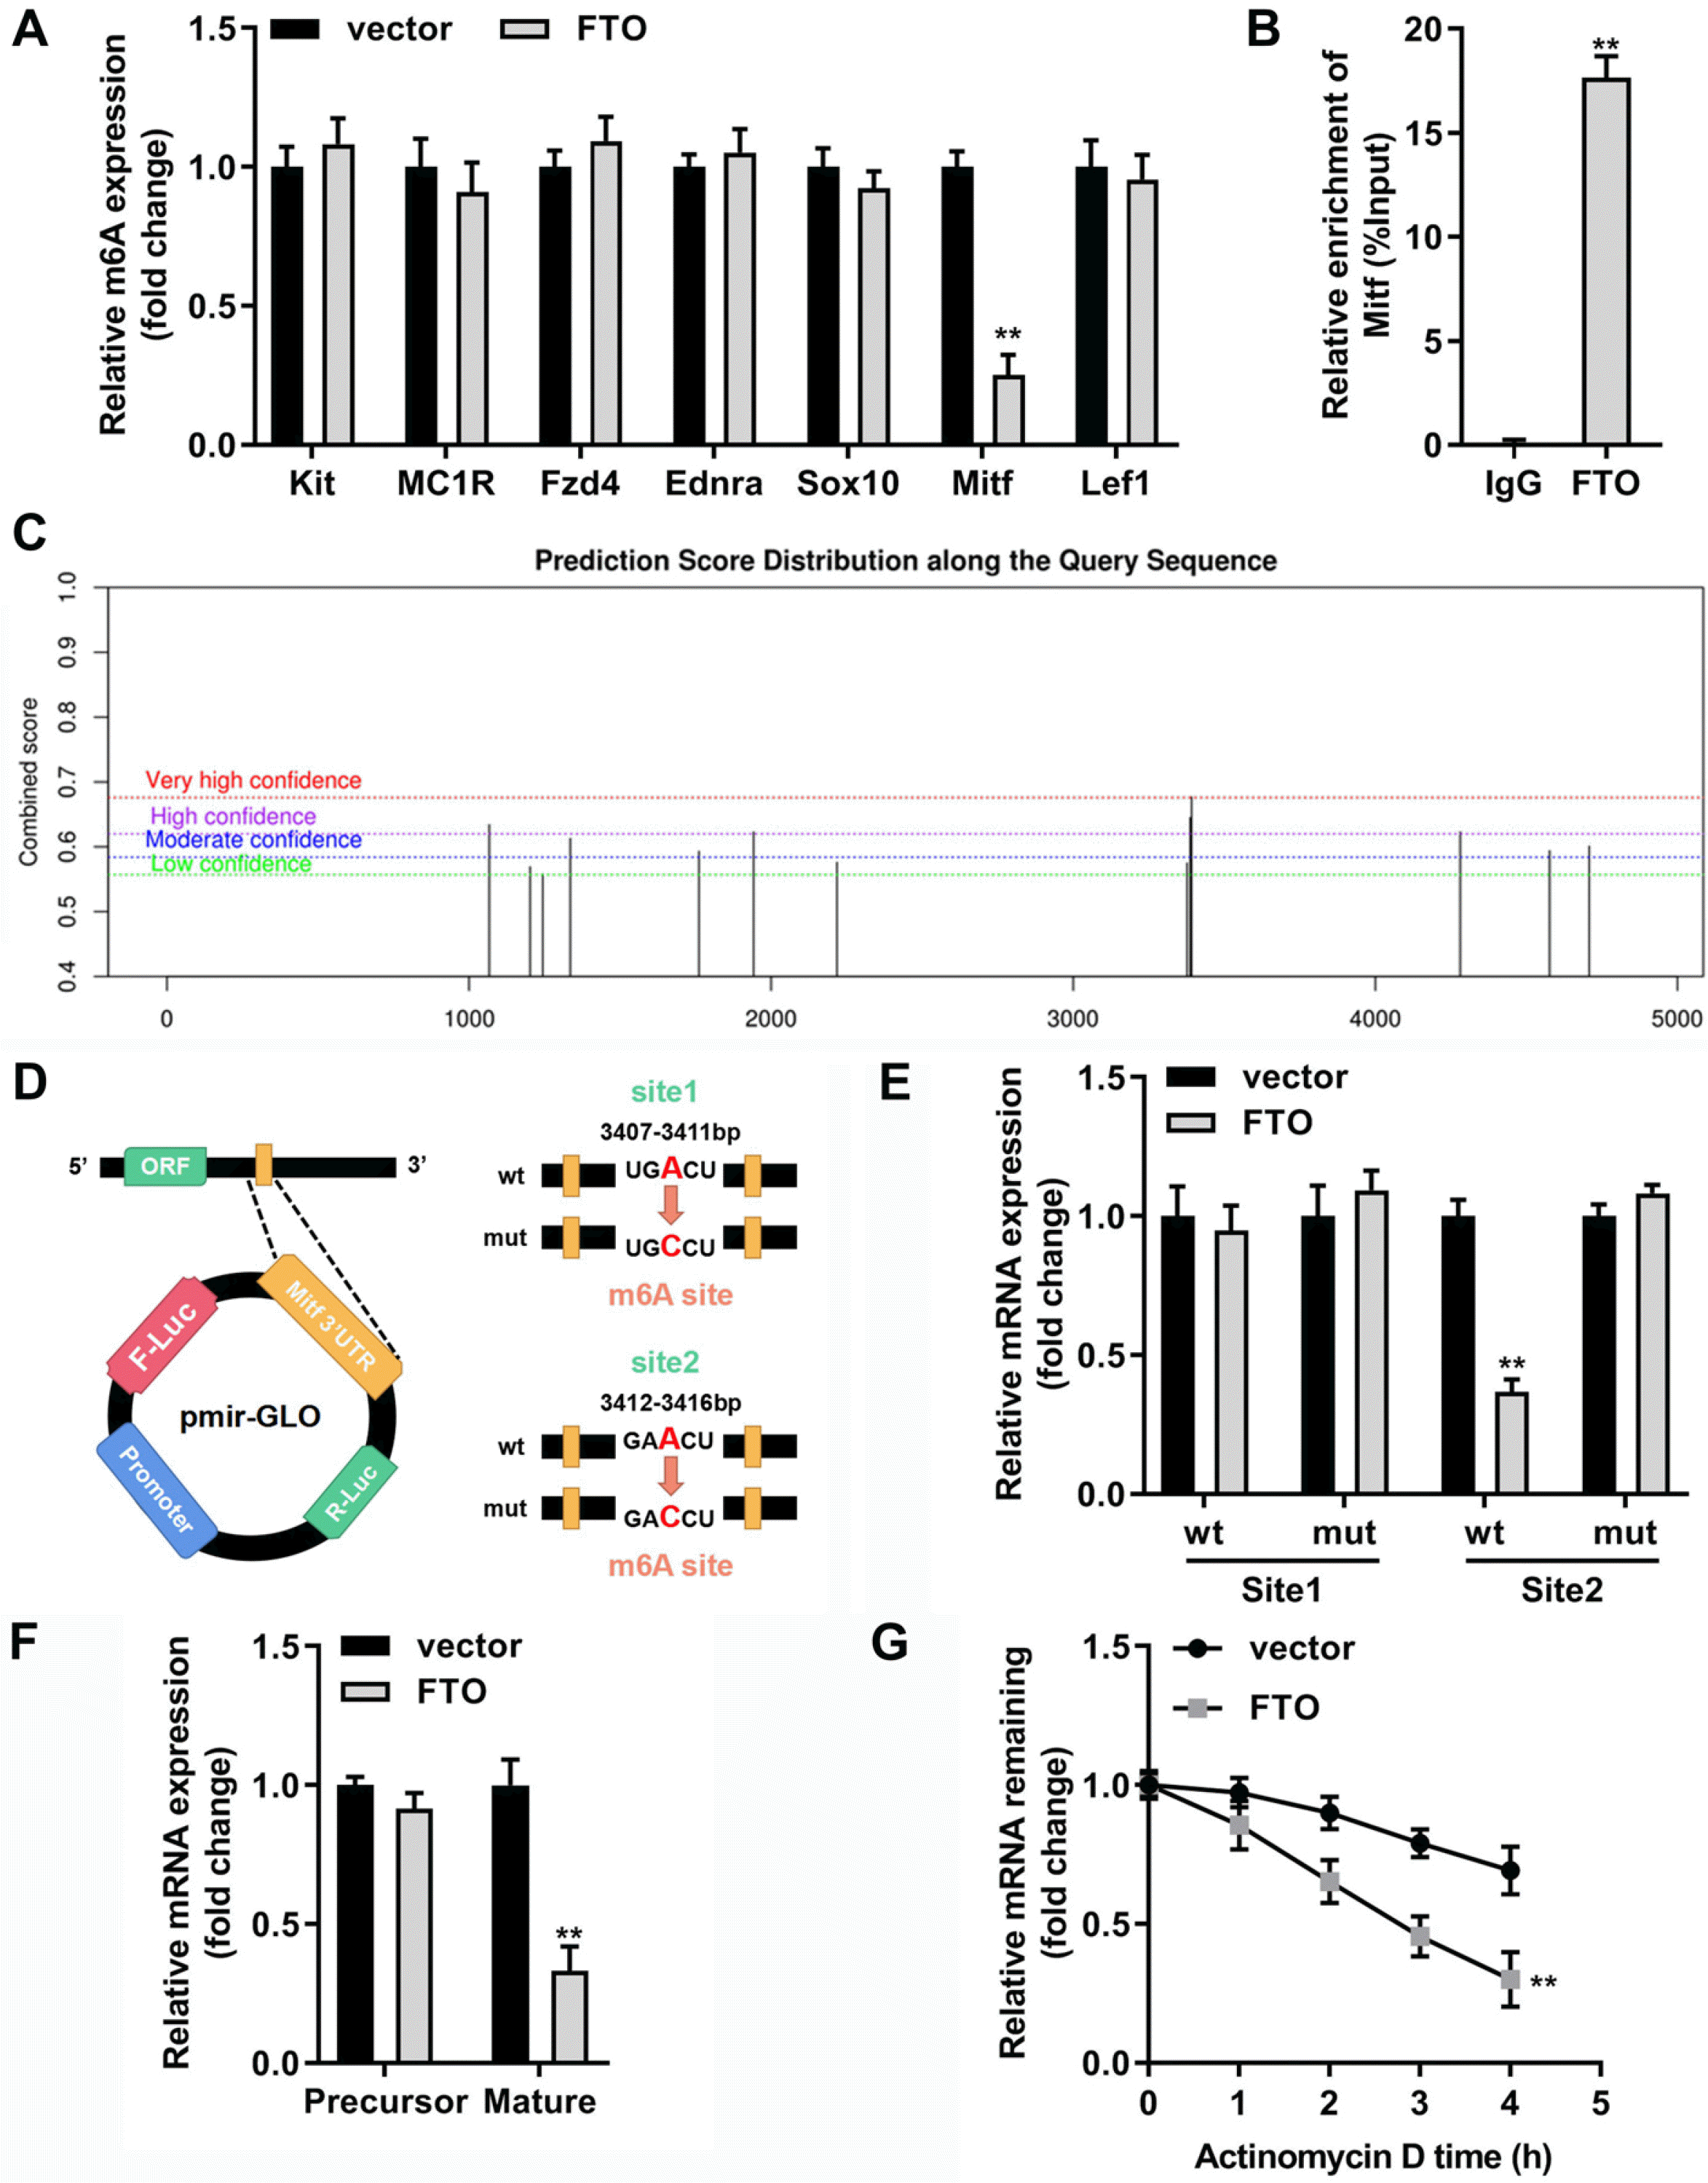
Next, to determine whether melanogenic factors were affected by the m6A modification influenced by FTO, m6A levels of seven selected melanogenic genes were measured, and the consequence revealed that m6A level of Mitf was dramatically suppressed by elevated FTO (Fig. 6A). RIP-qPCR experiment was then conducted to verify the binding relationship between FTO and Mitf (Fig. 6B). Then, SRAMP, a sequence-based m6A modification site predictor, was applied to predict the potential theoretical binding sites of FTO, and there were two sites for m6A modification located at 3,407∼3,411 bp and 3,412∼3,416 bp (Fig. 6C and 6D). Afterwards, whether the two sites can play the m6A modification function was verified by the base mutation of the binding site, and our data suggested that luciferase activity of differentiated MCs tansfected with overexpressed FTO was suppressed in wild-type site 2 group; however, there were no significant differences of luciferase activity between site 1 groups and mutant-type site 2 groups (Fig. 6E). Subsequently, we found that elevated FTO led to the significant decrease of Mitf mRNA expression, but no obvious alternations were observed in the precursor mRNA of Mitf (Fig. 6F). Moreover, our findings illustrated that FTO markedly promoted the degradation of remaining Mitf mRNA caused by RNA synthesis inhibitor actinomycin D in MCs (Fig. 6G).

Mitf abolished the potency of FTO in MC formation

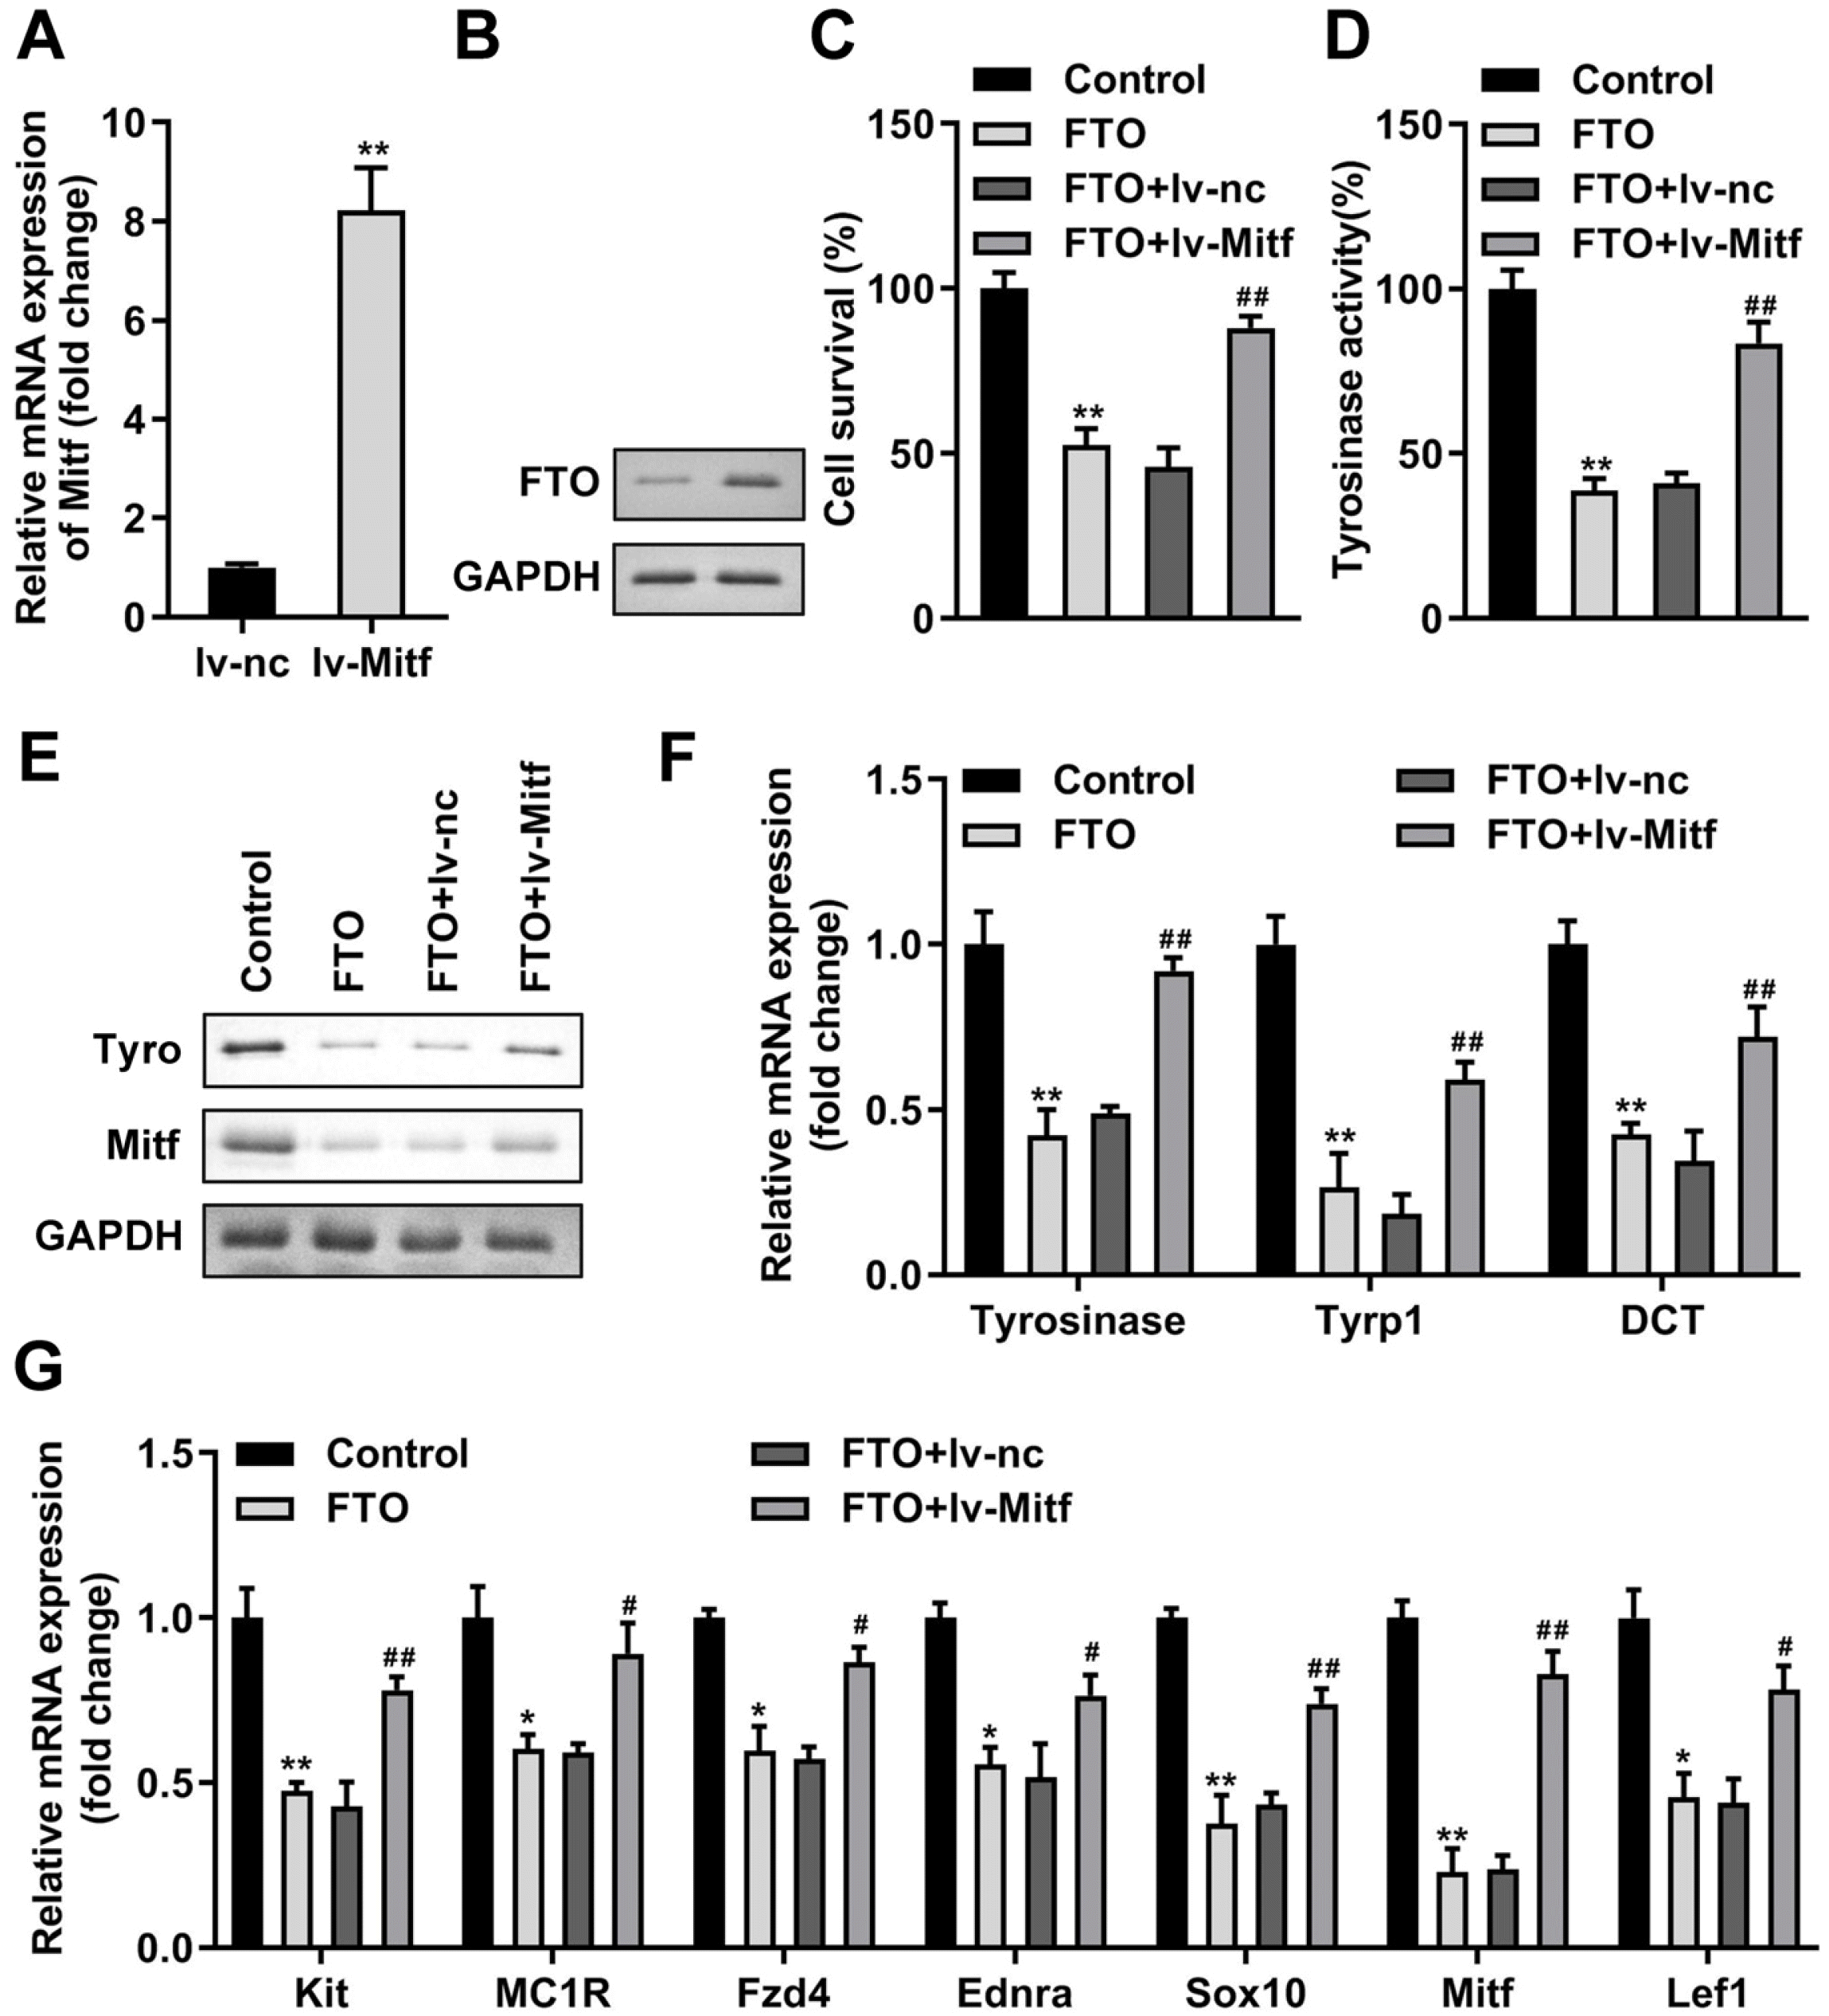
According to the foregoing, we probed whether FTO suppressed NCSC’s differentiation into MCs via targeting Mitf. Firstly, we upregulated Mitf in NCSCs for melanogenic differentiation which was verified on mRNA (Fig. 7A) and protein levels (Fig. 7B). Mitf upregulation prominently reversed the inhibition effctets of elevated FTO on cell viability (Fig. 7C), tyrosinase activity (Fig. 7D), levels of tyrosinase, Mitf, Tyrp1, and DCT (Fig. 7E and 7F), and melanogenic stimulants and transcription factors (Fig. 7G).

Discussion

It is well known that the mechanism of differentiation of hair follicle-derived NCSCs into MCs is of great significance for the treatment of MC dysfunction related diseases. Herein, we found that FTO was lowly expressed in differentiated MCs compared with NCSCs, and upregulation of FTO suppressed the differentiation of NCSCs into MCs. Mechanically, FTO was a negative regulator of Mitf through affecting its stability in a m6A-dependent manner.
Hair follicles are important skin appendages in mammals. NCSCs exist in the hair follicle eminence, which can be expanded in vitro and have the potential to differentiate efficiently (23, 24). NCSCs derived from hair follicles can differentiate into MCs in vitro (25, 26). Therefore, the isolation and directed differentiation of NCSCs can help us to further study the development and differentiation process and regulatory mechanism from NCSC stage to MC precursor stage to MC cell stage, thus providing new theoretical basis and new ideas for understanding the occurrence, development and recovery of pigmented diseases (17, 27). Our data was in line with previous studies showing that NCSCs derived from rat hair follicles can differentiated into cells with the characteristics consistent with MCs.
Next, we wondered if m6A modification participates in the differentiation progress, and then FTO was selected as the subsequent study object. FTO gene causes the occurrence and development of various diseases by regulating the level of m6A (28-30). FTO regulates the differentiation ability of various stem cells. For instance, the mRNA level of FTO decreased during osteogenic differentiation and increased during adipogenic differentiation of bone marrow mesenchyml stem cells (31). FTO deficiency reduces the proliferation and neuronal differentiation of adult neural stem cells in the body, leading to impaired learning and memory (32). Knockdown of FTO in adult neural stem cells promotes neuronal differentiation in vitro and in vivo (33). However, whether FTO modulates the differentiation of NCSCs into MCs remains unclear. In current work, FTO was aberrant suppressed in MCs and overexpressed FTO in NCSCs could inhibit the differentiation progress form NCSCs into MCs. Further-more, the increase of FTO resulted in a significant decrease in the m6A level of Mitf in differentiated MCs, indicating a potential m6A modification relationship between FTO and Mitf. As we mentioned before, Mitf plays a key role in melanin synthesis such as affecting the formation, migration, proliferation and differentiation of MCs (4, 6, 7). Hence, the underlying mechanism between FTO and Mitf is worthy to be studied.
In this study, we found that FTO and Mitf were negatively correlated in differentiated MCs, and there are two methylation binding sites of Mitf. Further investigations illuminated that stability of Mitf could be weakened by FTO. Moreover, our results supported the conclusion that FTO executed its suppressing role on NCSCs differentiation into MCs by targeting Mitf. In terms of regulatory mechanism, FTO was proven to impair the stability of Mitf to exert the suppressing behaviors.
In conclusion, by the large, FTO functioned as a inhibitor in differentiation of NCSCs into MCs in vitro. More importantly, FTO exerts suppression functions by inhibiting m6A-mediated Mitf stability.

Acknowledgments

Not applicable.

Notes

Potential Conflict of Interest

The authors have no conflicting financial interest.

Authors Contributions

All authors participated in the design, interpretation of the studies and analysis of the data and review of the manuscript. Z S drafted the work and revised it critically for important intellectual content and made substantial contributions to the conception or design of the work; H F and L X were responsible for the acquisition, analysis and interpretation of data for the work.

Data Availability Statement

The datasets used and analyzed during the current study are available from the corresponding author on reasonable request.

Supplementary Materials

Supplementary data including one figure can be found with this article online at https://doi.org/10.15283/ijsc22106.

References

1. Lin JY, Fisher DE. 2007; Melanocyte biology and skin pigmen-tation. Nature. 445:843–850. DOI: 10.1038/nature05660. PMID: 17314970.
crossref
2. Li M, Knapp SK, Iden S. 2020; Mechanisms of melanocyte polarity and differentiation: what can we learn from other neuroectoderm-derived lineages? Curr Opin Cell Biol. 67:99–108. DOI: 10.1016/j.ceb.2020.09.001. PMID: 33099084.
crossref
3. Nishimura EK. 2011; Melanocyte stem cells: a melanocyte reservoir in hair follicles for hair and skin pigmentation. Pigment Cell Melanoma Res. 24:401–410. DOI: 10.1111/j.1755-148X.2011.00855.x. PMID: 21466661.
crossref
4. Mort RL, Jackson IJ, Patton EE. 2015; The melanocyte lineage in development and disease. Development. 142:620–632. Erratum in: Development 2015;142:1387. DOI: 10.1242/dev.106567. PMID: 25670789. PMCID: PMC4325379.
crossref
5. Le Douarin NM, Dupin E. 2018; The "beginnings" of the neural crest. Dev Biol. 444 Suppl 1:S3–S13. DOI: 10.1016/j.ydbio.2018.07.019. PMID: 30048640.
crossref
6. Goding CR, Arnheiter H. 2019; MITF-the first 25 years. Genes Dev. 33:983–1007. DOI: 10.1101/gad.324657.119. PMID: 31123060. PMCID: PMC6672050.
crossref
7. Levy C, Khaled M, Fisher DE. 2006; MITF: master regulator of melanocyte development and melanoma oncogene. Trends Mol Med. 12:406–414. DOI: 10.1016/j.molmed.2006.07.008. PMID: 16899407.
crossref
8. Murtas D, Pilloni L, Diana A, Casula L, Tomei S, Piras F, Ferreli C, Maxia C, Perra MT. 2019; Tyrosinase and nestin immunohistochemical expression in melanocytic nevi as a histopathologic pattern to trace melanocyte differentiation and nevogenesis. Histochem Cell Biol. 151:175–185. DOI: 10.1007/s00418-018-1730-5. PMID: 30232588.
crossref
9. Wang Y, Lan Y, Yang X, Gu Y, Lu H. 2021; TGFβ2 upregulates tyrosinase activity through opsin-3 in human skin melanocytes in vitro. J Invest Dermatol. 141:2679–2689. DOI: 10.1016/j.jid.2021.01.040. PMID: 34029574.
crossref
10. Lee JY, Lee J, Min D, Kim J, Kim HJ, No KT. 2020; Tyrosinase-targeting gallacetophenone inhibits melanogenesis in melanocytes and human skin-equivalents. Int J Mol Sci. 21:3144. DOI: 10.3390/ijms21093144. PMID: 32365630. PMCID: PMC7246559. PMID: 39332c0683e5445cbed81376448fe847.
crossref
11. Ma S, Chen C, Ji X, Liu J, Zhou Q, Wang G, Yuan W, Kan Q, Sun Z. 2019; The interplay between m6A RNA methylation and noncoding RNA in cancer. J Hematol Oncol. 12:121. DOI: 10.1186/s13045-019-0805-7. PMID: 31757221. PMCID: PMC6874823. PMID: 911a2317a4414c90baf1d56223fab361.
crossref
12. Weng H, Huang H, Wu H, Qin X, Zhao BS, Dong L, Shi H, Skibbe J, Shen C, Hu C, Sheng Y, Wang Y, Wunderlich M, Zhang B, Dore LC, Su R, Deng X, Ferchen K, Li C, Sun M, Lu Z, Jiang X, Marcucci G, Mulloy JC, Yang J, Qian Z, Wei M, He C, Chen J. 2018; METTL14 inhibits hematopoietic stem/progenitor differentiation and promotes leukemogenesis via mRNA m6A modification. Cell Stem Cell. 22:191–205.e9. DOI: 10.1016/j.stem.2017.11.016. PMID: 29290617. PMCID: PMC5860916.
crossref
13. Wen J, Lv R, Ma H, Shen H, He C, Wang J, Jiao F, Liu H, Yang P, Tan L, Lan F, Shi YG, He C, Shi Y, Diao J. 2018; Zc3h13 regulates nuclear RNA m6A methylation and mouse embryonic stem cell self-renewal. Mol Cell. 69:1028–1038.e6. DOI: 10.1016/j.molcel.2018.02.015. PMID: 29547716. PMCID: PMC5858226.
crossref
14. Lin J, Zhu Q, Huang J, Cai R, Kuang Y. 2020; Hypoxia promotes vascular smooth muscle cell (VSMC) differentiation of adipose-derived stem cell (ADSC) by regulating Mettl3 and paracrine factors. Stem Cells Int. 2020:2830565. DOI: 10.1155/2020/2830565. PMID: 32148516. PMCID: PMC7053496. PMID: fb747c2361ac43fbac2aff14024d0151.
crossref
15. Vasyliev RG, Gubar OS, Gordiienko IM, Litvinova LS, Rodnichenko AE, Shupletsova VV, Zlatska AV, Yurova KA, Todosenko NM, Khadzhynova VE, Shulha MV, Novikova SN, Zubov DO. 2019; Comparative analysis of biological properties of large-scale expanded adult neural crest-derived stem cells isolated from human hair follicle and skin dermis. Stem Cells Int. 2019:9640790. DOI: 10.1155/2019/9640790. PMID: 30915126. PMCID: PMC6399535. PMID: 53b2e09df6264e01a1ba2614430965a4.
crossref
16. Ni Y, Zhang K, Liu X, Yang T, Wang B, Fu L, A L, Zhou Y. 2014; miR-21 promotes the differentiation of hair follicle-deri-ved neural crest stem cells into Schwann cells. Neural Regen Res. 9:828–836. DOI: 10.4103/1673-5374.131599. PMID: 25206896. PMCID: PMC4146246.
crossref
17. Dong D, Jiang M, Xu X, Guan M, Wu J, Chen Q, Xiang L. 2012; The effects of NB-UVB on the hair follicle-derived neural crest stem cells differentiating into melanocyte lineage in vitro. J Dermatol Sci. 66:20–28. DOI: 10.1016/j.jdermsci.2012.01.012. PMID: 22391242.
18. Krebs AM, Mitschke J, Lasierra Losada M, Schmalhofer O, Boerries M, Busch H, Boettcher M, Mougiakakos D, Reichardt W, Bronsert P, Brunton VG, Pilarsky C, Winkler TH, Brabletz S, Stemmler MP, Brabletz T. 2017; The EMT-activator Zeb1 is a key factor for cell plasticity and promotes metastasis in pancreatic cancer. Nat Cell Biol. 19:518–529. DOI: 10.1038/ncb3513. PMID: 28414315.
crossref
19. Ohguchi K, Banno Y, Nakagawa Y, Akao Y, Nozawa Y. 2005; Negative regulation of melanogenesis by phospholipase D1 through mTOR/p70 S6 kinase 1 signaling in mouse B16 melanoma cells. J Cell Physiol. 205:444–451. DOI: 10.1002/jcp.20421. PMID: 15895362.
crossref
20. Jin D, Guo J, Wu Y, Du J, Yang L, Wang X, Di W, Hu B, An J, Kong L, Pan L, Su G. 2019; m6A mRNA methylation initiated by METTL3 directly promotes YAP translation and increases YAP activity by regulating the MALAT1-miR-1914-3p-YAP axis to induce NSCLC drug resistance and metastasis. J Hematol Oncol. 12:135. Erratum in: J Hematol Oncol 2020;13:106. DOI: 10.1186/s13045-020-00942-x. PMID: 32746876. PMCID: PMC7397643. PMID: e0b20dfa351a4378a85213860c179d3a.
21. Dong G, Yu J, Shan G, Su L, Yu N, Yang S. 2021; N6-methylade-nosine methyltransferase METTL3 promotes angiogenesis and atherosclerosis by upregulating the JAK2/STAT3 pathway via m6A reader IGF2BP1. Front Cell Dev Biol. 9:731810. DOI: 10.3389/fcell.2021.731810. PMID: 34950654. PMCID: PMC8689138. PMID: f13ec458e5234c8ca7886ba0578757ae.
crossref
22. Zhou S, Zeng H, Huang J, Lei L, Tong X, Li S, Zhou Y, Guo H, Khan M, Luo L, Xiao R, Chen J, Zeng Q. 2021; Epige-netic regulation of melanogenesis. Ageing Res Rev. 69:101349. DOI: 10.1016/j.arr.2021.101349. PMID: 33984527.
crossref
23. Schneider MR, Schmidt-Ullrich R, Paus R. 2009; The hair follicle as a dynamic miniorgan. Curr Biol. 19:R132–R142. DOI: 10.1016/j.cub.2008.12.005. PMID: 19211055.
crossref
24. Lee J, Bӧscke R, Tang PC, Hartman BH, Heller S, Koehler KR. 2018; Hair follicle development in mouse pluripotent stem cell-derived skin organoids. Cell Rep. 22:242–254. DOI: 10.1016/j.celrep.2017.12.007. PMID: 29298425. PMCID: PMC5806130.
crossref
25. Narytnyk A, Verdon B, Loughney A, Sweeney M, Clewes O, Taggart MJ, Sieber-Blum M. 2014; Differentiation of human epidermal neural crest stem cells (hEPI-NCSC) into virtually homogenous populations of dopaminergic neurons. Stem Cell Rev Rep. 10:316–326. DOI: 10.1007/s12015-013-9493-9. PMID: 24399192. PMCID: PMC3969515.
crossref
26. Wilson R, Ahmmed AA, Poll A, Sakaue M, Laude A, Sieber-Blum M. 2018; Human peptidergic nociceptive sensory neurons generated from human epidermal neural crest stem cells (hEPI-NCSC). PLoS One. 13:e0199996. DOI: 10.1371/journal.pone.0199996. PMID: 29953534. PMCID: PMC6023242. PMID: 3c72237a7e5742788c6c4be259b86c07.
crossref
27. Dong D, Chen S, Feng C, Xiong H, Xu X. 2020; NB-UVB induces melanocytic differentiation of human hair follicle neural crest stem cells. Ann Dermatol. 32:289–297. DOI: 10.5021/ad.2020.32.4.289. PMID: 33911756. PMCID: PMC7992648.
crossref
28. Li J, Zhu L, Shi Y, Liu J, Lin L, Chen X. 2019; m6A demethylase FTO promotes hepatocellular carcinoma tumorigenesis via mediating PKM2 demethylation. Am J Transl Res. 11:6084–6092. PMID: 31632576. PMCID: PMC6789218.
29. Tao L, Mu X, Chen H, Jin D, Zhang R, Zhao Y, Fan J, Cao M, Zhou Z. 2021; FTO modifies the m6A level of MALAT and promotes bladder cancer progression. Clin Transl Med. 11:e310. DOI: 10.1002/ctm2.310. PMID: 33634966. PMCID: PMC7851431. PMID: 521809a4df2b45918254a3c2d6dd3810.
crossref
30. Jiang X, Liu B, Nie Z, Duan L, Xiong Q, Jin Z, Yang C, Chen Y. 2021; The role of m6A modification in the biological functions and diseases. Signal Transduct Target Ther. 6:74. DOI: 10.1038/s41392-020-00450-x. PMID: 33611339. PMCID: PMC7897327. PMID: 6713afd9239d44a7ad0a9b5c9cd8e10c.
crossref
31. Shen GS, Zhou HB, Zhang H, Chen B, Liu ZP, Yuan Y, Zhou XZ, Xu YJ. 2018; The GDF11-FTO-PPARγ axis controls the shift of osteoporotic MSC fate to adipocyte and inhibits bone formation during osteoporosis. Biochim Biophys Acta Mol Basis Dis. 1864:3644–3654. DOI: 10.1016/j.bbadis.2018.09.015. PMID: 30279140.
crossref
32. Li L, Zang L, Zhang F, Chen J, Shen H, Shu L, Liang F, Feng C, Chen D, Tao H, Xu T, Li Z, Kang Y, Wu H, Tang L, Zhang P, Jin P, Shu Q, Li X. 2017; Fat mass and obesity-associated (FTO) protein regulates adult neurogenesis. Hum Mol Genet. 26:2398–2411. DOI: 10.1093/hmg/ddx128. PMID: 28398475. PMCID: PMC6192412.
crossref
33. Cao Y, Zhuang Y, Chen J, Xu W, Shou Y, Huang X, Shu Q, Li X. 2020; Dynamic effects of Fto in regulating the proliferation and differentiation of adult neural stem cells of mice. Hum Mol Genet. 29:727–735. DOI: 10.1093/hmg/ddz274. PMID: 31751468.
crossref

Fig. 1
Neural crest origin and pluripotency of differentiation of NCSCs. (A) NCSCs in the suspended state. (B) NCSCs in the adherent state. (C) Gene expression profiles of NCSCs. Differentiated cells produce an immune response to (D) β-Tubulin III, (E) SMA and (F) tyrosinase.
ijsc-16-2-135-f1.tif
Fig. 2
(A) Tyrosinase-stained cells were prominently increased and (B) the overall cell viability was markedly improved with the MC differentiation. **p<0.01.
ijsc-16-2-135-f2.tif
Fig. 3
Identification of MCs differentiated from NCSCs. (A) Tyrosinase activity of MCs derived from NCSCs. (B) Protein levels of tyrosinase and Mitf determined by western blot. (C) mRNA levels of key genes in the formation MCs. (D) A series of recep-tors of melanogenic stimulants on MCs and transcription factors were accessed by RT-qPCR. *p<0.05, **p<0.01.
ijsc-16-2-135-f3.tif
Fig. 4
mRNA of seven m6A-associated genes were accessed by RT-qPCR from primary NCSCs and differentiated MCs.
ijsc-16-2-135-f4.tif
Fig. 5
FTO participates in the differentiation NCSCs into MCs. (A) mRNA level and (B) Protein expression of FTO in NCSCs with elevated FTO. (C) cell viability of MCs derived from NCSCs with elevated FTO and (D) Tyrosinase activity. (E) Protein levels of tyrosinase and Mitf determined by western blot. (F) mRNA levels of key genes in the formation MCs. (G) A series of receptors of melanogenic stimulants on MCs and transcription factors were accessed by RT-qPCR. *p<0.05, **p<0.01, #p<0.05, ##p<0.01. FTO: fat mass and obesity-associated protein, NCSCs: neural crest stem cells, MCs: mela-nocytes.
ijsc-16-2-135-f5.tif
Fig. 6
FTO can modify Mitf by m6A methylation to weaken the stability of Mitf. (A) Total m6A levels of melanogenic factors in MCs with elevated FTO. (B) Mitf enriched by FTO was accessed by RIP experiment method. (C, D) SRAMP was applied to predict the potential theoretical binding sites of Mitf for m6A modi-fication. (E) Luciferase activity of MCs tansfected with overexpression of FTO in both wild-type and mutant-type groups. (F) RT-qPCR assay was conducted to determine the expression of Mitf precursor and mature mRNA in MCs with elevated FTO. (G) The role of FTO in Mitf mRNA stability was assessed by using actinomycin D and RT-qPCR. **p<0.01.
ijsc-16-2-135-f6.tif
Fig. 7
Mitf abolished the potency of FTO in MC formation. (A) mRNA level and (B) Protein expression of Mitf in NCSCs with elevated Mitf. (C) Tyrosinase activity and (D) Cell viability of MCs derived from NCSCs with elevated Mitf. (E) Protein levels of tyrosinase and Mitf determined by western blot. (F) mRNA levels of key genes in the formation MCs. (G) A series of receptors of melanogenic stimulants on MCs and transcription factors were accessed by RT-qPCR. *p<0.05, **p<0.01, compared with lv-nc and control groups. #p<0.05, ##p<0.01, compared with FTO+lv-nc group.
ijsc-16-2-135-f7.tif
Table 1
Primer sequences
Gene Sequence
Nestin 5’-CAAGGGAGGAAGAGAGAAACAAGA-3’
5’-CAGCTGAGCCTATAGTTCAACGC-3’
p75 5’-CAGCAGCCAAGATGGAGCAAT-3’
5’-ATGGATCACAAGGTCTACGCC-3’
Sox10 5’-GCCCGTGCCATGCTAACTCT-3’
5’-CAAGGGGCCCGTGTGCTA-3’
Snail-1 5’-GCCTGGCACTGGTATCTCTTCAC-3’
5’-CGGCGCCGTCGTCCTTCT-3’
Twist-1 5’-CAGGGATGCCTTTCCTGTCA-3’
5’-AGGCCGGAGACCTAGATGTCATT-3’
Myo10 5’-GTGACTGACACCAAGGCTCCAAT-3’
5’-CCCATAGGGAAGAGGCAGGA-3’
Msx2 5’-TCAAGTGGCCCTGTCGCTTAG-3’
5’-TATGCTGCCCTCAGGCTTCAG-3’
Klf4 5’-ACCCACAGCCGTCCCAGTCA-3’
5’-CGGTCCCTAGAGGCCCATTT-3’
Wnt1 5’-CCGAGAAACAGCGTTCATCT-3’
5’-GCCTCGTTGTTGTGAAGGTT-3’
Tyrosinase 5’-TCATTGTGAATTTCCAAGAAAAA-3’
5’-GCTGGCAGATGTTCTCCTCT-3’
Tyrp1 5’-GCATTGCTCTCCAGTGATGA-3’
5’-TTTTCACAGCATACAGGCCA-3’
DCT 5’-GTCCTCCACTCTTTTACAGACG-3’
5’-ATTCGGTTGTGACCAATGGGT-3’
Kit 5’-GCCACGTCTCAGCCATCTG-3’
5’-GTCGGGATCAATGCACGTCA-3’
MC1R 5’-CAACCTCATTGACGTGCTCAT-3’
5’-TAACGCAGCGCATAGAAGATG-3’
Fzd4 5’-TTCCTTTGTTCGGTTTATGTGCC-3’
5’-CTCTCAGGACTGGTTCACAGC-3’
NT3R 5’-GCCAAGTGTAGTTTCTGGCG-3’
5’-CAGACACAATTTGCAGGGCA-3’
Ednra 5’-GGTGGCTCTTTGGGTTCT-3’
5’-GACGCTGTTTGAGGTGCT-3’
EP1 5’-GGGCTTAACCTGAGCCTAGC-3’
5’-GTGATGTGCCATTATCGCCTG-3’
TGF-βR 5’-AATAGGACCATCCATCCACTGA-3’
5’-TCACATCGCAAAACTTGCACA-3’
Sox10 5’-AGGTTGCTGAACGAAAGTGAC-3’
5’-CCGAGGTTGGTACTTGTAGTCC-3’
Mitf 5’-CCCTCTCACCTGTTGGAGTCA-3’
5’-CCGTTTCTTCTGCGCTCATAC-3’
Lef1 5’-AACGAGTCCGAAATCATCCCA-3’
5’-GCCAGAGTAACTGGAGTAGGA-3’
Pax3 5’-CCGGGGCAGAATTACCCAC-3’
5’-GCCGTTGATAAATACTCCTCCG-3’
METTL14 5’-GAACACAGAGCTTAAATCCCCA-3’
5’-TGTCAGCTAAACCTACATCCCTG-3’
FTO 5’-CGAGAGCGCGAAGCTAAGA-3’
5’-GCTGCCACTGCTGATAGAAT-3’
METTL3 5’-AGCCTTCTGAACCAACAGTCC-3’
5’-CCGACCTCGAGAGCGAAAT-3’
VIRMA 5’-CCGGGAGTACGAGCCCATA-3’
5’-CAGGCTTCCCAACCTATCAAAAA-3’
RBM15 5’-GCGAGTCCGCTGTGTGAAA-3’
5’-TCCCCACGAGAACTGGAGTC-3’
WTAP 5’-ATGGCACGGGATGAGTTAATTC-3’
5’-TTCCCTTAAACCAGTCACATCG-3’
ALKBH5 5’-TGAGCACAGTCACGCTTCCC-3’
5’-TCCGTGTCCTTCTTTAGCGACTC-3’
β-actin 5’-GCAAAGACCTGTACGCCAAC-3’
5’-CTAGAAGCATTTGCGGTGGA-3’
TOOLS
Similar articles