

 PDF
PDF Citation
 Print
Print


INTRODUCTION
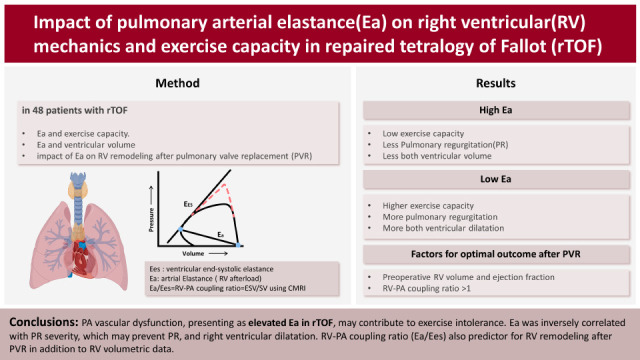
Patients frequently develop dilatation of the right ventricle after the repair of tetralogy of Fallot (TOF), which can lead to progressive right ventricular (RV) failure during long-term follow-up.1)2)3)4) Recent management guidelines for the timing of pulmonary valve replacement (PVR) focused heavily on preoperative RV volumes predictive of normal postoperative RV size after PVR.5)
The pathophysiological changes that occur after repaired tetralogy of Fallot (rTOF) are not achieved by RV alone and are coupled to a highly compliant low-pressure pulmonary artery (PA) system.6)7) However, RV parameters can provide only limited insight into the complex mechanisms of RV adaptation to chronic volume load after TOF repair.1)2)5)8) The hemodynamic impact of abnormal PA elasticity in patients after TOF repair has not been elucidated.
Pulmonary arterial elastance (Ea) is a lumped measure of the afterload or total stiffness of the arterial system, and a high Ea indicates PA vascular dysfunction. The stroke volume (SV)/end-systolic pressure ratio, known as the Ea, represents a valid estimate of pulsatile afterload in the PA system. The ventricular end-systolic elastance (Ees) is a load-independent parameter of myocardial contractility. The interplay between the heart and vascular system, termed ventricular vascular coupling is a major determinant of cardiovascular performance. It is quantified by the right ventricular-pulmonary arterial coupling ratio (RV-PA coupling ratio) in pulmonary hypertension or rTOF. The RV-PA coupling ratio is an important determinant of RV failure or early physiologic decompensation9).
RV-PA coupling is mathematically expressed as the ratio of Ea to Ees by invasive measurements using conductance catheters and varying loading conditions. It has been suggested the RV functional adaptation to afterload. Recent studies demonstrated feasibility of noninvasive estimation of RV-PA coupling ratio using cardiac magnetic resonance imaging (CMRI).9)
This study was designed to determine whether pulmonary vascular function was associated with RV parameters and exercise capacity. In addition, we also evaluated impact of pulmonary vascular function and RV-PA coupling ratio on RV remodeling outcome after PVR.
METHODS
Ethical statement
The Sejong General Hospital Institutional Review Board approved this study (approval No. 2020-0722).
Patient selection
The records of 227 patients with rTOF who underwent surgical PVR at Sejong General Hospital from 2000 to 2019 were reviewed. Since 2002, we have routinely performed CMRI and/or cardiac catheterization as part of the routine preoperative evaluation for PVR. Patients with rTOF (>18 years) who underwent CMRI and cardiac catheterization within 1year of each other were included. We excluded patients younger than 18 years of age (n=157), those who presenting right ventricular outflow tract (RVOT) obstruction defined as a peak-to-peak gradient >15 mmHg on catheterization (n=6), those with residual ventricular septal defect (n=2), and those who did not undergo CMRI and/or cardiac catheterization before PVR (n=14). A total of 48 patients with rTOF fulfilled the inclusion criteria and were enrolled in the present study.
Study end points
The primary study objective was to determine the association between PA elastance and RV volumetric parameters including pulmonary regurgitation (PR), RV volume index, and RV function.
The secondary study objective was to determine whether Ea and RV volumetric parameters were associated with exercise capacity measured as peak oxygen consumption (peak VO2).
In this study, Ea was calculated using invasively measured RV systolic pressure as the index of RV afterload and noninvasively measured right ventricular stroke volume (RVSV). The CMRI-derived RVSV instead of catheter-derived SV was used to calculate the Ea because it is the current gold standard. Furthermore, we used the RV-PA coupling ratio (end-systolic volume/SV using CMRI) to define the coupling and uncoupling patients. We divided the patients into high Ea (>0.4) and low Ea (≤0.4) groups based on the median Ea of 0.4 mmHg/mL/m2.
Furthermore, to evaluate the impact of pulmonary vascular function (Ea) and RV-PA coupling on RV remodeling outcome after PVR, optimal outcome were defined as normal RV end-diastolic volume index (EDVi; <108 mL/m2), end-systolic volume index (ESVi; <47 mL/m2), and function (ejection fraction [EF] ≥49%) in terms of CMRI parameters.10)11)
Cardiac catheterization
Catheterization was performed12) and cardiac output (CO) was measured using the direct Fick method. The RVSV was determined using the quotient of CO and heart rate. RVSV was indexed to the body surface area. The total pulmonary vascular resistance (Rp) was calculated as the mean pulmonary artery pressure (PAP) divided by CO.
Cardiac magnetic resonance imaging
The protocol for volumetric measurement using CMRI at this institution was previously described.10)13) Briefly, all CMRI studies were performed using a 1.5-T Gyroscan Intera CV system (Philips Medical Systems, Best, The Netherlands). The ventricular end-diastolic and end-systolic volumes, SV, and EF for both ventricles were estimated using the dedicated software. RVSV and EF were calculated from the end-diastolic and end-systolic volumes. All volumetric data were index to the body surface area.
Cardiopulmonary exercise test
Exercise capacity was assessed using cardiopulmonary exercise test (CPET) on a CASE 7 treadmill (GE Medical Systems Information Technologies, Chicago, IL, USA). Patients were encouraged to exercise until their symptoms were intolerable, that is, when the respiratory exchange ratio (RER=VCO2/VO2) reached 1.1. Blood pressure was noninvasively measured every 2 minutes by an automated monitor (Tango M2; SunTech Medical Inc, Durham, NC, USA). Breath-by-breath analysis was performed using VO2, minute ventilation, VCO2, and oxygen saturation on a Quark CPET (COSMED srl, Roma, Italy). The VE/VCO2 slope was determined using the linear regression slopes of the VE and VCO2. The anabolic threshold was chosen as the VO2 at which the respiratory exchange ratio reached 1.0, when there was a sudden and sustained precipitous increase in VCO2 using the V-slope method.
Statistical analysis
Data are presented as mean ± standard deviation, median (interquartile range [IQR]), or proportions as appropriate. Comparisons between paired groups were performed using Student’s t-test, Fisher’s exact test, or the Mann-Whitney test as appropriate. The association between the two continuous variables was assessed using Pearson’s correlation. Independent predictors for optimal RV remodeling outcomes were identified using multivariable binary logistic regression analysis. Variables that achieved a value of p<0.05 in the univariable analysis were entered into the multivariable analysis. Statistical significance was set at p<0.05. All analyses were performed using SPSS version 25 (IBM Corporation, Armonk, NY, USA).
RESULTS
Patient characteristics
A total of 48 patients with rTOF met the inclusion criteria. The demographic data of the 48 patients are summarized in Table 1. Both cardiac catheterization and CMRI were electively required as part of the assessment of preoperative hemodynamics to determine whether to perform PVR. The median time between CMRI and cardiac catheterization was 1.3 months (IQR, 0.1–3.5 months).
Table 1
Patients’ demographic and clinical characteristics (n=48)
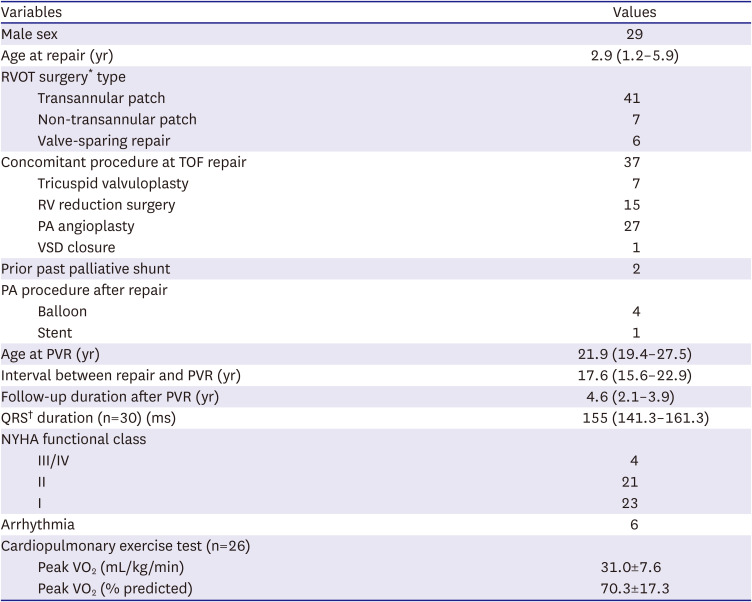
Data are presented as number of patients, median (interquartile range), or mean ± standard deviation as appropriate.
FC = functional class; NYHA = New York Heart Association; PA = pulmonary artery; peak VO2 = peak oxygen consumption; PVR = pulmonary valve replacement; RV = right ventricular; RVOT = right ventricular outflow tract; RVOT = right ventricular outflow tract; TOF = tetralogy of Fallot; VSD = ventricular septal defect.
*RVOT surgery is right ventricular outflow tract procedure †QRS ≥180 ms in 6.7% (2/30) of patients.
Pulmonary arterial elastance and ventricular volumetric parameters
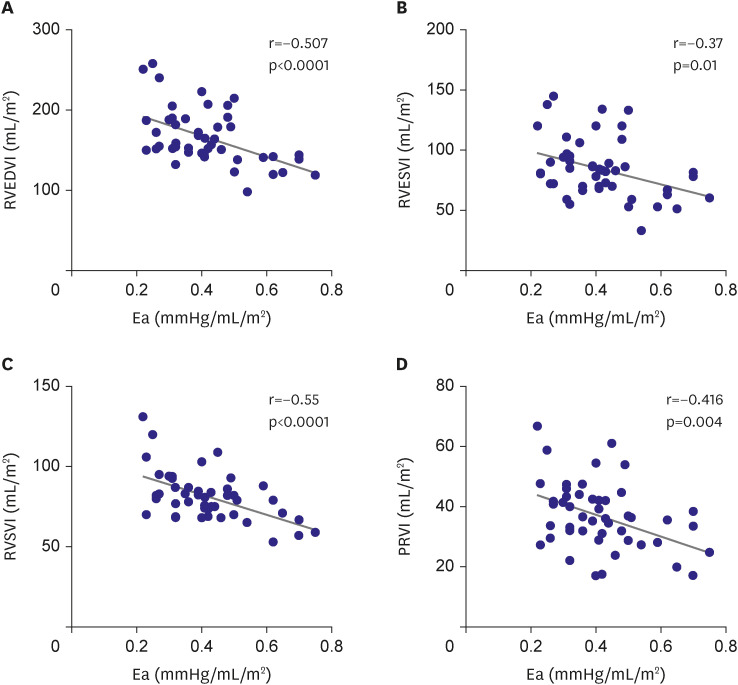
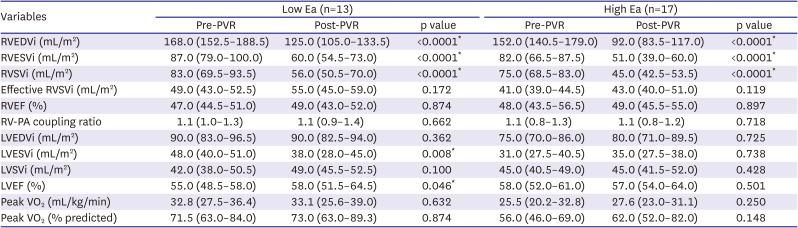
The patients’ hemodynamic and CMRI data are presented Table 2. The patients in the low Ea group (Ea ≤0.4) showed lower mean PAP, mean RV end-systolic pressure, mean left ventricular (LV) end-diastolic pressure (LVEDP), and mean systolic PAP than those in the high Ea group (Ea >0.4) (p=0.002, p<0.0001, p=0.017, and p<0.0001, respectively). In the low Ea group, RVEDVi, RVSV index (RVSVi), and pulmonary regurgitant volume index (PRVi) were significantly greater in patients with a low Ea than in those with a high Ea (p=0.013, p=0.004, and p=0.039, respectively). Furthermore, the low Ea group shows significantly larger LVEDVi and LVESVi than the high Ea group (p=0.002 and p<0.0001, respectively). However, the RVEF and LVEF were not significantly different between the 2 groups (p=0.975 and p=0.09, respectively). There was also no significant intergroup difference in the RV-PA coupling ratio. Ea was inversely correlated with RVEDVi (r=−0.507; p<0.0001), RVESVi (r=−0.37; p=0.01), and RVSVi (r=−0.55; p<0.0001), and PRVi (r=−0.416; p=0.004) (Figure 1).
Table 2
Patient characteristics according to pulmonary vascular function (pulmonary vascular elastance, Ea)
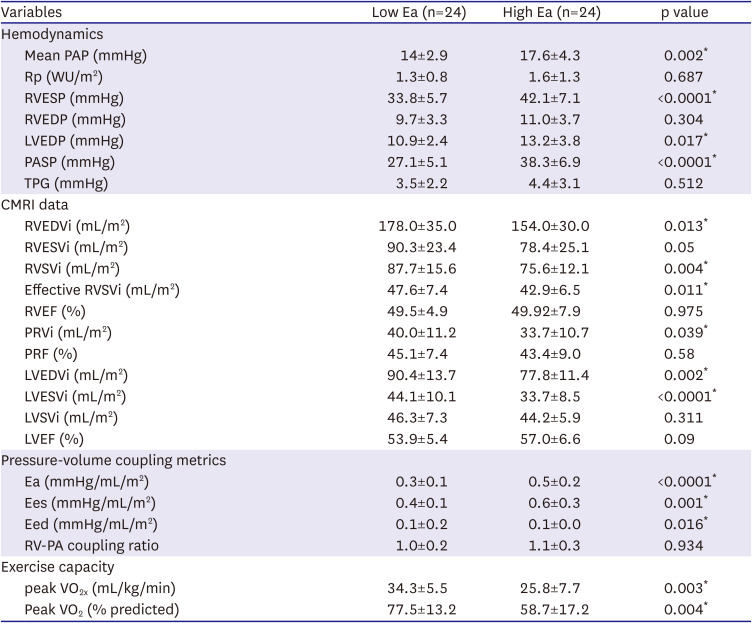
The high Ea (>0.4) and low Ea (≤0.4) groups were defined by the median Ea of 0.4 mmHg/mL/m2. Data are presented as mean±standrd deviation.
CMRI = cardiac magnetic resonance imaging; Ea = pulmonary arterial elastance; Eed = right ventricular end-diastolic elastance (RVEDP/RVEDV); Ees = right ventricular end-systolic elastance (RVSP/RVESV); LVEDP = ventricular end-diastolic pressure; LVEDVi = ventricular end-diastolic volume index; LVEF = left ventricular ejection fraction; LVESVi = left ventricular end-systolic pressure; LVSVi = left ventricular stroke volume index; PAP = pulmonary artery pressure; PASP = pulmonary artery systolic pressure; peak VO2 = peak oxygen consumption; PRF = pulmonary regurgitation fraction; PRVi = pulmonary regurgitant volume index; Rp = pulmonary vascular resistance; RVEDP = right ventricular end-diastolic pressure; RVEDVi = right ventricular end-diastolic volume index; RVEF = right ventricular ejection fracaction; RVESP = right ventricular end-systolic pressure; RVESVi = right ventricular end-systolic volume index; RV-PA coupling ratio = right ventricular pulmanry arterial coupling ratio ; RVSVi = right ventricular stroke volume index; TPG = transpulmonary pressure gradient.
*p<0.05.
Figure 1
Correlation between pulmonary Ea and right ventricular volumetric indices. The Ea is negatively correlated with PRVi (r=−0.416, p=004), RVEDVi (r=−0.507, p<0.0001), RVESVi (r=−0.37, p=0.01), and RVSVi (r=−0.55, p<0.0001).
Ea = arterial elastance; PRVi = pulmonary regurgitant volume index; RVEDVi = right ventricular end-diastolic volume index; RVESVi = right ventricular end-systolic volume index; RVSVi = right ventricular stroke volume index.
Pulmonary arterial elastance and exercise capacity
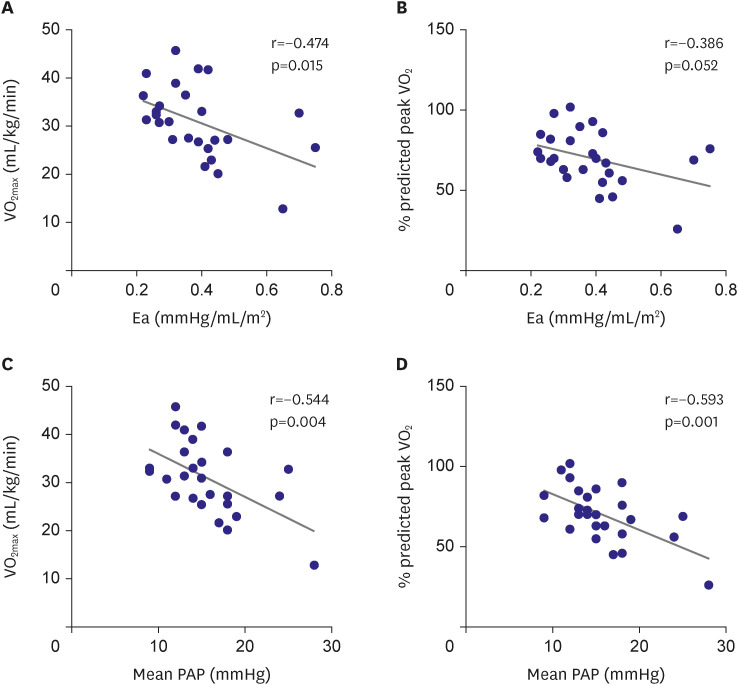
In the low Ea group, the maximal oxygen consumption (VO2max) was significantly greater than that in the high Ea group (34.3±5.5 mL/kg/min vs. 25.8±7.7 mL/kg/min, p=0.003). These differences were significant even after adjusting for age and sex (% predicted VO2max: 77.5±13.2% vs. 58.7±17.2%, p=0.007). A lower Ea was associated with a higher VO2 max (r=−0.474, p=0.015) and % predicted VO2 max (r=−0.386, p=0.052) (Figure 2A and B). Lower mean PAP was also associated with higher VO2max (r=-0.544, p=0.004) and % predicted VO2 max (r=−0.593, p=0.001) (Figure 2C and D). However, exercise capacity showed a poor correlation with PRVi, RVEDVi, RVEF, LVEF, and RV-PA coupling ratio.
Figure 2
Correlation between exercise capacity and several variables. (A) Pulmonary Ea had a negative correlation with VO2max (r=−0.474, p=0.015). (B) Ea did not have significant correlation with % predicted peak VO2 (r=−0.386, p=0.052). (C) Mean PAP exhibit a negative correlation with VO2max (r=−0.544, p=0.004) and (D) % predicted peak VO2 (r=−0.593, p=0.001).
Ea = arterial elastance; PAP =pulmonary artery pressure; peak VO2 = peak oxygen consumption; VO2max = maximal oxygen consumption.
Impact of arterial elastance and right ventricular-pulmonary arterial coupling ratio on right ventricular remodeling after pulmonary valve replacement
CMRI was repeated after surgical PVR in 30 patients (Table 3). We noted a decrease in the RVEDVi, RVESVi, and RVSVi after PVR in both groups. However, no changes of RVEF, RV-PA coupling ratio, and exercise capacity were documented after PVR in the groups. Only low Ea group showed change in LVESVi and LVEF after PVR.
Table 3
Changes in RV parameters and exercise capacity after PVR in 2 group (n=30)
The high Ea (>0.4) and low Ea (≤0.4) groups were defined by the median Ea of 0.4 mmHg/mL/m2. Data are presented as the median (interquartile range).
Ea = arterial elastance; LVEDVi = left ventricular end-diastolic volume index; LVEF = left ventricular ejection fraction; LVESVi = left ventricular end-systolic volume index; LVSVi = left ventricular stroke volume index; PVR = pulmonary valve replacement; RV = right ventricle; RVEDVi = right ventricle end-diastolic volume index; RVEF = right ventricle ejection reaction; RVESVi = right ventricle end-systolic volume index; RV-PA coupling ratio = right ventricular-pulmonary arterial coupling ratio; RVSVi = right ventricular stroke volume index; peak VO2 = peak oxygen consumption.
*p<0.05.
Table 4 summarizes the comparison of preoperative data between the patients with optimal and suboptimal RV remodeling after PVR. Patients with suboptimal RV recovery after PVR showed significantly larger RVESVi, lower RVEF, larger LVEDVi, and larger LVESVi preoperatively (p=0.008, p=0.008, p=0.007, and p=0.001, respectively). Furthermore, they showed significantly lower Ees (p=0.007) and a higher RV-PA coupling ratio (p=0.012), suggesting RV-PA uncoupling.
Table 4
Preoperative data for right ventricular remodeling after pulmonary valve replacement (n=30)
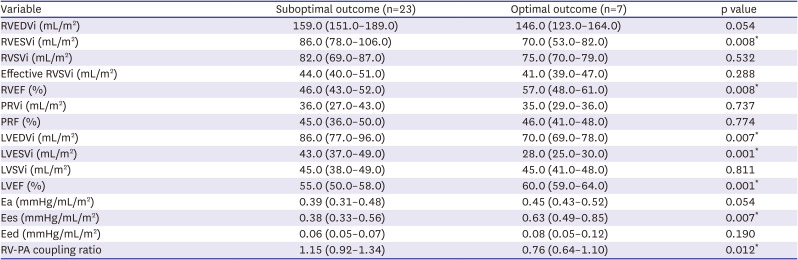
Data are presented as the median (interquartile range).
Ea =pulmonary arterial elastance; Eed =right ventricular end-diastolic elastance (RVEDP/RVEDV); Ees =right ventricular end-systolic elastance (RVSP/RVESV); LVEDVi = left ventricular end-diastolic volume index; LVEF = left ventricular ejection reaction; LVESVi left ventricular end-systolic volume index; LVSVi = left ventricular stroke volume index; PRF = pulmonary regurgitation fraction; PRVi = pulmonary regurgitant volume index; PVR = pulmonary valve replacement; RVEDVi = right ventricular end-diastolic volume index; RVEF = right ventricular ejection fraction; RVESVi = right ventricular end-systolic volume index; RV-PA coupling ratio = right ventricular-pulmonary arterial coupling ratio; RVSVi = right ventricular stroke volume index.
*p<0.05.
In univariate analysis, higher preoperative RV volume (RVEDVi and RVESVi), LVESVi, and higher RV-PA coupling ratio were identified as risk factors for suboptimal outcomes related to RV remodeling. In the multivariable analysis, preoperative RVESVi was identified as the sole independent risk factor for suboptimal outcomes (Supplementary Tables 1 and 2).
DISCUSSION
We demonstrated that low Ea was related to more severe PR and increased RV volume in patients with rTOF in the absence of significant RVOT obstruction. Furthermore, we speculate that patients with a low Ea eventually have a larger LV volume while maintaining a greater effective RVSV, representing the LV preload. Those studies suggest a seemingly paradoxical augmentation of left ventricular stroke volume (LVSV) in the setting of severe RV dilatation and chronic PR. The mechanisms for our observation of increased PR, RV volume, effective RVSV, and hence increased LV preload and LV volumes in the presence of low Ea, remain to be determined.
Our findings are inconsistent with those of a previous study.14) Inuzuka et al.14) reported that the presence of increased pulmonary arterial stiffness could be related to reduced RV ejection and RV enlargement in patients with rTOF. In contrast to our study, they included several patients with significant PA stenosis (48% of total subject), which could have resulted in more substantial RV dilatation and dysfunction. To evaluate the effects of pure pulmonary vascular function, we excluded patients with clinically significant RVOT obstruction, which is pressure loading to RV. It is presumed to underlie the observed difference.
We demonstrated that patients with high Ea had a lower exercise capacity than those with a low Ea. Peak aerobic exercise capacity was negatively correlated with Ea and mean PA pressure (p=0.004; Figure 2). Ea is a measure of RV afterload, which is the total pressure load on the RV in each cardiac cycle. It is a composite of the pressure load from the RVOT obstruction, PA vascular function, Rp, and left heart filling pressure. PA vascular dysfunction may contribute to exercise intolerance in rTOF.15) High Ea has been reported to be an independent risk factor for exercise intolerance, heart failure, and mortality in patients with acquired heart disease.16)17)18)
CMRI and CPET are two important tools that are often used by clinicians to help guide decision regarding PVR. CPET may reveal decreased pulmonary vascular distensibility and RV dysfunction as the causes of impaired exercise capacity. However, the relationship between the CMRI parameters and actual exercise capacity remains unclear.
In our study group of rTOF with low RV pressure, peak aerobic exercise capacity did not correlated with RV volume or PR severity. In previous studies, the association between exercise capacity and RV volumetric data after repair of TOF has been debatable.19)20)21)22) This could be attributed to a seemingly paradoxical augmentation of LVSV in the setting severe PR and large RV volume. In the setting of PA vascular dysfunction, blunted PA vasodilation during exercise results in a higher RV afterload for a given change in pulmonary blood flow.16)17)18) Our results suggest that PA vascular dysfunction with a high Ea may contribute to exercise intolerance in this population.
However, the situation in patients with TOF is more complex. A highly compliant PA system (low Ea) reduces RV afterload. In the absence of a functional pulmonary valve, it exacerbates PR owing to the elastic recoil of the PA during early diastole.7)23) When longstanding severe PR is present after TOF repair, the absolute SV is increased to maintain sufficient cardiac output. In addition, patients with severe RV dilatation and severe PR show the finding of increased effective RVSVi and LV volume. It may provide an explanation for the apparent lack of influence of RV volume on exercise capacity.
Here, we noted no change in RV function, effective RVSVi, or exercise capacity in either groups analyzed before and after PVR. Patients with low Ea exhibited significantly changed LVESVi and LVEF after PVR (Table 3). In rTOF with severe PR and large RV volume, it is speculated that pre-PVR preservation of effective RVSVi and LVSV index may contribute to this lack of change in aerobic capacity.
In our study group, PR is mainly influeced by Ea with a result of significant inverse correlation between Ea and PR severity. The RV contractility in these patients increased to match the increased load and maintain the SV and optimal RV-PA coupling ratio at the cost of suboptimal mechanical efficiency.6 The RV failing as a pump (decreased Ees) and a greater increase in RV-PA coupling ratio indicates insufficient coupling and reduced myocardial efficiency.
In our study, some patients showed RV-PA uncoupling and impaired RVEF, indicating a maladaptive response of the PA system to chronic volume overload. These patients failed to recover even after PVR, suggesting irreversible and maladaptive changes. Surgical therapy for TOF repair includes ventriculotomy, commonly combined with the implantation of a transannular patch, which may be related to a maladaptive response to an increased SV with a subsequent increase in RV pulsatile load.
Maughan and colleagues24) analyzed ventricular-arterial interactions using the ventricular pressure-volume relationship by defining the ventricle and arterial system as 2 elastic chambers. Ventricular-arterial coupling is estimated from the Ea/Ees ratio.23) It has been demonstrated that normal RV functional adaptation to afterload is associated with the maintenance of an Ea/Ees ratio of approximately 0.5.24)25)26)27)28)29) Optimal right RV-PA coupling (ratio=1) occurs when the ventricle and arterial system have equal elastances, thereby maximizing energy transfer and stroke work. Unfavorable coupling between the RV and PA system with ineffective mechanical work production occurs when the RV-PA coupling ratio increases by more than 1, which is known as uncoupling.6) The uncoupling between the ventricular and vascular properties is an important determinant in the development of RV failure and was recently reported in pulmonary hypertension.26) Furthermore, the increased RV-PA coupling ratio is considered a deciding factor in RV dysfunction progression and has been reported in postoperative TOF patients. However, the level of RV-PA uncoupling at which RV failure occurs is unknown.
This study has several limitations. First, it was a small-sample retrospective study of patients with rTOF and chronic PR. The retrospective nature of our study did not allow us to collect data on exercise habits and behavior, which may be significant in this group. Given the retrospective design, CMRI was not performed simultaneously at the time of cardiac catheterization, and the change in loading condition is a potential confounder. However, we included patients who underwent both CMRI and cardiac catheterization at minimal intervals. Furthermore, our study was performed at a single center with relatively few patients. Finally, most patients had a near-normal exercise capacity, which limits the extrapolation of our findings to TOF patients with end-stage symptoms. This could have inadvertently introduced bias and affected the generalizability of our results.
In conclusion, we found that PA vascular dysfunction, presenting as elevated Ea in TOF, may contribute to exercise intolerance. However, high Ea may prevent PR, RV dilatation, and LV dilatation in the absence of significant RVOT obstruction. Conversely, highly compliant pulmonary arteries (low Ea) exaggerate PR and RV dilatation. The clinical significance of Ea in rTOF is complex. In patient with rTOF, CPET data should be interpreted carefully. Although Ea is important for RV volume change preoperatively, multivariant analysis indicates that it is not a factor to remodling post-PVR remodeling. Furthermore, in addition to preoperative RV volume, our study showed that the RV-PA coupling ratio, which reflects the adaptive response of the PA system to chronic volume load, contributes to optimal postoperative results.
 XML Download