

 PDF
PDF Citation
 Print
Print


INTRODUCTION
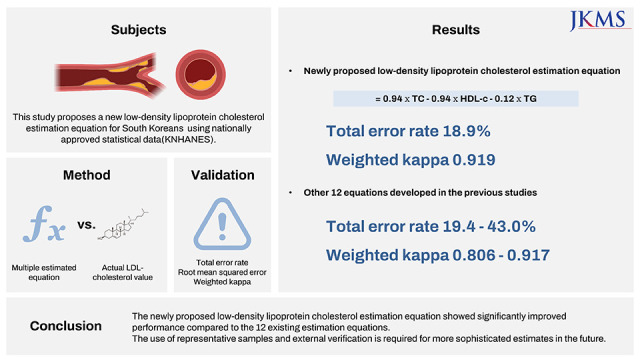
An increase in low-density lipoprotein cholesterol (LDL-c) has been found to be a significant risk factor for the development of cardiovascular disease,12 making the accurate measurement of LDL-c values important. LDL-c values can be obtained via direct and calculation measurement methods. For direct measurement of LDL-c, lipid ultracentrifugation (beta-quantification procedure) is generally used, which is inefficient in terms of additional cost and time consumption.345 From this point of view, most clinical sites estimate LDL-c values using calculation methods, particularly the Friedewald equation developed in 1972.6
Researchers have highlighted several problems with the Friedewald equation in its current form. First, the Friedewald equation becomes inaccurate as triglyceride (TG) values increase above 200 mg/dL, becomes invalid when they exceed 400 mg/dL,5 and the result is relatively inaccurate when LDL-c values are below 70 mg/dL.78 Additionally, LDL-c estimates calculated by the Friedewald equation generally underestimate actual LDL-c values.89 Accordingly, various equations for indirectly calculating LDL-c have been developed. However, there are still limitations in applying the new equations to South Koreans. Since most of the equations were not designed for South Koreans, a race bias may exist. Compared to Westerners, South Koreans have relatively low total cholesterol (TC), LDL-c, and high-density lipoprotein cholesterol (HDL-c) levels and are known to have high TG.10 Therefore, bias may occur if an estimation formula developed in Western countries is generalized to South Koreans. Interestingly, a relevant study conducted in Japan, which is geographically close to South Korea, proposed a Japanese-specific equation.11
In relevant studies conducted in South Korea, new equations, such as the Martin equation and the Sampson equation, having been found to be superior to the existing Friedewald equation, have been applied to South Koreans.101213 However, few studies have set out to develop LDL-c equations specifically for South Koreans. Recently, Choi et al.5 developed a new LDL-c equation based on the cohort data of the Green Cross Research Institute and tested it using data from the Korea National Health and Nutrition Examination Survey (KNHANES). Their study reported that the newly developed equation was more accurate than 11 other existing equations. However, there is a limitation in that the effort to avoid overfitting was insufficient.
Recently, AI-based predictive models have drawn attention in various fields, and machine learning and deep learning methods are being actively used in the development of LDL-c estimation models.141516 AI-based prediction models additionally consider invisible characteristics between variables and generally perform better than existing equations.17 Therefore, we aimed to develop a custom LDL-c equation model and AI-based prediction model for South Koreans using the KNHANES data. The predicted values from the newly developed equation and estimation model were compared with predicted values calculated from several previously developed equations and directly measured LDL-c values to evaluate their accuracy.
METHODS
Study population and design
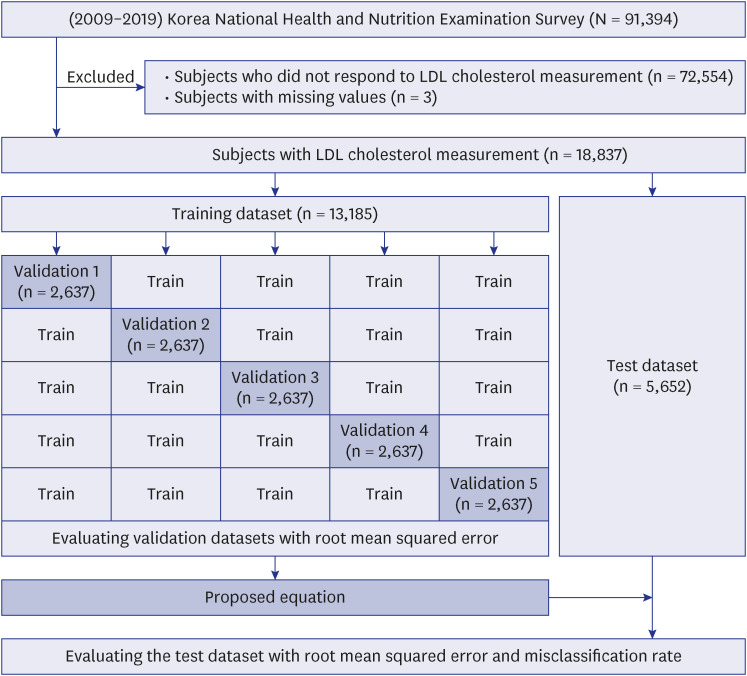
This study was based on KNHANES data from 2009 to 2019. The National Health and Nutrition Examination Survey is a nationwide cross-sectional survey conducted by the Korea Centers for Disease Control and Prevention to evaluate the health and nutritional status of Koreans. Details on the survey have been published elsewhere.12 The subjects of this study included individuals who had their LDL-c levels directly measured among those who had HDL-c, TG, and TC measured, which are variables of the Friedewald LDL estimation formula (N = 18,837). Considering that only one database was used, the results were derived and compared using five-fold cross-validation (Fig. 1).
A formula for estimating LDL-c was developed through 12 previous studies,1819202122232425 and the new equation was developed using the National Health and Nutrition Examination Survey dataset (Table 1). In KNHANES data, lipid profiles (TC and TG), HDL-c, and LDL-c were measured using the enzymatic method with a Hitachi Automatic Analyzer 7600 (Hitachi, Tokyo, Japan) in 2009–2012 and Labospect008AS (Hitachi) in 2019. From 2013 to 2018, using the Hitachi Automatic Analyzer 7600-210 (Hitachi), lipid profiles were measured by the enzymatic method, and HDL-c and LDL-c were measured by the homogeneous enzymatic colorimetric method. The new equation was developed using the parameters of TC, HDL-c, and TG and multiple regression analysis from the KNHANES data.
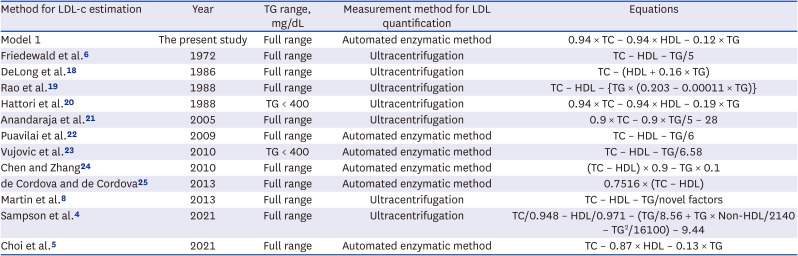
Table 1
Characteristics of the 13 equations for calculating LDL-c
| Method for LDL-c estimation | Year | TG range, mg/dL | Measurement method for LDL quantification | Equations |
|---|---|---|---|---|
| Model 1 | The present study | Full range | Automated enzymatic method | 0.94 × TC – 0.94 × HDL – 0.12 × TG |
| Friedewald et al.6 | 1972 | Full range | Ultracentrifugation | TC – HDL – TG/5 |
| DeLong et al.18 | 1986 | Full range | Ultracentrifugation | TC – (HDL + 0.16 × TG) |
| Rao et al.19 | 1988 | Full range | Ultracentrifugation | TC – HDL – {TG × (0.203 – 0.00011 × TG)} |
| Hattori et al.20 | 1988 | TG < 400 | Ultracentrifugation | 0.94 × TC – 0.94 × HDL – 0.19 × TG |
| Anandaraja et al.21 | 2005 | Full range | Ultracentrifugation | 0.9 × TC – 0.9 × TG/5 – 28 |
| Puavilai et al.22 | 2009 | Full range | Automated enzymatic method | TC – HDL – TG/6 |
| Vujovic et al.23 | 2010 | TG < 400 | Automated enzymatic method | TC – HDL – TG/6.58 |
| Chen and Zhang24 | 2010 | Full range | Automated enzymatic method | (TC – HDL) × 0.9 – TG × 0.1 |
| de Cordova and de Cordova25 | 2013 | Full range | Automated enzymatic method | 0.7516 × (TC – HDL) |
| Martin et al.8 | 2013 | Full range | Ultracentrifugation | TC – HDL – TG/novel factors |
| Sampson et al.4 | 2021 | Full range | Ultracentrifugation | TC/0.948 – HDL/0.971 – (TG/8.56 + TG × Non-HDL/2140 – TG2/16100) – 9.44 |
| Choi et al.5 | 2021 | Full range | Automated enzymatic method | TC – 0.87 × HDL – 0.13 × TG |
LDL-c = low-density lipoprotein cholesterol, TG = triglycerides, TC = total cholesterol, HDL = high-density lipoprotein.
![]()
The primary process in formula development was to derive a simple formula like Friedewald that could be easily used in clinical practice. In addition, optimal β1, β2, and β3 values were derived by minimizing error from a straight line or curve obtained from the actual data using the least squares method. For development and validation, the dataset was randomly divided into a training set (70%) and a test set (30%), and five-fold cross-validation was performed to optimize the prediction model. In addition, overfitting was prevented by repeatedly checking the root mean squared error (RMSE) index values of the training and test sets.
Since the development of an estimation formula alone can introduce bias of good performance for a particular dataset, the results between the prediction model using the machine learning method and the estimation formula were also compared. Among tree-based ensemble methods, XGBoost is one of supervised learning that can perform classification and regression tasks because learning and computation are fast using parallel processing, and XGBoost has its own overfitting regulation function, which enables high-level optimization.26 This was used as a comparative model, and the optimal hyperparameter was found using a grid search to derive high predictive power.
Statistical analysis
The distribution of variables used to develop the LDL estimation formula for Koreans was confirmed as number (%) for categorical variables and median (interquartile range) for continuous variables. To evaluate the error between actual LDL values and estimated LDL values, RMSE was used for comparison and R2 was confirmed using a scatter plot and a regression line (Supplementary Fig. 1). To verify that the estimated formula can be used in clinical practice, estimated LDL values according to the six NCEP ATP III categories (LDL-c levels: 1) < 70 mg/dL, 2) 70–99 mg/dL, 3) 100–129 mg/dL, 4) 130–159 mg/dL, 5) 160–189 mg/dL, and 6) ≥ 190 mg/dL) and the degree of misclassification according to the actual LDL category was assessed. Weighted kappa coefficients using the Fleiss-Cohen method were used in the analysis to confirm agreement.27 SAS 9.4 (SAS., Cary, NC, USA) was used to calculate basic statistics, and Python 3.7.6 (pandas, NumPy, scikit-learn, matplotlib packages, XGBoost) was used to develop the equation and evaluate the results.
RESULTS
The baseline characteristics and lipid profiles of the subjects are described in Table 2. The total number of subjects was 18,837, totaling 13,185 (70.00%) in the training dataset and 5,652 (30.00%) in the test dataset. Overall, 52.38% were male, and 47.62% were female.
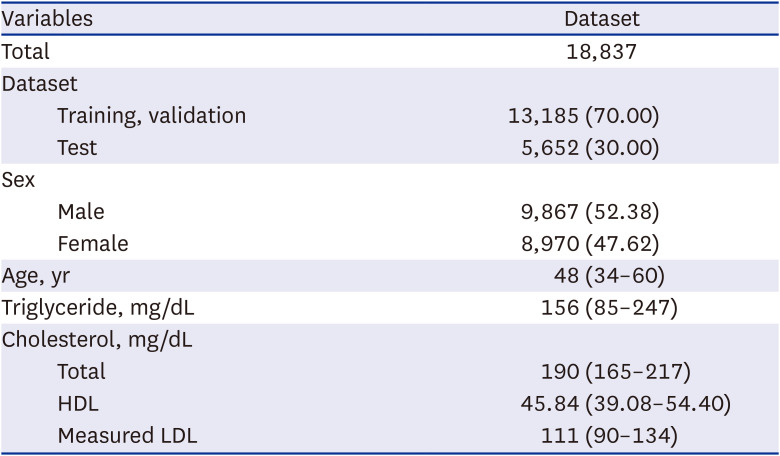
Table 2
Baseline characteristics of the study datasets
Values are presented as number (%) or median (interquartile range).
HDL = high-density lipoprotein, LDL = low-density lipoprotein.
![]()
The estimation equations developed using previously proposed estimation equations and using the dataset divided according to five-fold cross-validation were compared using RMSE values (Table 3). When TG levels were less than 400 mg/dL, the RMSE value of the model 1 (CV1: 7.97; CV2: 8.04; CV3: 8.13; CV4: 8.14; CV5: 8.04) showed the lowest result, and the equation derived from CV1 was used as the final equation. In addition, we confirmed that the error was lowest at 7.97 when compared with actual LDL values in the test dataset using the derived formula. Even when comparing the results of the model 1 with RMSE values (CV1: 7.94; CV2: 7.83; CV3: 7.95; CV4: 8.02; CV5: 7.91) of the model 2 (XGBoost), which underwent a complex calculation process, RMSE values showed no significant difference. Additionally, the scatter plot results were compared when TG levels were less than 400 mg/dL and when there was no range limitation (Supplementary Fig. 1). When the TG levels were less than 400 mg/dL, the new equation showed the strongest linearity (R2 = 0.94), compared to other estimation equations. In the full range results, the coefficient of determination of the Sampson equation, which has an advantage when TG levels increase, was 0.91. The coefficient of determination of the model 1 was 0.90, and the model 2 was the highest at 0.93.
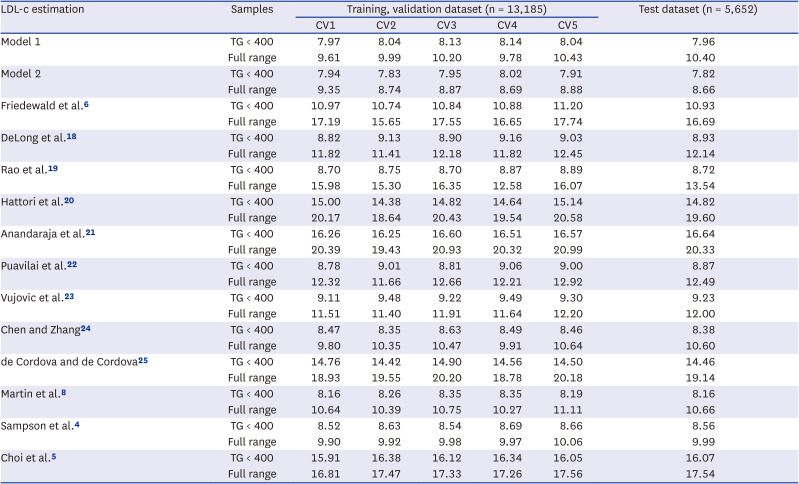
Table 3
Comparison of root mean squared error values between measured LDL-c and estimated LDL-c levels
| LDL-c estimation | Samples | Training, validation dataset (n = 13,185) | Test dataset (n = 5,652) | ||||
|---|---|---|---|---|---|---|---|
| CV1 | CV2 | CV3 | CV4 | CV5 | |||
| Model 1 | TG < 400 | 7.97 | 8.04 | 8.13 | 8.14 | 8.04 | 7.96 |
| Full range | 9.61 | 9.99 | 10.20 | 9.78 | 10.43 | 10.40 | |
| Model 2 | TG < 400 | 7.94 | 7.83 | 7.95 | 8.02 | 7.91 | 7.82 |
| Full range | 9.35 | 8.74 | 8.87 | 8.69 | 8.88 | 8.66 | |
| Friedewald et al.6 | TG < 400 | 10.97 | 10.74 | 10.84 | 10.88 | 11.20 | 10.93 |
| Full range | 17.19 | 15.65 | 17.55 | 16.65 | 17.74 | 16.69 | |
| DeLong et al.18 | TG < 400 | 8.82 | 9.13 | 8.90 | 9.16 | 9.03 | 8.93 |
| Full range | 11.82 | 11.41 | 12.18 | 11.82 | 12.45 | 12.14 | |
| Rao et al.19 | TG < 400 | 8.70 | 8.75 | 8.70 | 8.87 | 8.89 | 8.72 |
| Full range | 15.98 | 15.30 | 16.35 | 12.58 | 16.07 | 13.54 | |
| Hattori et al.20 | TG < 400 | 15.00 | 14.38 | 14.82 | 14.64 | 15.14 | 14.82 |
| Full range | 20.17 | 18.64 | 20.43 | 19.54 | 20.58 | 19.60 | |
| Anandaraja et al.21 | TG < 400 | 16.26 | 16.25 | 16.60 | 16.51 | 16.57 | 16.64 |
| Full range | 20.39 | 19.43 | 20.93 | 20.32 | 20.99 | 20.33 | |
| Puavilai et al.22 | TG < 400 | 8.78 | 9.01 | 8.81 | 9.06 | 9.00 | 8.87 |
| Full range | 12.32 | 11.66 | 12.66 | 12.21 | 12.92 | 12.49 | |
| Vujovic et al.23 | TG < 400 | 9.11 | 9.48 | 9.22 | 9.49 | 9.30 | 9.23 |
| Full range | 11.51 | 11.40 | 11.91 | 11.64 | 12.20 | 12.00 | |
| Chen and Zhang24 | TG < 400 | 8.47 | 8.35 | 8.63 | 8.49 | 8.46 | 8.38 |
| Full range | 9.80 | 10.35 | 10.47 | 9.91 | 10.64 | 10.60 | |
| de Cordova and de Cordova25 | TG < 400 | 14.76 | 14.42 | 14.90 | 14.56 | 14.50 | 14.46 |
| Full range | 18.93 | 19.55 | 20.20 | 18.78 | 20.18 | 19.14 | |
| Martin et al.8 | TG < 400 | 8.16 | 8.26 | 8.35 | 8.35 | 8.19 | 8.16 |
| Full range | 10.64 | 10.39 | 10.75 | 10.27 | 11.11 | 10.66 | |
| Sampson et al.4 | TG < 400 | 8.52 | 8.63 | 8.54 | 8.69 | 8.66 | 8.56 |
| Full range | 9.90 | 9.92 | 9.98 | 9.97 | 10.06 | 9.99 | |
| Choi et al.5 | TG < 400 | 15.91 | 16.38 | 16.12 | 16.34 | 16.05 | 16.07 |
| Full range | 16.81 | 17.47 | 17.33 | 17.26 | 17.56 | 17.54 | |
TG < 400 samples were obtained from 2,474 individuals in cv1-cv5, respectively.
LDL-c = low-density lipoprotein cholesterol, CV = cross validation, TG = triglycerides.
![]()
Fig. 2 confirms the degree of misclassification and agreement according to six NCEP ATP III categories when TG levels were less than 400 mg/dL for the estimated LDL values. The misclassification rate was calculated using a confusion matrix derived from the test dataset (Supplementary Fig. 2), and the degree of concordance was derived using weighted kappa (SE). The misclassification rate of the Sampson equation was 20.7%, the developed equation by Choi in Korea was 43.0%, that of the Martin equation was 19.4%, and that of the model 1 was 18.9%, which was the lowest. The model 1 greatly reduced the tendency of the Friedewald equation to be underestimated and showed a lower misclassification rate than the model 2.
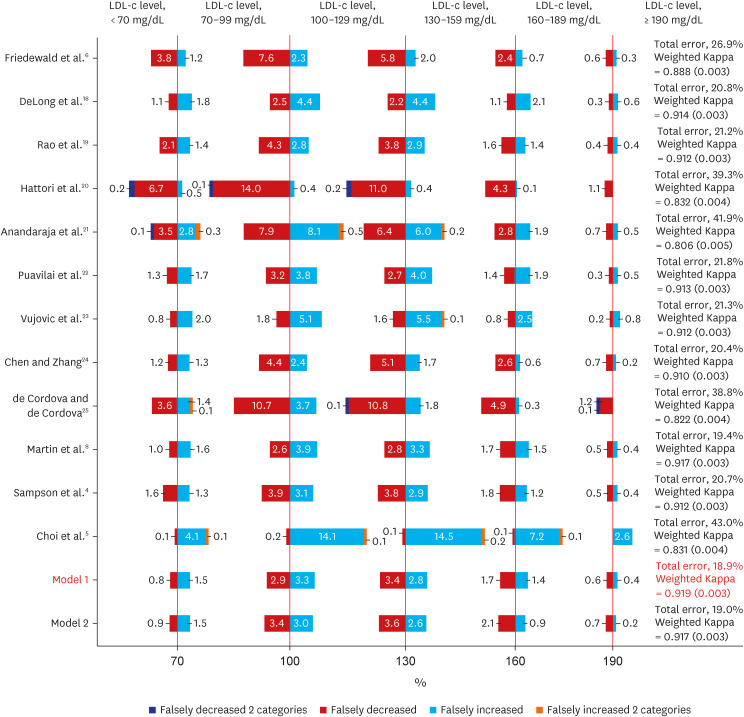
Table 4 and Fig. 3 compare the RMSE between the predicted and actual values according to the TG level. As a result of the model 1 and the model 2, the RMSE value also tended to increase as the TG level increased, but the RMSE was the lowest at ten or less. The RMSE of the Martin equation was almost similar to the model 1 until the TG level was less than 200. However, when the TG level was 200 or higher, the RMSE value exceeded ten and significantly increased compared to the model 1.
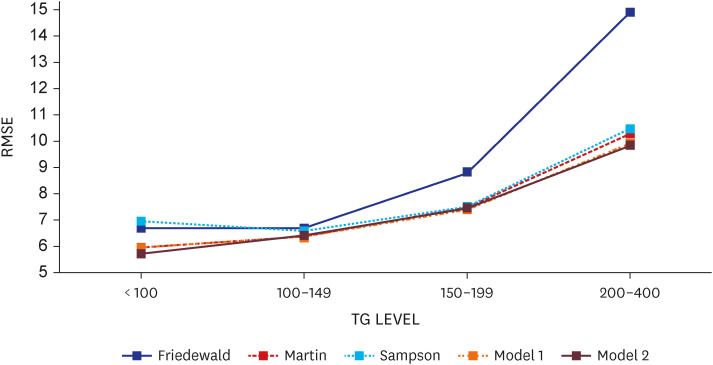
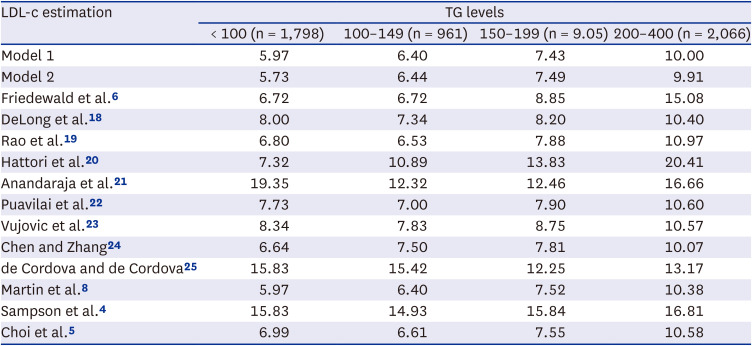
Fig. 3
Comparison of RMSE values between measured LDL-c and estimated LDL-c levels according to TG levels (TG level < 400 mg/dL).
RMSE = root mean squared error, LDL-c = low-density lipoprotein cholesterol, TG = triglycerides.
![]()
Table 4
Comparison of root mean squared error values between measured LDL-c and estimated LDL-c levels according to TG levels (TG level < 400 mg/dL)
| LDL-c estimation | TG levels | |||
|---|---|---|---|---|
| < 100 (n = 1,798) | 100–149 (n = 961) | 150–199 (n = 9.05) | 200–400 (n = 2,066) | |
| Model 1 | 5.97 | 6.40 | 7.43 | 10.00 |
| Model 2 | 5.73 | 6.44 | 7.49 | 9.91 |
| Friedewald et al.6 | 6.72 | 6.72 | 8.85 | 15.08 |
| DeLong et al.18 | 8.00 | 7.34 | 8.20 | 10.40 |
| Rao et al.19 | 6.80 | 6.53 | 7.88 | 10.97 |
| Hattori et al.20 | 7.32 | 10.89 | 13.83 | 20.41 |
| Anandaraja et al.21 | 19.35 | 12.32 | 12.46 | 16.66 |
| Puavilai et al.22 | 7.73 | 7.00 | 7.90 | 10.60 |
| Vujovic et al.23 | 8.34 | 7.83 | 8.75 | 10.57 |
| Chen and Zhang24 | 6.64 | 7.50 | 7.81 | 10.07 |
| de Cordova and de Cordova25 | 15.83 | 15.42 | 12.25 | 13.17 |
| Martin et al.8 | 5.97 | 6.40 | 7.52 | 10.38 |
| Sampson et al.4 | 15.83 | 14.93 | 15.84 | 16.81 |
| Choi et al.5 | 6.99 | 6.61 | 7.55 | 10.58 |
![]()
DISCUSSION
We developed a customized LDL-c equation for Koreans based on TC, HDL-c, and TG values using KNHANES data. To verify the consistency and accuracy of the newly developed equation, we compared measured LDL-c values and values predicted from a total of 12 previously developed equations. The LDL-c predicted values calculated from the equations were compared with the directly measured LDL-c value through R2, RMSE, and scatter plots, and the degree of misclassification in LDL-c category classification according to the NCEP ATP III standard was also checked. In this process, a machine learning model using XGBoost was also compared. Our results confirmed that the newly developed LDL-c equation shows superior or at least equivalent performance relative to other previously developed equations and the XGBoost model.
Comparing the Friedewald equation, which is currently most used in clinical practice, with our new equation, we found that the performance of the equation developed by this research was superior in estimating LDL-c values for Koreans. Like previous studies,89 we noted that LDL-c estimates calculated by the Friedewald equation tended to underestimate actual LDL-c values overall. In this study, predicted values from the Friedewald equation were underestimated by 20.2% and overestimated by 6.5% in classification according to the NCEP ATP III standard. The new equation showed values of 9.4% and 9.4%, respectively. Although there were a few cases of overestimation in the new estimation formula, it is more meaningful to reduce underestimation, which can lead to undertreatment for high-risk patients,28 in terms of conservative clinical judgment.
Among the previously developed equations, the one with the most similar performance to the new equation was the Martin equation. In previous studies conducted in Korea, the Martin equation has been proven to show superior performance over other estimation equations, such as the Friedewald equation.101213 Lee et al.13 reported that the Martin equation tends to relatively overestimate LDL-c values, and our study also showed similar results. The key strength of the Martin equation would be the ratio of TG to very low-density lipoprotein cholesterol (VLDL-c) values classified into 180 cells according to levels of TG and non-HDL-c. In this study, the Martin equation had a high misclassification rate with a slight difference compared to the new equation, but there were relatively few underestimations and many overestimations. This point can be seen as a strength of the Martin equation, which was able to classify median values of the ratio of TG to VLDL-c values through a large sample. Since the median value of the ratio of TG to VLDL-c in Koreans is significantly different from the value suggested by Martin et al.,28 if additional research with a large sample is conducted, it will be possible to develop an equation that is more suitable for Koreans.
The limitations of this study are as follows. First, external verification using data other than KNHANES data could not be conducted. Although we used five-fold cross-validation to prevent overfitting as much as possible, there is still a limitation with the absence of external validation. It is necessary to supplement this part by using more data, such as clinical data from hospitals, in the future. However, the possibility of bias due to overfitting to unrepresentative data is expected to be low, considering that the model developed in the previous study using the same data as our study maintained excellent performance during external verification.17
Second, there is a limitation in the data of the KNHANES itself. Although KNHANES uses a multi-stage stratified cluster sampling approach to ensure representative data, the methods (Supplementary Data 1) for selecting people with direct LDL-c measurements selected as subjects in this study varied by year.29 In addition, it did not consider the administration of lipid-lowering drugs, such as statins and ezetimibe, which may affect differences in the accuracy of measured and estimated values or whether there was any preceding disease, such as hypertension, diabetes, or cardiovascular disease. Moreover, in general, it is necessary to fast for body blood tests in the KNHANES; therefore, the lipid test is conducted with most of the survey subjects maintaining a fasting state for more than 8 hours.30 This strays from the global trend in which non-fasting tests are being increasingly recommended.3132 For more accurate research, research using data that can compensate for these limitations should be conducted.
One study reported misclassification rates of estimating LDL-c using the Friedewald equation and Martin equation for US residents of 14.6% and 8.3%, respectively.8 Another study reported misclassification rates for the Friedewald, Martin, and Sampson equations of 12.6%, 11.0%, and 10.4%, respectively, in patients at the National Institutes of Health Clinical Center in the United States.4 The fact that the misclassification rates of previous studies are significantly lower than the results of this study suggests that the equation developed in this study does not fully satisfy the function of being customized for Koreans. For example, the Choi equation is an estimation equation developed for Koreans. But the misclassification rate in the study exceeded 40%. Given this, research on developing an LDL-c equation suitable for Koreans should be continuously conducted, and it is necessary to conduct research based on representative samples in the future.
Recently, many studies have been conducted to estimate LDL-c using AI methods.141617 This study also developed an estimation model using XGBoost, one of the AI-based methods, in consideration of this aspect. As a result of comparing the formula developed through the conventional statistical method with the AI-based estimation model, the performance was similar. Due to the characteristics of the clinical field, a formula with a simple calculation process is preferred from a conservative point of view, so we expect that the formula developed based on regression analysis will be more appropriate for practical application.
The development of an LDL-c estimation formula for Koreans will have great implications in the aspects of public health, such as reducing the financial burden of national health insurance and contributing to the prevention and treatment of cardiovascular diseases.
 XML Download