Introduction
Materials and methods
1. APPO study design
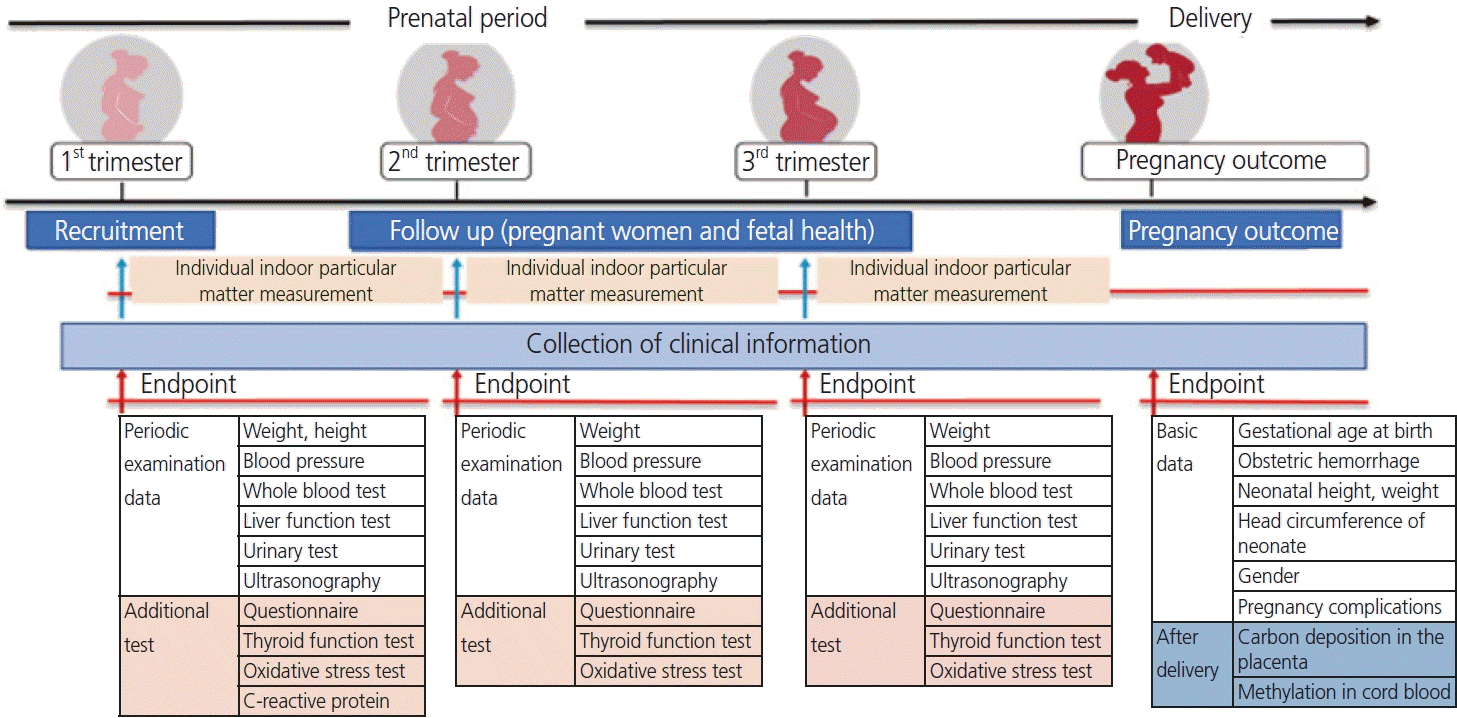
1) Basic concept and process
Table 1
2) Cohort composition
2. Study protocol
1) Recruitment of participants
Table 2
2) Collection of biological samples
Table 3
CBC, complete blood count; Hb, hemoglobin; WBC, white blood cell count; AST, aspartate aminotransferase; ALT, alanine transaminase; γ-GTP, gamma glutamyl transferase; LDL, low-density lipoprotein; HDL, high-density lipoprotein; HbA1c, glycated hemoglobin; BUN, blood urea nitrogen; TSH, thyroid stimulating hormone; free T4, free thyroxine; hs-CRP, high sensitivity C-reactive protein; 8-OHdG, 8-hydroxy-2′-deoxyguanosine; MDA, malondialdehyde.
3) Assessment of outcomes: clinical information
4) Data control and management
3. Calculation of estimated individual exposure to PM
1) Questionnaires
2) Measurement of outdoor air pollution concentration
3) Measurement of indoor air pollution concentration
4) Personal exposure prediction using a time-weighted average model
Results
1. General characteristics of participants
Table 4
| Value | |
|---|---|
| Demographic factors | |
| Age (yr) | 333 (33.6±4.1) |
| Maternal height (cm) | 333 (162.2±5.1) |
| Pre-pregnancy weight (kg) | 333 (58.5±9.6) |
| Pre-pregnancy BMI (kg/m2) | 333 (22.2±3.4) |
| Marital status | |
| Married | 326 (97.9) |
| Single, divorced | 6 (1.8) |
| Education | |
| ≤High school | 29 (8.7) |
| College | 237 (71.2) |
| ≥Graduate school | 66 (19.8) |
| Occupation | |
| Yes | 223 (67.0) |
| No | 109 (32.7) |
| Income (KRW/month)a) | |
| <4,000,000 | 77 (23.1) |
| 4,000,000–5,990,000 | 57 (17.1) |
| ≤6,000,000 | 77 (23.1) |
| Environmental factors | |
| Place of residence | |
| Urban areas | 309 (92.8) |
| Rural and mountain areas | 12 (3.6) |
| Industrial complex | 2 (0.6) |
| Floors of residence | |
| <10 floors | 194 (58.3) |
| ≥10 floors | 110 (33.0) |
| Distance to the road | |
| <50 m | 119 (35.7) |
| 50–100 m | 143 (42.9) |
| >100 m | 70 (21.0) |
| Adjacent road lane | |
| <Four lanes | 128 (38.4) |
| ≥Four lanes | 204 (61.3) |
| Traffic volume | |
| High | 161 (48.3) |
| Usual | 130 (39.0) |
| Low | 41 (12.3) |
| Lifestyle factors | |
| Smoking during pregnancy | |
| Yes | 29 (8.7) |
| No | 303 (91.0) |
| Exposure to secondhand smoke during pregnancy | |
| Yes (in home) | 16 (4.8) |
| Yes (in the workplace) | 29 (8.7) |
| Drinking alcohol during pregnancy | |
| Yes | 19 (5.7) |
| No | 313 (94.0) |
| Drinking coffee during pregnancy | |
| Yes | 157 (47.1) |
| No | 174 (52.3) |
| Physical activity | |
| Yes | 79 (23.7) |
| No | 253 (76.0) |
| Main cooking style | |
| Roasting | 139 (41.7) |
| Boiling or poaching | 65 (19.5) |
| Frying in oil | 119 (35.7) |
| Clinical characteristics | |
| Parity | |
| Nulliparity | 156 (46.8) |
| ≥1 parity | 177 (53.2) |
| Pregnancy method | |
| Natural pregnancy | 287 (86.2) |
| By ART | 46 (13.8) |
| History of preterm birth | |
| Yes | 12 (3.6) |
| No | 321 (96.4) |
| Gestational age at birth | 332 (38.4±1.8) |
| Methods of delivery | |
| Vaginal delivery | 118 (35.4) |
| Cesarean section | 214 (64.3) |
| Characteristics of neonate | |
| Gender | |
| Male | 179 (53.8) |
| Female | 152 (45.6) |
| Weight (g) | 330 (3,138±456.1) |
| Height (cm) | 330 (49.2±2.5) |
| Apgar score | |
| 1 min | 331 (8.4±1.3) |
| 5 min | 331 (9.3±1.1) |
| Neonatal complications | |
| Preterm birth | 26 (7.8) |
| Low birth weight | 9 (2.7) |
| Admission in NICU (yes) | 45 (13.5) |


 PDF
PDF Citation
 Print
Print


 XML Download