Journal List > Ann Lab Med > v.43(5) > 1516082621

Jung, Lee, Shin, Kim, Woo, Cho, Hyun, Kim, and Kim: Comparison of Nasal Swabs, Nasopharyngeal Swabs, and Saliva Samples for the Detection of SARS-CoV-2 and other Respiratory Virus Infections

Abstract

Background

Nasal swabs and saliva samples are being considered alternatives to nasopharyngeal swabs (NPSs) for detecting severe acute respiratory syndrome-coronavirus 2 (SARS-CoV-2); however, few studies have compared the usefulness of nasal swabs, NPSs, and saliva samples for detecting SARS-CoV-2 and other respiratory virus infections. We compared the positivity rates and concentrations of viruses detected in nasal swabs, NPSs, and saliva samples using cycle threshold (Ct) values from real-time PCR tests for respiratory viruses.

Methods

In total, 236 samples (48 five-rub and 10 10-rub nasal swabs, 96 NPSs collected using two different products, 48 saliva swabs, and 34 undiluted saliva samples) from 48 patients (34 patients with SARS-CoV-2 and 14 with other respiratory virus infections) and 40 samples from eight healthy controls were obtained. The PCR positivity and Ct values were compared using Allplex Respiratory Panels 1/2/3 and Allplex SARS-CoV-2 real-time PCR.

Results

NPSs showed the lowest Ct values (indicating the highest virus concentrations); however, nasal and saliva samples yielded positive results for SARS-CoV-2 and other respiratory viruses. The median Ct value for SARS-CoV-2 E gene PCR using nasal swab samples collected with 10 rubs was significantly different from that obtained using nasal swabs collected with five rubs (Ct=24.3 vs. 28.9; P=0.002), but not from that obtained using NPSs.

Conclusions

Our results confirm that the NPS is the best sample type for detecting respiratory viruses, but nasal swabs and saliva samples can be alternatives to NPSs. Vigorously and sufficiently rubbed nasal swabs can provide SARS-CoV-2 concentrations similar to those obtained with NPSs.

INTRODUCTION

For diagnosing respiratory virus infections, obtaining an appropriate upper respiratory tract sample and using an accurate test method is crucial. Nasopharyngeal swab (NPS) sampling is a standard method for respiratory virus detection [1, 2]; however, it requires the patient to visit a hospital or clinic as the sampling must be performed by skilled medical staff, and patients may experience discomfort because of the invasive nature of sample collection. In addition, since NPS sampling induces coughing and sneezing, there is a risk of transmission of infection and exposure of healthcare workers to infectious airborne particles.
Nasal swab samples are widely used for severe acute respiratory syndrome-coronavirus 2 (SARS-CoV-2) rapid antigen tests (RATs), and several studies have compared the sensitivity of tests using nasal swab and saliva samples with that of tests using NPSs [39]. RATs of saliva and nasal swabs tended to have lower diagnostic accuracy than NPS-based PCR. However, some studies have shown that nasal swabs and saliva samples showed equally effective diagnostic performance as NPS samples for SARS-CoV-2 infection detection [313]. These different sensitivities of nasal swabs and saliva samples compared with that of NPSs may arise from differences among subjects, study periods, sampling and detection methods, and SARS-CoV-2 variants. However, few studies have simultaneously compared various samples, including nasal swabs, NPSs, and saliva samples, for the detection of other respiratory viruses using a consistent methodology [1419].
We aimed to evaluate the extent to which respiratory viruses, including SARS-CoV-2, are detected in nasal swabs and saliva samples and to identify potential product-to-product differences in detection processes using NPSs. Specifically, we compared the virus concentrations in nasal swabs, NPSs collected using two different products, and saliva samples using real-time reverse transcription (RT)-PCR test, targeting genes of SARS-CoV-2 and other respiratory viruses. In addition, we compared the concentrations of SARS-CoV-2 in nasal swabs collected by rubbing one nostril five times and the other nostril 10 times to examine the difference in viral load according to the number of nasal swab rubs. We also investigated whether nasal swabs and saliva samples could be alternatives to NPSs for PCR tests to effectively detect SARS-CoV-2 and other respiratory viruses.

MATERIALS AND METHODS

Clinical samples and study design

We recruited patients diagnosed as having respiratory viral infections, including SARS-CoV-2 infection, between November 2021 and August 2022 at Hallym University Dongtan Sacred Heart Hospital, Hwaseong, Korea. Sixty-three subjects (55 patients with confirmed infection and eight healthy controls) were included in this study. In total, 41 patients were found infected with SARS-CoV-2 and 14 were infected with other respiratory viruses. All patients had a fever or showed respiratory symptoms after infection. All samples from SARS-CoV-2-infected patients were collected 6–8 days after the onset of symptoms in the COVID-19 screening outpatient clinic, and all samples from patients with other respiratory viral infections were collected after 3–8 days after the onset of symptoms in inpatient rooms. There were 42 female and 21 male subjects, with a median age of 28.0 years (range, six months–76 years).
Five or six samples were collected from each subject, including one or two nasal swab samples, two NPS samples (obtained using products from two different manufacturers), and two saliva samples (one saliva swab collected in transport medium and one undiluted sample collected in a saliva collection tube without transport medium), in the mentioned order. Nasal swab samples were collected using an SS-SWAB applicator (Noble Bio, Hwaseong, Korea) and immersed in Clinical Virus Transport Medium (CTM; Noble Bio). The nasal swab samples were collected by the patients themselves by placing the swab applicator in one nostril and rubbing the inside of the nostril while rotating the swab five times. One additional nasal swab sample was collected from ten of the 41 patients infected with SARS-CoV-2 that was rotated 10 times in the other nostril to check whether there was a difference in the concentration of the virus depending on the number of rubs. The self-collection of nasal swab samples was performed in the presence of medical staff according to the staff’s instructions.
NPS samples were collected by medical staff using two types of NPSs: NFS-SWAB applicator (Noble Bio) was used in one nostril and FLOQSwabs (Copan Diagnostics Inc., Brescia, Italy) was used in the other nostril. The swabs were inserted into the nasopharynx and rotated in place two or three times for at least 5 seconds. The collected swabs were immersed in CTM. Four medical staff members collected NPS samples, and one staff member was responsible for sample collection per patient.
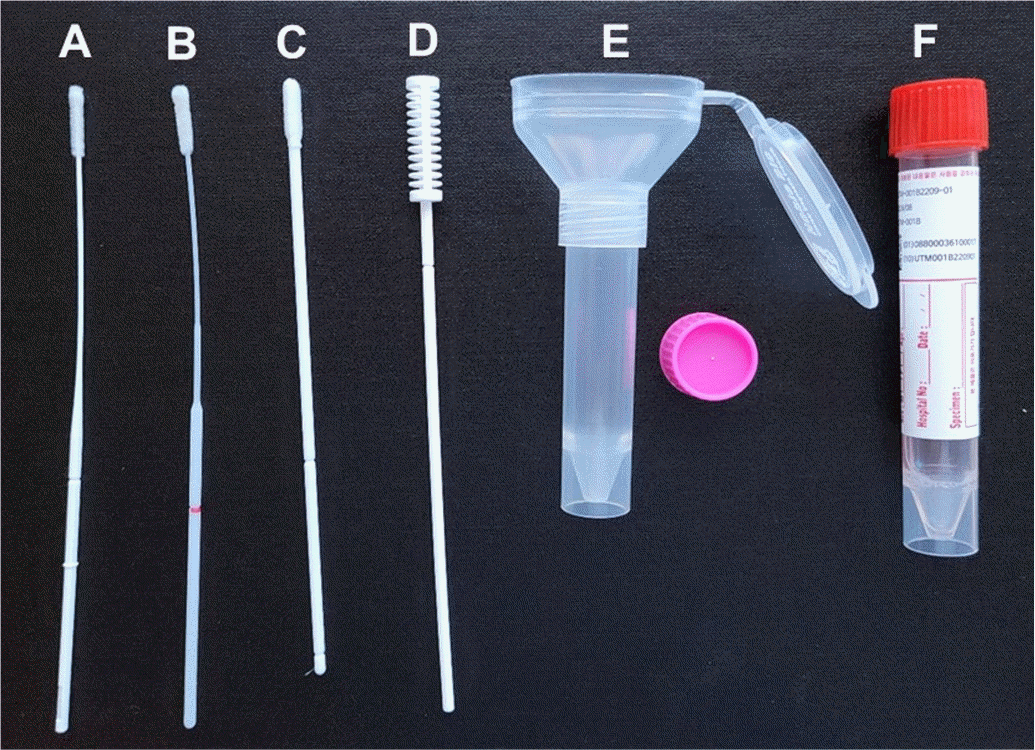
Two types of saliva samples were collected. First, a saliva swab (SLS-1; Noble Bio) was placed under the tongue for at least 3 mins to allow the saliva to penetrate the grooves on the swab, which was then immersed in CTM. Second, undiluted saliva was collected by asking the subject to spit into a funnel-shaped saliva collection tube. Since pediatric patients had difficulty in spitting, only saliva swabs were collected from these patients. Except for the undiluted saliva samples, all collected swab samples were immersed in the same type and amount of CTM, and the five or six samples from each subject were simultaneously transported to the laboratory within 1 hour. The five sample collection devices used are shown in Fig. 1.
The study was approved by the Institutional Review Board of Hallym University Dongtan Sacred Heart Hospital (HDT 2021-10-003). Informed consent was obtained from all study subjects.

Questionnaire on discomfort of NPS collection

A questionnaire was administered to the study subjects to assess the discomfort experienced during the collection of the two NPSs. After sample collection, we asked which of the two NPS collection procedures was more uncomfortable.

Real-time PCR for respiratory virus detection

The collected samples were transported and stored at 4°C, and nucleic acids were extracted using QIAcube and QIAamp Viral RNA Mini Kits (Qiagen, Hilden, Germany) within 1 day after sample collection. Real-time PCRs for the detection of 16 respiratory viruses, including SARS-CoV-2, were performed using Allplex Respiratory Panels 1/2/3 and the Allplex SARS-CoV-2 kit (Seegene, Seoul, Korea) on a CFX96 Real-Time PCR Detection System (Bio-Rad, Hercules, CA, USA) according to manufacturer’s instructions. Real-time PCR cycle threshold (Ct) values for the different sample types were compared.

RNase P real-time PCR for the monitoring of human cellular components

Human RNase P real-time PCR was used to monitor sample quality and compare the amounts of human cellular components among samples. Primer and probe information for the RNase P real-time PCR test was obtained from the CDC website (https://www.cdc.gov/coronavirus/2019-ncov/lab/rt-pcr-panel-primer-probes.html). A 160-bp RNase P sequence-containing plasmid vector control (pBHA vector) was purchased from Bioneer (Daejeon, Korea). Quantitative linearity of RNase P real-time PCR was confirmed using 10-fold serially diluted pBHA vector and three-fold serially diluted saliva samples from three volunteers (Supplemental Data Fig. S1). All samples were measured in triplicate.

Statistical analysis

Ct values are expressed as medians (first to third quartiles). The Friedman test was used to compare the Ct values of multiple paired groups, and the Wilcoxon test (paired samples) was used to compare the Ct values of two paired groups. Cohen’s kappa was used to check for agreement between samples with the highest virus concentrations and samples with the highest RNase P concentrations. Statistical analyses were performed using MedCalc (version 20.113; MedCalc Software Ltd., Ostend, Belgium). P<0.05 was considered statistically significant.

RESULTS

Comparison of positivity rate in real-time PCRs of SARS-CoV-2 and other respiratory viruses among different sample types

Of the 63 study subjects, seven subjects with inconclusive SARS-CoV-2 results based on NPS samples were excluded from the analysis. Thirty-four patients had SARS-CoV-2 infection, 14 patients had other respiratory viral infections, and eight subjects were healthy controls (Table 1). Table 1 shows the PCR positivity for SARS-CoV-2 and other respiratory viruses for the five sample types. Both types of NPS samples (Noble Bio and Copan) showed 100% positivity rates for SARS-CoV-2 and respiratory viruses. Nasal swab samples rubbed five times inside one nostril showed a positivity rate of 83.3% (40/48) and failed to detect infection in seven out of 34 patients with COVID-19 and in one out of two patients with parainfluenza virus type 3 (PIV3). These eight patients who tested negative on real-time PCR of nasal swabs had a low viral load (Ct≥30) according to real-time PCR using NPSs. Undiluted saliva samples showed a positivity rate of 76.5% (26/34), which was higher than that obtained with diluted saliva samples (saliva swabs in transport medium; 68.8%). These patients who tested negative on real-time PCR using undiluted saliva samples also had a low viral load (Ct≥30) according to real-time PCR using NPSs. No virus was detected in samples obtained from the eight healthy controls.

Comparison of Ct values of real-time PCR for SARS-CoV-2 and other respiratory viruses among sample types

The Ct values for the two NPSs, one nasal swab rubbed five times, and the two saliva samples (undiluted and diluted) were compared to assess differences in viral concentrations based on sample type. We found significant differences in Ct values among the five sample types for SARS-CoV-2, human rhinovirus (HRV), and PIV3 (P<0.01) (Table 2). For all respiratory viruses, including SARS-CoV-2, the virus concentrations were higher in the NPSs (i.e., lower Ct values) than in the other samples. Saliva samples showed lower viral concentrations than nasal swabs and NPSs, and the virus concentrations in the diluted saliva samples in transport media were lower than those in the undiluted saliva samples. Among the two NPS products (Noble Bio and Copan), Noble Bio samples showed a lower median Ct value (higher viral load) than Copan samples for SARS-CoV-2; however, the difference was not significant (P>0.05). For the other respiratory viruses, there were differences in the median Ct values between the two NPS products; however, the number of samples was too small to detect a significant difference. Noble Bio samples showed lower median Ct values than Copan samples for SARS-CoV-2, HRV, PIV3 and PIV4, and adenovirus, whereas Copan samples showed lower median Ct values for respiratory syncytial virus type B, human bocavirus, and influenza A virus. Saliva samples had the highest RNase P concentrations (the lowest Ct values) among the five sample types.
In 10 out of 41 patients with confirmed COVID-19, additional nasal swab samples (collected using 10 nasal swab rotations) were obtained. We found significant differences in Ct values for SARS-CoV-2 (E gene, RNA-dependent RNA polymerase [RdRP] gene, and N gene) among the six sample types (Fig. 2). The virus concentrations were the highest in the NPSs, followed by the 10-rub nasal swabs, five-rub nasal swabs, undiluted saliva, and diluted saliva. There was a significant difference in viral concentrations between the five-times-rotated nasal swabs and 10-times-rotated nasal swabs; however, there were no significant differences in viral concentrations (Ct values) between the 10-times-rotated nasal swabs and the NPSs (Fig. 2A and B). RNase P showed the highest concentrations in the saliva samples (Fig. 2D).

Comparison of virus concentrations and RNase P concentrations in NPSs and nasal swabs

Except for saliva samples, which had the highest RNase P concentrations possibly because these samples have the highest concentrations of cellular components, samples with the highest virus concentrations among nasal and NPS samples collected from the same person tended to have the highest RNase P concentrations. Therefore, we assessed the agreement between samples with the highest virus concentrations and samples with the highest RNase P concentrations using Cohen’s kappa agreement analysis (Table 3). The samples showing the highest virus concentrations included three nasal swabs, 24 NPSs (Noble Bio), and 21 NPSs (Copan). Samples with the highest virus concentrations and samples with the highest RNase P concentrations showed moderate agreement (κ=0.414, 95% confidence interval: 0.203–0.625).

Questionnaire on discomfort during NPS collection

Of the 63 study subjects, 30 reported that Copan NPS sampling was more uncomfortable than Noble Bio NPS sampling, 10 reported that Noble Bio NPS sampling was more uncomfortable than Copan sampling, and 10 reported that they experienced similar discomfort during both sampling procedures. The remaining 13 subjects were children, and it was difficult to survey the discomfort they experienced with the two methods. Therefore, no answer on their level of discomfort was recorded.

DISCUSSION

The present study showed that the detection rates and concentrations of respiratory viruses, including SARS-CoV-2, were higher in NPSs than in saliva samples and nasal swabs. However, not all patients showed a higher viral load in NPSs than in saliva samples and nasal swabs. In a few cases, vigorous rubbing of the nasal swab into the nasal mucosa for several seconds resulted in a higher viral load than that obtained with NPSs that were rapidly removed. Further, virus concentrations in nasal swabs rubbed 10 times were significantly higher than those in nasal swabs rubbed five times and similar to those in NPSs. The strength of our study is that we compared viral concentrations in paired samples comprising two nasal swabs (particularly, using different number of rubs), two NPSs, and two saliva samples. Numerous studies have compared two sample types [1114, 20, 21]; however, few studies have compared three or more sample types [9, 10, 22]. In particular, it is difficult to find studies comparing sample types for respiratory viruses and SARS-CoV-2.
Most cases of infection detection in NPSs, but not in nasal swabs and saliva, involved samples with very low virus concentrations (NPS Ct values of ≥32), consistent with results in a previous study [10]. In our study, samples were collected from patients with COVID-19 6–8 days after symptom onset, and the viral loads obtained using NPSs, nasal swabs, and saliva samples were similar to those reported in another study in patients sampled at a similar time after symptom onset [10]. A decrease in the viral load in NPSs and an increase in the Ct value to >30 were associated with a decrease in the sensitivity of nasal swabs and saliva samples in the present and previous studies [10]. Alemany, et al. [10] suggested that saliva samples have sufficient sensitivity for the identification of individuals at risk of transmission, considering that subjects with respiratory samples with Ct values >33 are unlikely to be contagious.
Studies monitoring viral shedding among close contacts have shown that during the presymptomatic period, the viral load is higher in the saliva than in the nasal cavity, whereas after the onset of symptoms, the viral load tends to decline to a lower level in the saliva than in the nasal cavity [11, 12]. Iwasaki, et al. [23] showed that the agreement rate of PCR results between saliva and NPS is high (97.4%) in the early stage of symptom onset and that the viral load in saliva peaks for one week and then declines. Marais, et al. [21] showed that the positivity rate in saliva is higher than that in mid-turbinate samples until 3–5 days after symptom onset and then declines. Based on these results, in the present study, the viral loads in saliva may have been lower than those in NPSs and nasal swabs because we collected samples 6–8 days after symptom onset. However, this is difficult to confirm as the samples were not collected sequentially.
We also compared the concentrations of SARS-CoV-2 virus in nasal swabs rubbed five or 10 times. Although a small number of subjects were included in this analysis (N=10), the results suggested that nasal swabs may produce NPS-equivalent results when the number of rubs in both nostrils is sufficiently high. Only patients with COVID-19 were included in this analysis; therefore, future studies should expand the sample size to include cases of infection with other respiratory viruses.
Many participants reported that Copan NPS sampling was more uncomfortable than Noble Bio NPS sampling, which may be because of the slightly denser and longer hair on the swab head in the former (Fig. 1). From the sample collector’s perspective, the two types of NPSs were collected from both nostrils, and they noticed a difference in the resistance felt in the two nostrils, which may be related to the discomfort experienced by the subjects. Discomfort is also related to deviated nasal septa and narrowing of the nasal passages. When the NPS was passed through the nasal passage smoothly without any resistance, the patients responded that the discomfort was minimal.
Multiple studies have compared the positivity rates between saliva samples and nasal swabs according to the time before and after symptom onset in SARS-CoV-2 infection [912]; however, other respiratory viruses have been rarely evaluated. We compared the detection rates in saliva samples, nasal swabs, and NPSs in confirmed respiratory viral infections with symptoms; however, we did not assess the positivity rates over a certain period. Given the high asymptomatic infection rate and transmission potential of SARS-CoV-2, its dynamics in the respiratory mucosa may largely differ from those of other respiratory viruses. In support of this, one study has shown that the difference in viral shedding kinetics between the Delta and Omicron strains was associated with a difference in viral load in saliva [21]. Since differences in viral tropism can affect the viral load in different respiratory mucosae, the sample source with a high diagnostic rate may also differ depending on the virus [15]. Since the seasons of viral respiratory epidemics vary among countries and communities, a systematic and diverse study design is required. Given the possibility of a new pandemic caused by another emerging pathogen, such as SARS-CoV-2, studies on respiratory samples are expected to expand.
Samples with the highest virus concentration and samples with the highest RNase P concentrations showed moderate agreement (κ=0.414) in this study. We expected to observe a correlation between virus concentrations and RNase P concentrations according to the swab sample amount. However, saliva and even diluted saliva had higher RNase P concentrations than nasal or NPS samples. This may be because of the higher amount of cellular components in saliva. The moderate agreement after excluding saliva samples indicated that higher viral concentrations can be obtained through adequate sampling, but the measured Ct value itself showed analytic variations, and the order of highest concentration changed with a slight Ct difference.
Our study had a few limitations. First, most tests were performed on patients 3–8 days after symptom onset; therefore, virus concentrations right before or at the time of symptom onset were unknown. As shown in other studies on SARS-CoV-2 viral shedding kinetics, if we would have collected samples within 3 days of symptom onset, the virus concentrations might have differed. Second, as the total number of subjects that tested positive for respiratory viruses was small, it was not possible to compare the positivity rate and virus concentration in each sample type for each virus. Although previous studies have compared the positivity rates for respiratory viruses in single samples [1416], it is difficult to study the positivity rate in samples according to each respiratory virus individually in a single institution because the types of viruses and samples are diverse. As respiratory viral loads differ in different respiratory mucosae, different sampling methods may have different detection rates. Future studies should be designed considering these differences and homogeneity. Third, nasal swabs may have a risk of sampling bias and reduced reliability owing to self-collection by the patients, as some patients might have rubbed vigorously, whereas others might have rubbed lightly. However, our results reflect actual self-collection data.
In conclusion, NPS samples showed the highest virus concentrations, but nasal and saliva samples also yielded positive results for SARS-CoV-2 and other respiratory viruses. Our results suggest that nasal swabs and saliva samples may represent alternatives to NPSs for respiratory virus and SARS-CoV-2 PCR tests, and that if a nasal swab sample is collected with the same swab rubbed vigorously >10 times in both nostrils, the SARS-CoV-2 concentration may be similar to that in NPSs.

Supplemental Materials

ACKNOWLEDGEMENTS

None.

Notes

AUTHOR CONTRIBUTIONS

Kim HS designed the study and supervised the project; Jung EJ, Kim JS, Shin S, and Kim HS collected the samples and data; Lee SK performed the measurements; Jung EJ and Hyun J analyzed the data; Jung EJ and Lee SK wrote the original draft; Kim HS, Kim J, and Woo H reviewed and edited the manuscript. All authors have read and approved the final version of the manuscript.

CONFLICTS OF INTEREST

None declared.

REFERENCES

1. Miller JM, Binnicker MJ, Campbell S, Carroll KC, Chapin KC, Gilligan PH, et al. 2018; A guide to utilization of the microbiology laboratory for diagnosis of infectious diseases: 2018 update by the Infectious Diseases Society of America and the American Society for Microbiology. Clin Infect Dis. 67:e1–e94. DOI: 10.1093/cid/ciy381. PMID: 29955859. PMCID: PMC7108105.
2. Hong KH, Kim GJ, Roh KH, Sung H, Lee J, Kim SY, et al. 2022; Update of guidelines for laboratory diagnosis of COVID-19 in Korea. Ann Lab Med. 42:391–7. DOI: 10.3343/alm.2022.42.4.391. PMID: 35177559. PMCID: PMC8859556.
crossref
3. Oh SM, Jeong H, Chang E, Choe PG, Kang CK, Park WB, et al. 2021; Clinical application of the standard Q COVID-19 Ag test for the detection of SARS-CoV-2 infection. J Korean Med Sci. 36:e101. DOI: 10.3346/jkms.2021.36.e101. PMID: 33847084. PMCID: PMC8042480.
crossref
4. Corman VM, Haage VC, Bleicker T, Schmidt ML, Mühlemann B, Zuchowski M, et al. 2021; Comparison of seven commercial SARS-CoV-2 rapid point-of-care antigen tests: a single-centre laboratory evaluation study. Lancet Microbe. 2:e311–9. DOI: 10.1016/S2666-5247(21)00056-2. PMID: 33846704.
crossref
5. Torjesen I. 2021; Covid-19: How the UK is using lateral flow tests in the pandemic. BMJ. 372:n287. DOI: 10.1136/bmj.n287. PMID: 33541908.
crossref
6. Lindner AK, Nikolai O, Kausch F, Wintel M, Hommes F, Gertler M, et al. 2021; Head-to-head comparison of SARS-CoV-2 antigen-detecting rapid test with self-collected nasal swab versus professional-collected nasopharyngeal swab. Eur Respir J. 57:2003961. DOI: 10.1183/13993003.03961-2020. PMID: 33303544. PMCID: PMC7736752.
7. Jegerlehner S, Suter-Riniker F, Jent P, Bittel P, Nagler M. 2022; Diagnostic accuracy of SARS-CoV-2 saliva antigen testing in a real-life clinical setting. Int J Infect Dis. 119:38–40. DOI: 10.1016/j.ijid.2022.03.037. PMID: 35364282. PMCID: PMC8964446.
crossref
8. Alonaizan F, AlHumaid J, AlJindan R, Bedi S, Dardas H, Abdulfattah D, et al. 2022; Sensitivity and specificity of rapid SARS-CoV-2 antigen detection using different sampling methods: a clinical unicentral study. Int J Environ Res Public Health. 19:6836. DOI: 10.3390/ijerph19116836. PMID: 35682419. PMCID: PMC9180118.
crossref
9. Homza M, Zelena H, Janosek J, Tomaskova H, Jezo E, Kloudova A, et al. 2021; Performance of seven SARS-CoV-2 self-tests based on saliva, anterior nasal and nasopharyngeal swabs corrected for infectiousness in real-life conditions: a cross-sectional test accuracy study. Diagnostics (Basel). 11:1567. DOI: 10.3390/diagnostics11091567. PMID: 34573909. PMCID: PMC8466378.
crossref
10. Alemany A, Millat-Martinez P, Ouchi D, Corbacho-Monné M, Bordoy AE, Esteban C, et al. 2021; Self-collected mid-nasal swabs and saliva specimens, compared with nasopharyngeal swabs, for SARS-CoV-2 detection in mild COVID-19 patients. J Infect. 83:709–37. DOI: 10.1016/j.jinf.2021.09.012. PMID: 34537322. PMCID: PMC8444446.
crossref
11. Savela ES, Viloria Winnett A, Romano AE, Porter MK, Shelby N, Akana R, et al. 2022; Quantitative SARS-CoV-2 viral-load curves in paired saliva samples and nasal swabs inform appropriate respiratory sampling site and analytical test sensitivity required for earliest viral detection. J Clin Microbiol. 60:e0178521. DOI: 10.1128/jcm.01785-21. PMID: 34911366. PMCID: PMC8849374.
crossref
12. Lai J, German J, Hong F, Tai SS, McPhaul KM, Milton DK, et al. 2022; Comparison of saliva and midturbinate swabs for detection of SARS-CoV-2. Microbiol Spectr. 10:e0012822. DOI: 10.1128/spectrum.00128-22. PMID: 35311575. PMCID: PMC9045394.
crossref
13. McLennan K, Barton E, Lang C, Adams IR, McAllister G, Reijns MAM, et al. 2022; User acceptability of saliva and gargle samples for identifying COVID-19 positive high-risk workers and household contacts. Diagn Microbiol Infect Dis. 104:115732. DOI: 10.1016/j.diagmicrobio.2022.115732. PMID: 35728458. PMCID: PMC9132684.
crossref
14. Kim YG, Yun SG, Kim MY, Park K, Cho CH, Yoon SY, et al. 2017; Comparison between saliva and nasopharyngeal swab specimens for detection of respiratory viruses by multiplex reverse transcription-PCR. J Clin Microbiol. 55:226–33. DOI: 10.1128/JCM.01704-16. PMID: 27807150. PMCID: PMC5228234.
crossref
15. Hou N, Wang K, Zhang H, Bai M, Chen H, Song W, et al. 2020; Comparison of detection rate of 16 sampling methods for respiratory viruses: a Bayesian network meta-analysis of clinical data and systematic review. BMJ Glob Health. 5:e003053. DOI: 10.1136/bmjgh-2020-003053. PMID: 33168521. PMCID: PMC7654123.
crossref
16. Woodall CA, Thornton HV, Anderson EC, Ingle SM, Muir P, Vipond B, et al. 2021; Prospective study of the performance of parent-collected nasal and saliva swab samples, compared with nurse-collected swab samples, for the molecular detection of respiratory microorganisms. Microbiol Spectr. 9:e0016421. DOI: 10.1128/Spectrum.00164-21. PMID: 34756077. PMCID: PMC8579848.
crossref
17. To KKW, Lu L, Yip CC, Poon RWS, Fung AMY, Cheng A, et al. 2017; Additional molecular testing of saliva specimens improves the detection of respiratory viruses. Emerg Microbes Infect. 6:e49. DOI: 10.1038/emi.2017.35. PMID: 28588283. PMCID: PMC5520312.
crossref
18. Wang WK, Chen SY, Liu IJ, Chen YC, Chen HL, Yang CF, et al. 2004; Detection of SARS-associated coronavirus in throat wash and saliva in early diagnosis. Emerg Infect Dis. 10:1213–9. DOI: 10.3201/eid1007.031113. PMID: 15324540. PMCID: PMC3323313.
crossref
19. Bennett S, Davidson RS, Gunson RN. 2017; Comparison of gargle samples and throat swab samples for the detection of respiratory pathogens. J Virol Methods. 248:83–6. DOI: 10.1016/j.jviromet.2017.06.010. PMID: 28633963.
crossref
20. Abdollahi A, Salarvand S, Ghalehtaki R, Jafarzadeh B, Beigmohammadi MT, Ghiasvand F, et al. 2022; The role of saliva PCR assay in the diagnosis of COVID-19. J Infect Dev Ctries. 16:5–9. DOI: 10.3855/jidc.15239. PMID: 35192515.
crossref
21. Marais G, Hsiao NY, Iranzadeh A, Doolabh D, Joseph R, Enoch A, et al. 2022; Improved oral detection is a characteristic of Omicron infection and has implications for clinical sampling and tissue tropism. J Clin Virol. 152:105170. DOI: 10.1016/j.jcv.2022.105170. PMID: 35525108.
crossref
22. Berenger BM, Fonseca K, Schneider AR, Hu J, Zelyas N. 2022; Clinical evaluation of nasopharyngeal, midturbinate nasal and oropharyngeal swabs for the detection of SARS-CoV-2. Diagn Microbiol Infect Dis. 102:115618. DOI: 10.1016/j.diagmicrobio.2021.115618. PMID: 35007959. PMCID: PMC8675123.
crossref
23. Iwasaki S, Fujisawa S, Nakakubo S, Kamada K, Yamashita Y, Fukumoto T, et al. 2020; Comparison of SARS-CoV-2 detection in nasopharyngeal swab and saliva. J Infect. 81:e145–7. DOI: 10.1016/j.jinf.2020.05.071. PMID: 32504740. PMCID: PMC7270800.
crossref

Fig. 1
Photograph of the five types of sample collection devices and the transport medium. (A) NPS (NFS-1; Noble Bio), (B) NPS (Copan), (C) nasal swab (SS-1, Noble Bio), (D) saliva swab (SLS-1; Noble Bio), (E) saliva collection tube (Noble Bio), and (F) clinical transport medium (Noble Bio).
Abbreviation: NPS, nasopharyngeal swab.
alm-43-5-434-f1.tif
Fig. 2
Comparison of Ct values of real-time PCR targeting SARS-CoV-2 genes and RNase P among the six collection methods (N=10). (A) SARS-CoV-2 E gene, (B) SARS-CoV-2 RdRP gene, (C) SARS-CoV-2 N gene, and (D) Human RNase P gene. The positivity rate of each method is expressed as a percentage. *indicates P<0.05.
Abbreviations: Ct, cycle threshold; SARS-CoV-2, severe acute respiratory syndrome-coronavirus 2; NPS, nasopharyngeal swab; Nasal (5), nasal swab with five rotations in one nostril; Nasal (10), nasal swab with 10 rotations in one nostril.
alm-43-5-434-f2.tif
Table 1
Comparison of real-time PCR positivity for respiratory viruses among the five sample collection methods
Virus NPS (Noble Bio) in transport medium NPS (Copan) in transport medium Nasal swab in transport medium (five swab rubs) Saliva swab in transport medium Saliva (no transport medium)
SARS-CoV-2 (N = 34) 100% (34/34) 100% (34/34) 79.4% (27/34) 64.7% (22/34) 76.5% (26/34)
E gene 100% (34/34) 100% (34/34) 85.3% (29/34) 67.6% (23/34) 82.4% (28/34)
RdRP gene 100% (34/34) 100% (34/34) 79.4% (27/34) 67.6% (23/34) 76.5% (26/34)
N gene 100% (34/34) 100% (34/34) 85.3% (29/34) 64.7% (22/34) 79.4% (27/34)
HRV (N = 5) 100% (5/5) 100% (5/5) 100% (5/5) 80% (4/5) NA
HEV (N = 2) 100% (2/2) 100% (2/2) 100% (2/2) 100% (2/2) NA
PIV3 (N = 2) 100% (2/2) 100% (2/2) 50% (1/2) 50% (1/2) NA
PIV4 (N = 1) 100% (1/1) 100% (1/1) 100% (1/1) 100% (1/1) NA
RSV B (N = 1) 100% (1/1) 100% (1/1) 100% (1/1) 100% (1/1) NA
Adenovirus (N = 1) 100% (1/1) 100% (1/1) 100% (1/1) 100% (1/1) NA
HBoV (N = 1) 100% (1/1) 100% (1/1) 100% (1/1) 100% (1/1) NA
Influenza A virus (N = 1) 100% (1/1) 100% (1/1) 100% (1/1) 0% (0/1) NA
Total (N = 48) 100% (48/48) 100% (48/48) 83.3% (40/48) 68.8% (33/48) 76.5% (26/34)
Ct of NPS < 30 100% (26/26) 100% (26/26) 100% (26/26) 84.6% (22/26) 100% (19/19)
Ct of NPS ≥ 30 100% (22/22) 100% (22/22) 63.6% (14/22) 50.0% (11/22) 46.7% (7/15)
No virus (N = 8) 0% (0/8) 0% (0/8) 0% (0/8) 0% (0/8) NA

Abbreviations: NPS, nasopharyngeal swab; RdRP, RNA-dependent RNA polymerase; SARS-CoV-2, severe acute respiratory syndrome-coronavirus 2; HRV, human rhinovirus; HEV, human enterovirus; RSV, respiratory syncytial virus; PIV3, parainfluenza virus type 3; PIV4, parainfluenza virus type 4; HBoV, human bocavirus; Ct, cycle threshold of real-time PCR; NA, not applicable.

Table 2
Comparison of real-time PCR Ct values for respiratory viruses and human RNase P
Virus NPS (Noble Bio) in transport medium NPS (Copan) in transport medium Nasal swab in transport medium (five swab rubs) Saliva swab in transport medium Saliva (no transport medium) P (Friedman test)
SARS-CoV-2 (N = 34)
E gene 23.3 (21.5–27.7) 24.5 (21.6–31.1) 29.1 (25.9–34.1) 35.4 (29.6–40.0) 34.6 (28.3–36.6) < 0.00001
RdRP gene 25.8 (24.3–30.7) 27.6 (23.7–32.5) 32.1 (28.4–36.9) 37.4 (32.7–40.0) 33.5 (30.2–38.6) < 0.00001
N gene 23.5 (22.1–28.4) 25.4 (22.0–31.2) 30.7 (27.2–34.2) 36.0 (30.5–40.0) 31.0 (28.5–37.2) < 0.00001
HRV (N = 5) 24.7 (24.0–32.6) 25.1 (24.2–30.1) 27.8 (25.4–33.5) 38.0 (36.4–40.2) NA 0.00073
HEV (N = 2) 33.5 (33.4–33.6) 37.1 (24.2–40.0) 34.6 (30.3–38.8) 38.5 (38.0–39.0) NA 0.142
PIV3 (N = 2) 31.1 (26.2–36.1) 33.6 (29.3–38.0) 36.1 (32.3–40.0) 37.2 (34.3–40.0) NA 0.0079
PIV4 (N = 1) 28.9 30.7 29.8 34.0 NA
RSV B (N = 1) 28.7 25.3 29.6 38.9 NA
Adenovirus (N = 1) 22.3 28.2 29.7 40.0 NA
HBoV (N = 1) 22.41 13.7 27.49 36.9 NA
Influenza A virus (N = 1) 36.1 32.9 37.7 40.0 NA
No virus (N = 8) NA NA NA NA NA
RNase P (N = 56) 32.9 (32.1–34.7) 33.3 (31.8–34.7) 34.6 (32.7–36.3) 32.7 (31.0–34.2) 28.7 (27.6–31.2) < 0.00001

The bold text indicates the lowest median Ct value (highest viral load) of real-time PCR among the five collection methods. Tests with negative results were defined as Ct=40. Data are expressed as medians (first to third quartiles).

Abbreviations: Ct, cycle threshold of real-time PCR; HBoV, human bocavirus; HEV, human enterovirus; HRV, human rhinovirus; NA, not applicable; NPS, nasopharyngeal swab; PIV3, parainfluenza virus type 3; PIV4, parainfluenza virus type 4; RSV, respiratory syncytial virus; SARS-CoV-2, severe acute respiratory syndrome-coronavirus 2; RdRP, RNA-dependent RNA polymerase.

Table 3
Agreement between samples with the highest viral concentrations and samples with the highest RNase P concentrations among nasal swabs and two types of NPSs
Samples with the highest virus concentration Cohen’s kappa (SE) 95% CI

Nasal swab NPS (Noble) NPS (Copan) Total
Samples with the highest RNase P concentrations Nasa swab 2 5 2 9 0.414 (0.108) 0.203 0.625
NPS (Noble) 0 16 6 22
NPS (Copan) 1 3 13 17
Total 3 24 21 48

Abbreviations: CI, confidence interval; NPS, nasopharyngeal swab.

TOOLS
Similar articles