INTRODUCTION
METHODS
Kangbuk Samsung Health Study and study period
Definition of LMM and elevated NT-proBNP
Data availability
Statistical analyses
RESULTS
Baseline demographic characteristics
Table 2.
| Characteristic |
Overall |
P value | Post hoc analysis (Bonferroni) | |||
|---|---|---|---|---|---|---|
| Control (a) | Mildly LMM (b) | Severely LMM (c) | ||||
| Number | 12,827 (85.44) | 1,998 (13.31) | 188 (1.25) | |||
| Age, yr | 37.52±9.52 | 36.89±10.85 | 40.74±14.55 | <0.001 | a≠c, b≠c | |
| Male sex | 6,957 (54.24) | 1,114 (55.76) | 122 (64.89) | 0.007 | a≠c, b≠c | |
| Screening center (Seoul) | 3,625 (28.26) | 497 (24.87) | 51 (27.13) | 0.007 | a≠b | |
| Height, cm | 168.6±8.75 | 165.37±8.22 | 162.71±8.29 | <0.001 | a≠b, a≠c, b≠c | |
| Weight, kg | 68.65±13.78 | 56.43±9.18 | 51.1±8.05 | <0.001 | a≠b, a≠c, b≠c | |
| BMI, kg/m2 | 23.99±3.52 | 20.53±2.2 | 19.22±2.09 | <0.001 | a≠b, a≠c, b≠c | |
| Appendicular skeletal muscle mass, kg | 21.09±5.04 | 17.52±4.06 | 15.75±3.57 | <0.001 | a≠b, a≠c, b≠c | |
| SMIa, kg/m2 | 7.31±1.13 | 6.32±0.95 | 5.87±0.87 | <0.001 | a≠b, a≠c, b≠c | |
| Smoker status | <0.001 | a≠b, b≠c | ||||
| Never smoker | 8,146 (63.51) | 1,356 (67.87) | 104 (55.32) | |||
| Former smoker | 3,217 (25.08) | 452 (22.62) | 57 (30.32) | |||
| Current smoker | 1,310 (10.21) | 172 (8.61) | 22 (11.7) | |||
| Heavy alcohol | 2,271 (17.7) | 275 (13.76) | 30 (15.96) | <0.001 | a≠b | |
| Regular exercise | 1,809 (14.1) | 161 (8.06) | 6 (3.19) | <0.001 | a≠b, a≠c | |
| Comorbidities | ||||||
| Diabetes | 286 (2.23) | 44 (2.2) | 6 (3.19) | 0.470 | ||
| Hypertension | 1,018 (7.94) | 107 (5.36) | 18 (9.57) | <0.001 | a≠b, a≠c | |
| Dyslipidemia | 1,893 (14.76) | 235 (11.76) | 29 (15.43) | 0.004 | a≠b | |
| Laboratory finding | ||||||
| Fasting glucose | 95.15±13.13 | 93.24±13.09 | 96.76±28.26 | <0.001 | b≠c | |
| HbA1c | 5.47±0.49 | 5.39±0.46 | 5.51±0.84 | <0.001 | a≠b, b≠c | |
| Insulina | 6.64 (4.57–9.55) | 5.52 (3.92–7.68) | 4.8 (3.51–6.99) | <0.001 | a≠b, a≠c, b≠c | |
| Total cholesterol | 185.62±32.72 | 185.52±31.88 | 189.72±34.48 | 0.226 | ||
| LDL | 123.8±32.16 | 121.94±31.59 | 124.85±32.65 | 0.047 | a≠b, a≠c | |
| HDL | 60.98±16.53 | 65.66±16.65 | 66.48±18.43 | <0.001 | a≠b, a≠c | |
| Tga | 89 (64–135) | 80.5 (60–116) | 86.5 (65–128.5) | <0.001 | a≠b | |
| SBP | 110.14±12.31 | 106.21±11.77 | 107.13±11.87 | <0.001 | a≠b, a≠c | |
| DBP | 69.43±9.2 | 68.07±8.87 | 69.29±8.45 | <0.001 | a≠b | |
Values are expressed as number (%), mean±standard deviation, or median (interquartile range).
LMM, low skeletal muscle mass; BMI, body mass index; SMI, skeletal muscle mass index; HbA1c, hemoglobin A1c; LDL, low-density lipoprotein cholesterol; HDL, high-density lipoprotein cholesterol; Tg, triglyceride; SBP, systolic blood pressure; DBP, diastolic blood pressure.
Prevalence of elevated NT-proBNP in control, mildly LMM, and severely LMM groups
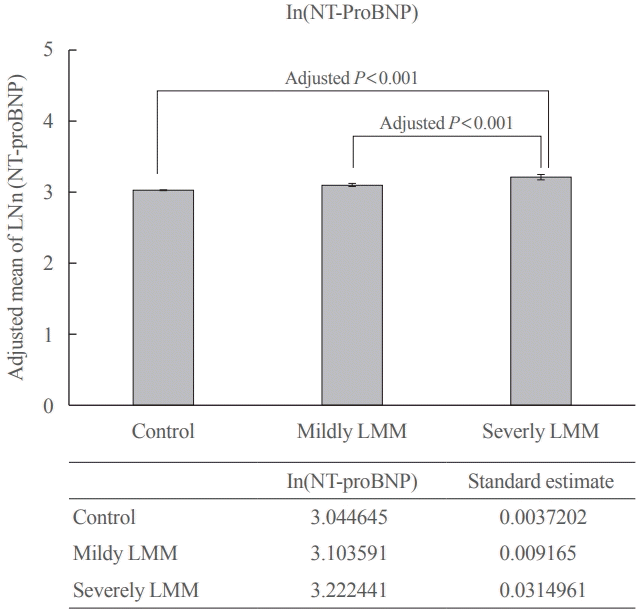
Comparison of natural log transformed NT-proBNP level values between each group
 | Fig. 2.Comparison of adjusted mean of ln(N-terminal prohormone brain natriuretic peptide [NT-proBNP]) between normal, mildly low skeletal muscle mass (LMM), and severely LMM groups. Comparison of adjusted mean±standard error of natural-log transformed NT-proBNP levels in the groups was estimated using analysis of covariance (ANCOVA) after adjusting for the following confounding factors: age, sex, health examination center, systolic blood pressure, glucose, smoking, heavy alcohol consumption (>30 g/day), regular exercise, and high-density lipoprotein cholesterol level. Group difference was assessed by Bonferroni post hoc P<0.001. |
Association between LMM and elevated NT-proBNP
Table 4.
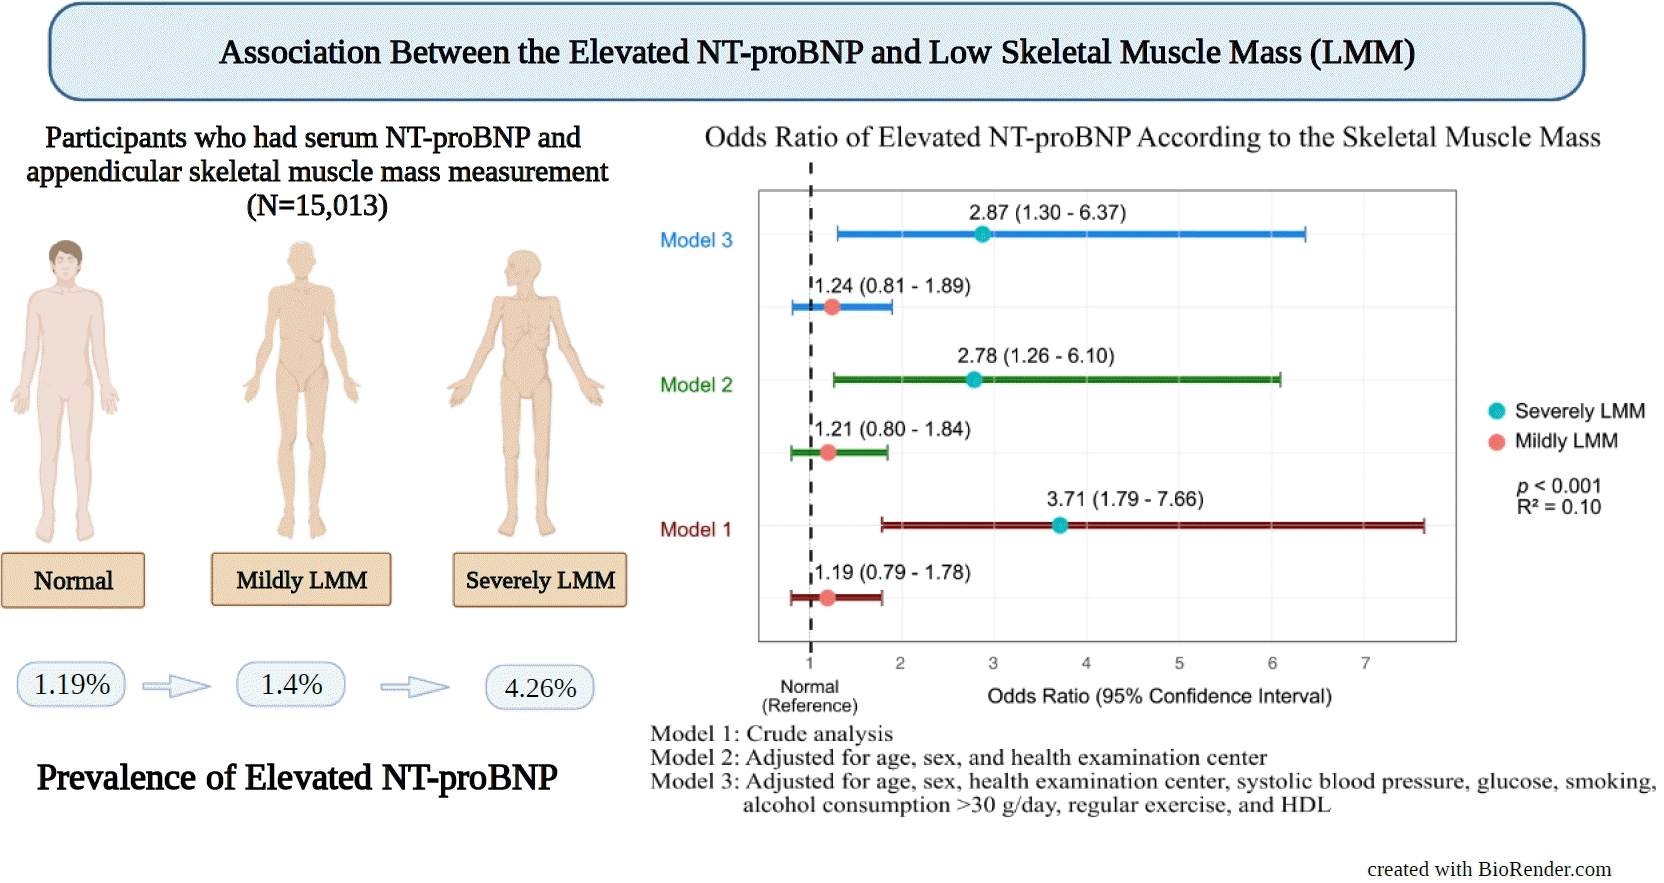
Values are expressed as odds ratio (95% confidence interval). Model 1: crude analysis; Model 2: adjusted for age, sex, and health examination center; Model 3: adjusted for age, sex, health examination center, systolic blood pressure, glucose, smoking, alcohol consumption >30 g/day, regular exercise, and high-density lipoprotein cholesterol.
NT-proBNP, N-terminal prohormone brain natriuretic peptide; LMM, low skeletal muscle mass.


 PDF
PDF Citation
 Print
Print


 XML Download