

 PDF
PDF Citation
 Print
Print


INTRODUCTION
Commuting is an essential activity in modern times.1 The average British worker spends 139 hours per year commuting,2 and the mean weekly commuting is 3.3 hours in Europe.3 Yet, commuting to work is an extremely undesirable daily life experience activity.4 Factors such as waking up early and exposure to noise and vibration from traffic congestion may be sources of stress.5 Thus, the work commute may negatively impact mental health.
Several studies on commuting time and mental health have shown that commuting time is associated with increased stress levels, depression, anxiety, and decreased well-being.3678 This is because an increased commuting time leaves less time for other daily activities (e.g., sleep, exercise, and family time).9
Koreans spend about 58 minutes a day commuting to and from work, and Korea has been shown to have the longest commuting time, twice the average of other countries, according to the Organization for Economic Cooperation and Development (OECD).10 Korea also has the lowest well-being score in 23 countries11 and highest prevalence of depression in OECD.12
Factors increasing commuting time include population growth and increasing urbanization.13 In addition, living in urban areas with high population density is associated with low quality of life and increased risk of depression.141516 Korea has the highest population density among OECD countries with more than 43.7% of the population concentrated in the capital and metropolitan cities, which accounts for only 5.9% of the total land.171819 Given these conditions, urbanization differences among metropolitan cities and provinces need to be emphasized while studying commuting time and well-being in Korea.
However, few studies have investigated the effect of commuting time on well-being in Korea. Although we found several domestic studies on the quality of life or life satisfaction and commuting time, these studies had limitations, such as using measures, wherein it was difficult to assess well-being, and having participants limited to those living in the capital area.202122 One study used national data on sleep problems, not well-being.23 Moreover, to our knowledge, no study has explored these variables in regional differences. Given the lack of research on the relationship between well-being and commuting time in Korea, we believe further investigation is warranted.
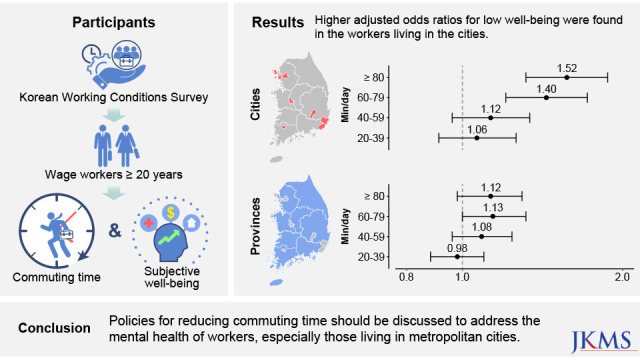
The aim of our study was to investigate the relationship between commuting time and subjective well-being of Korean workers, and to observe how these effects differ depending on regional urbanization differences.
METHODS
Participants
This study analyzed data from the sixth Korean Working Conditions Survey (KWCS) conducted in 2020 by the Occupational Safety and Health Research Institute. The KWCS was designed to improve the understanding of the overall work environment, such as work and employment types, occupation, industry, and exposure to risk factors, benchmarking the European Working Conditions Survey and the Labor Force Survey in the United Kingdom. Via multistage systematic cluster sampling, one-on-one interview surveys were conducted through a household visit by a trained interviewer for 50,538 employees aged 15 years or older, from 17 cities and provinces nationwide.
Of the 50,538 respondents of the sixth KWCS, this study selected wage workers over the age of 20 (n = 32,916). Self-employed persons without employees, self-employed persons/business owners with employees, unpaid family workers, and other workers were excluded from the study. Further, those who did not respond to any of the questions about the variables used in this study or did not answer or refused to answer were excluded from this study (n = 3,057). Respondents having a commuting time of 0 minutes or working from home were excluded (n = 401). Finally, data of 29,458 wage workers were analyzed.
Measures
Commuting time
Participants responded to the following question: “How many minutes does your total commute usually take per day?” Responses were collected as continuous variables and we categorized them for analysis. Self-reported commuting time was divided into five groups: < 20, 20–39, 40–59, 60–79, and ≥ 80 minutes per day.
Subjective well-being
Subjective well-being was measured using the World Health Organization (WHO)-5 Well-Being Index Questionnaire. This tool consists of five items indicating respondents’ emotional well-being over the past 2 weeks: 1) felt cheerful and in good spirits, 2) felt calm and relaxed, 3) felt active and vigorous, 4) woke up feeling fresh and rested, and 5) had a daily life that was filled with things that interested them. Each item is rated on a 6-point scale: “all of the time” (5 points), “most of the time” (4 points), “more than half the time” (3 points), “less than half the time” (2 points), “some of the time” (1 point), and “at no time” (0 points). The total possible score ranges from 0–25 points. A high total score indicated good subjective well-being, and a score of less than 13 points implied low well-being with a high risk for depression.24
Regional aspects considering urbanization
Based on administrative divisions under Korea’s local autonomy act, 17 cities and provinces were divided into 2 groups: the cities included the special metropolitan city (Seoul), metropolitan cities (Busan, Daegu, Incheon, Gwangju, Daejeon, and Ulsan) and the special self-governing city (Sejong), and the provinces (Gyeonggi, Gangwon, Chungbuk, Chungnam, Jeonbuk, Jeonnam, Gyeongbuk, Gyeongnam, and Jeju). The population density of Korea is 515.2 people/km2, and the average population density of the cities and the provinces are 4121.4 and 343.7, respectively.25
Covariates
Participants’ general and occupational characteristics were designated as covariates. General characteristics included sex, age, presence of spouse, educational background, self-rated health, residence, caring for children, and housework. Age was classified into the following groups: “20−29 years,” “30−39 years,” “40−49 years,” “50−59 years,” and “60 years or older.” Presence of spouse was classified as “yes” or “no.” Educational background was classified as “high school or less” and “college or above.” To determine self-rated health, participants were asked, “How is your health overall?” Responses of “very good” and “good” were classified as “good self-rated health,” while responses of “fair,” “bad,” and “very bad” were classified as “poor self-rated health.” Caring for children and housework were assessed using the following questions: ‘How often are you involved in caring for and/or educating your children, grandchildren outside work’? and ‘How often are you involved in cooking and housework outside work’? Responses were classified as Yes (‘Everyday’, ‘several times a week’, ‘several times a month’) and No (‘Rarely’, and ‘Never’).
Occupational characteristics included occupation, employment status, weekly working hours, number of employees, shift work, monthly income, and contribution to household income. Occupations were classified based on nine occupations from the Korean Standard Classification of Occupations. Managers, professionals and related workers, and clerks were classified as “white-collar workers;” service workers and sales workers as “pink-collar workers”; and skilled workers in agriculture, forestry and fishery, craftsmen and related technical workers, equipment/machine operation and assembly workers, and elementary workers as “blue-collar workers.” Employment status was classified into 2 groups: “regular workers” and “temporary or daily workers.” In Korea, working 40 hours per week is regarded as standard work, and up to 12 hours per week of overtime is permitted by law. Therefore, responses were classified as “40 hours or less,” “41−52 hours,” and “over 52 hours.” Number of employees was classified based on the number of current employees in the participant’s workplace and categorized as “less than 10,” “10−299,” and “300 or more.” Shift work status was divided into groups of “yes” and “no.” Monthly income was classified as “less than 2 million won,” “2−2.99 million won,” and “3 million won or more.” The participants were asked “Do you contribute the most to household income among household members?” and answered “yes” or “no/equal.”
Statistical analyses
Survey sample weights were used in all analyses. All variables were analyzed using the χ2 test to examine differences in general characteristics, occupational characteristics and commuting time between the low and high well-being groups. Multiple logistic regression analysis was used to calculate the adjusted odds ratios (aORs), 95% confidence intervals (95% CIs) for the relationship between commuting time and well-being, and linear trend tests were also conducted. The group with < 20-minutes of commuting time was used as the reference group. The aOR was adjusted for sex, age, spouse status, education level, income, contribution to household income, working hours, number of employees, occupation, employment status, shift work, self-rated health, caring for children, and housework. P values less than 0.05 were regarded as statistically significant. All statistical analyses were performed using R version 4.2.1 (R Foundation for Statistical Computing, Vienna, Austria).
RESULTS
The characteristics of the study population according to subjective well-being are shown in Table 1. After applying the weights, data of 33,859 workers (19,281 men, 14,578 women) were analyzed. Low well-being was found in 30.8% and 29.8% of men and women, respectively. Distributions of all general and occupational factors except for sex, presence of spouse, and commuting time, were significantly different according to well-being. The workers who were older, had lower educational levels, reported poor self-rated health status, were not involved in caring for children and housework, and resided in the provinces had lower well-being. Regarding occupational characteristics, workers with blue collar jobs, temporary/part-time jobs, long working hours, employed in small companies, performing shift work, low income, and who contributed the most to household income had lower well-being.
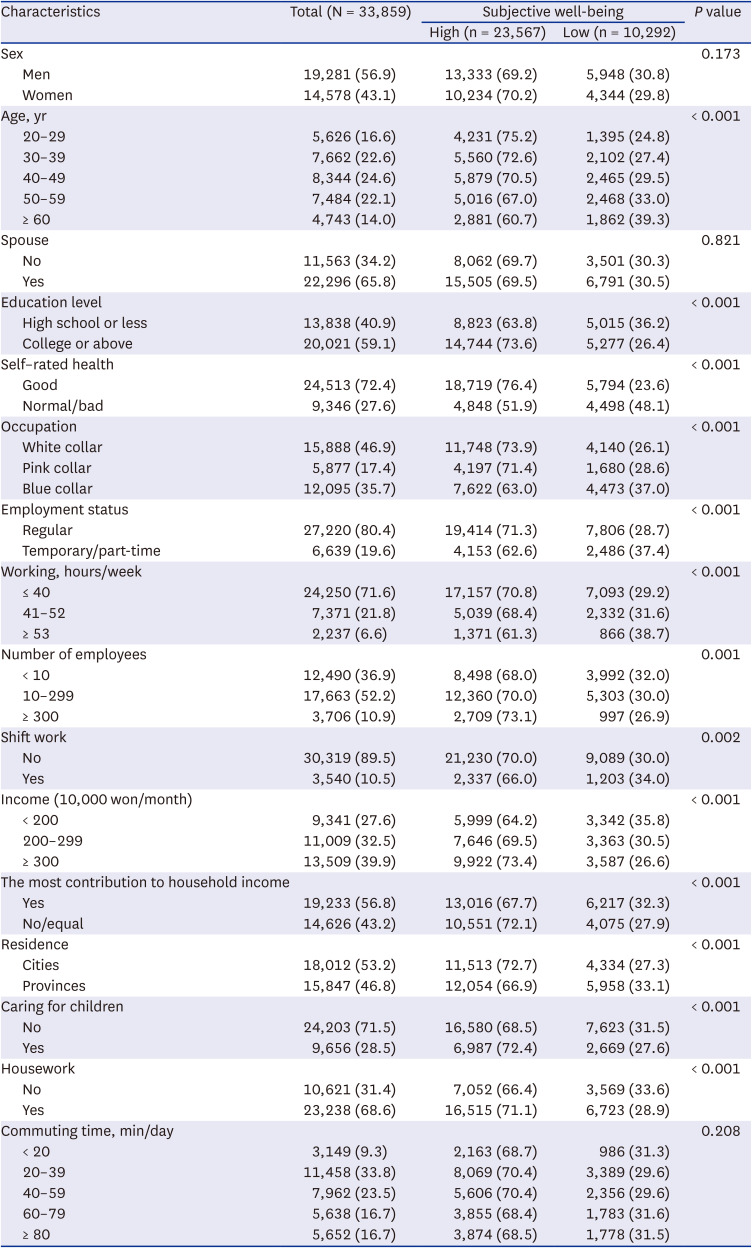
Table 1
Characteristics of the study population according to subjective well-being
Data are shown as numbers (%), not otherwise specified. All numbers reflect weighted frequencies rounded to the nearest whole number.
![]()
The distributions of commuting time by sex and region, which are the main independent variables, are shown in Table 2. The percentage of men who had a long commuting time of more than 60 minutes was higher than women. While 37.0% of people living in the cities commuted for more than 60 minutes, in the provinces, the proportion of long commutes over an hour was 30.2%. The results of considering gender and region simultaneously are presented as a Supplementary Table 1.
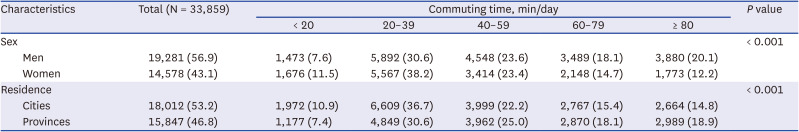
Table 2
Distribution of commuting time by sex and regions
Data are shown as numbers (%), not otherwise specified. All numbers reflect weighted frequencies rounded to the nearest whole number.
![]()
Table 3 gives the aORs and 95% CIs of well-being according to sex. Significantly higher aORs were found among the workers with 60–79 (aOR, 1.23; 95% CI, 1.11–1.36) and ≥ 80 minutes (aOR, 1.28; 95% CI, 1.16–1.42) of commuting time, as well as among female workers with 40–59 (aOR, 1.19; 95% CI, 1.04–1.37), 60–79 (aOR, 1.32; 95% CI, 1.13–1.52) and ≥ 80 minutes (aOR, 1.53; 95% CI, 1.31–1.79) of commuting time. Although there were no significant differences in the proportion of low well-being among the men workers, commuting time followed a linear relation with well-being score in our study (P < 0.001 trend in both men and women).
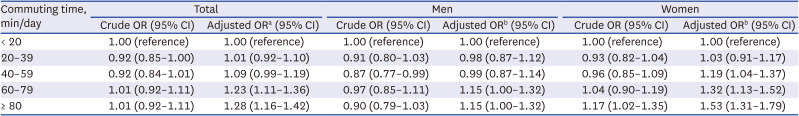
Table 3
Adjusted OR and the 95% CI of low well-being according to commuting time by sex
OR = odds ratio, CI = confidence interval.
aAdjusted for sex, age, spouse status, education level, income, contribution to household income, working hours, number of employees, occupation, employment status, shift work, self-rated health, caring for children, housework, and region.
bAdjusted for age, spouse status, education level, income, contribution to household income, working hours, number of employees, occupation, employment status, shift work, self-rated health, caring for children, housework, and region.
![]()
Table 4 represents the adjusted ORs and 95% CIs of well-being according to region and sex. In the cities, longer commuting time of an hour or more showed higher aORs with 1.40 (1.19–1.65), 1.52 (1.29–1.79) for 60–79, and ≥ 80 minutes, respectively. Conversely, all groups of longer than 20 minutes of commuting time did not show significant results among workers living in the provinces. In the cities, ≥ 80 minutes of commuting time demonstrated higher aOR in men (aOR, 1.41; 95% CI, 1.12–1.79), and long commuting time (60–79 and ≥ 80 min/day) showed increased aORs (aOR, 1.63; 95% CI, 1.30–2.05 and aOR, 1.73; 95% CI, 1.37–2.19, respectively) in women. However, significant association between commuting time and well-being was observed only in women with ≥ 80 minutes of commuting time (aOR, 1.41; 95% CI, 1.14–1.73) in the provinces.
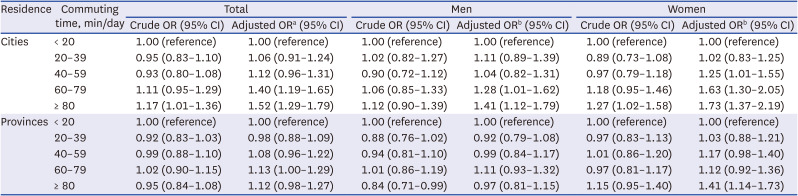
Table 4
Adjusted OR and the 95% CI of low well-being according to commuting time and regions by sex
OR = odds ratio, CI = confidence interval.
aAdjusted for sex, age, spouse status, education level, income, contribution to household income, working hours, number of employees, occupation, employment status, shift work, self-rated health, caring for children, and housework.
bAdjusted for age, spouse status, education level, income, contribution to household income, working hours, number of employees, occupation, employment status, shift work, self-rated health, caring for children, and housework.
![]()
DISCUSSION
In this study, we found a negative effect of commuting time on well-being in Korean workers. In particular, we found that a long commute of more than 60 minutes was significantly related to low well-being. These results are in line with previous findings that satisfaction with life and happiness decreases when commuting time increases over an hour.2627 Our findings were especially apparent in workers living in the cities. Of these workers, female workers were at a greater risk of low well-being, when commuting time increased.
Some possible mechanisms can be considered for the relationship between long commuting time and poor well-being. First, longer commuting time is associated with reduced time for physically active leisure and social activity.2829 Lack of time for hobbies with family or friends hampers stress relief, and negatively affects mental health.30 Second, long commuting time is related to sleep problems.2331 Low quality of sleep could be part of the negative effect of commuting time on low well-being. Additionally, exposure to annoying environments such as noise, vibration, uncomfortable posture, and unintended contact with others on commuting can also be a direct cause of poor well-being.532
However, the impact of commuting time on well-being was different according to sex. While the risk of low well-being increased according to commuting time in women, the risk of low well-being was not associated with commuting time in the male workers. Women workers tend to be more stressed about commuting than men.3334 Even after work ends, women often carry the burden of housework and childcare.35 Especially in a patriarchal society like Korea, gender roles mandate that women are responsible for raising children and managing households. Thus, women workers’ conflict between work and family roles may overshadow the rewards of a long commute (Supplementary Table 2).3637
After stratification by region, the impact of long commuting time and well-being was found in workers living in the cities. This result could be understood in the same context that prevalence rate of mood disorders was higher in urban environments.38 Stress factors such as traffic congestion, noise annoyance, overcrowding, and air pollution are likely to be elevated in a metropolis,39 and they have been shown to have adverse effects on mental health.4041 Therefore, long commuting time in the cities would increase workers’ exposure to these unpleasant environments and negatively affect well-being.
The impacts of commuting time on well-being were not significant in workers living in the provinces. The provinces are less urbanized areas with less traffic, and a more nature-friendly environment. Commuting within natural environments reduces stress and improves mental health.42 Therefore, it is possible that these environmental conditions offset the negative effects of commuting time. This result is consistent with the view that the quality of commuting is as important as the quantity of commuting time.8
However, in the provinces, a significantly high aOR was found among female workers with a commuting time of ≥ 80 minutes. In this study, the proportion of women workers living in the provinces, burdened with housework after work was the highest (48.1%) in the ≥ 80 minutes commuting time group, while in other commuting time groups it was 34.8% or less. Among men workers living in the provinces, the proportion of those burdened with housework after work, was likewise the highest in the ≥ 80 minutes commuting time group, but it was only 36.2%. It is thought that the work-family conflict caused by long commutes could have worsened well-being in women workers.4344
This study has several limitations. First, it is difficult to elucidate the causal relationships between commuting time and low well-being in a cross-sectional design. Further research using longitudinal designs will be required to supplement this limitation. Second, due to the limitation of data, we could not adjust the effect of several factors, such as alcohol consumption, smoking, physical activity, and underlying medical history, that could affect well-being. Instead of these variables, we included self-rated health status of the workers in our analysis model. Additionally, we could not obtain information on smaller regional units. Population and urbanization are heterogeneous depending on the city or county within a single province. Therefore, dividing regions into cities and provinces by administrative divisions, is likely to cause a misclassification bias. Considering this problem, we performed two additional analyses by dividing the regions into two groups based on Korea’s average population density, and the capital area versus the noncapital area. The results of these analyses were similar to those of this study (Supplementary Tables 3 and 4). Finally, we could not estimate the effects of commute modes. The finding that active commuting (walking or cycling) improves psychological well-being is contrary to our results.45 However, as the proportion of active commuters in Korea was only 15.13%,46 we believe that this did not have a decisive effect on our findings.
One of the major strengths of this study was that various socioeconomic and occupational factors were included as confounding factors. There have been controversies about the relationship of commuting time and well-being because the benefits of commuting in terms of employment, income, and housing compensate for its negative aspects.2147 Similarly, we were unable to find the relationship of commuting time and well-being through crude analysis. However, the relationship became significant by controlling for the compensating factors of long commuting. Additionally, we found that regional differences play a role in the relationship between commuting time and well-being. The other strength of this study was that well-being was evaluated using the WHO-5 Well-Being Index, which is a clinically applicable scale. Lastly, this study was the first to examine the association between commuting time and well-being in relation to regional differences in the whole country through large, nationally representative data in Korea.
In summary, this study demonstrates that a long commuting time is negatively associated with well-being in Korean wage workers. Policies for reducing commuting time should be discussed for the mental health of workers, especially those living in the cities.
 XML Download