Journal List > Cancer Res Treat > v.55(2) > 1516082490

Hong, Cho, Yun, Lee, Kim, Baek, Kim, Lee, Choi, Kwon, Kim, and Lee: Comprehensive Molecular Characterization of Soft Tissue Sarcoma for Prediction of Pazopanib-Based Treatment Response

Abstract

Purpose

Even though pazopanib, a multitargeted tyrosine kinase inhibitor, has been approved for refractory soft tissue sarcoma (STS), little is known about the molecular determinants of the response to pazopanib. We performed integrative molecular characterization to identify potential predictors of pazopanib efficacy.

Materials and Methods

We obtained fresh pre-treatment tumor tissue from 35 patients with advanced STS receiving pazopanib-based treatment. Among those, 18 (51.4%) received pazopanib monotherapy, and the remaining 17 (48.6%) received pazopanib in combination with durvalumab, programmed death-ligand 1 blockade. Whole-exome and transcriptome sequencing were performed for each tumor and patient germline DNA.

Results

Of the 35 patients receiving pazopanib-based treatment, nine achieved a partial response (PR), resulting in an objective response rate (ORR) of 27.3%, and the median progression-free survival (PFS) was 6.0 months. Patients with CDK4 amplification (copy ratio tumor to normal > 2) exhibited shorter PFS (3.7 vs. 7.9 months, p=2.09×10⁻⁴) and a poorer response (ORR; 0% vs. 33.3%) compared to those without a gene amplification (copy ratio ≤ 2). Moreover, non-responders demonstrated transcriptional activation of CDK4 via DNA amplification, resulting in cell cycle activation. In the durvalumab combination cohort, seven of the 17 patients (41.2%) achieved a PR, and gene expression analysis revealed that durvalumab responders exhibited high immune/stromal cell infiltration, mainly comprising natural killer cells, compared to non-responders as well as increased expression of CD19, a B-cell marker.

Conclusion

Despite the limitation of heterogeneity in the study population and treatment, we identified possible molecular predictors of pazopanib efficacy that can be employed in future clinical trials aimed at evaluating therapeutic strategies.

Introduction

Soft tissue sarcoma (STS) comprises diverse histological subtypes with distinct clinical and molecular features. Despite the heterogeneity, patients with advanced STS are generally treated in the same manner, mainly using doxorubicin- or ifosfamide-based regimens [1,2]. Gemcitabine, docetaxel, as well as taxane are the available treatment options after failure of the fist-line treatment. However, despite several treatment possibilities, the prognosis of STS remains poor with a median overall survival (OS) of 12 months [3].
Pazopanib is multitargeted tyrosine kinase inhibitor active against vascular endothelial growth factors, platelet-derived growth factors, fibroblast growth factor receptors, and c-Kit. Given the histological heterogeneity of STS, pazopanib has exhibited therapeutic activity against various subtypes except for liposarcoma in a stratified phase II trial [4]. A subsequent phase III PALETTE trial was designed for patients with non-adipocytic STS who had not benefited from standard chemotherapy. Progression-free survival (PFS) was improved by 3 months relative to placebo [5]. Beside tyrosine kinase inhibitors, immune checkpoint inhibitors have also demonstrated promising efficacy with respect to various STS subtypes. For advanced bone and soft tissue sarcomas, monotherapy with pembrolizumab, an anti–programmed death-1 (PD-1) antibody, was associated with clinically meaningful efficacy. However, the observed efficacy was mostly limited to specific tumor subtypes, including undifferentiated pleomorphic sarcoma (UPS), dedifferentiated liposarcoma, and synovial sarcoma (SS) [6]. Nivolumab—another anti–PD-1 monoclonal antibody—in combination with cytotoxic T lymphocyte antigen-4 inhibitor ipilimumab has also exhibited therapeutic activity in advanced STS [6]. These results led to the regulatory approval of pazopanib and immune checkpoint inhibitors as standard treatments for refractory STS.
The Cancer Genome Atlas (TCGA) Research Network has provided molecular insights into the major subtypes of STS [7]. The multi-platform genomic profiles revealed a high frequency of copy number alterations and low mutational burdens for sarcoma, as well as other subtype-specific genomic features. However, even though pazopanib is the only approved targeted agent for this disease, little is known about the genetic feature for response discrimination in STS.
In the current study, we performed integrated molecular profiling of advanced STS in response to pazopanib-based treatment. All patients were subjected to tissue biopsies followed by whole-exome and transcriptome sequencing. We also conducted integrative analysis to explore specific genomic markers correlated with response to pazopanib-based treatment in an attempt to identify biomarkers that could aid the therapeutic strategies.

Materials and Methods

1. Patient and study procedure

We reviewed and included patients with histologically confirmed metastatic and/or recurrent STS as per the following inclusion criteria: (1) eligible for pazopanib treatment, and (2) willingness to undergo a procedure for fresh-frozen tissue collection for clinical sequencing. Clinical information including age, sex, etiology, Eastern Cooperative Oncology Group performance status, Fédération Nationale des Centres de Lutte Contre le Cancer (FNCLCC) system, staging, and previous treatment data were extracted from hospital records. The trial protocol was approved by the Institutional Review Board of each center, and all patients provided written informed consent before enrollment in accordance with the Declaration of Helsinki and the Guidelines for Good Clinical Practice.

2. Tumor sample collection for whole-exome and transcriptome sequencing

Biopsies were performed prior to initiation of pazopanib-based treatment. If tumor content was estimated to be ≥ 40% after pathological review, tumor DNA and RNA were extracted from freshly obtained tissues using a QIAamp Mini Kit (Qiagen, Hilden, Germany) according to the manufacturer’s instructions. For DNA isolation, we used RNaseA (cat. #19101, Qiagen). We determined the concentrations and absorbance ratios, OD260/OD280 and OD260/OD230, on an ND1000 spectrophotometer (NanoDrop Technologies, Thermo-Fisher Scientific, Waltham, MA) and quantified DNA/RNA using a Qubit fluorometer (Life Technologies, Carlsbad, CA). Analysis pipeline details for sequencing are available online in the Supplementary Methods.

3. Statistical analysis

PFS was defined as the time from the start of pazopanib-based treatment until the date of disease progression or death resulting from any cause. OS was measured from the start of treatment to the date of death due to any cause. Survival difference was assessed using the log-rank test. Objective response rate (ORR) was calculated as the percentage of patients experiencing a confirmed complete response or partial response (PR) as per the Response Evaluation Criteria in Solid Tumors 1.1 guidelines. The significance of multiple predictors of survival was assessed by Cox regression analysis. p < 0.05 was considered to indicate a significant difference. All statistical analyses were performed using R3.5.3 and RStudio v1.2 (R Foundation for Statistical Computing, Vienna, Austria).

Results

1. Clinical and pathological characteristics of sarcoma patients

Between September 2014 and December 2019, patients with unresectable or metastatic STS (n=199) received pazopanib-based treatment. Among those, fresh tumor and peripheral blood samples were obtained from a total of 35 patients and were subjected to whole-exome and transcriptome sequencing (CONSORT) (S1 Fig). Samples were obtained in patients with primary tumors (n=16) and metastases (n=19). Of these patients, 18 (51.4%) received pazopanib monotherapy, and the remaining 17 (48.6%) received pazopanib in combination with durvalumab after the biopsies had been collected for sequencing. Commonly observed histologies included leiomyosarcoma, (n=8), UPS (n=7), malignant peripheral nerve sheath tumors (MPNST; n=5), and dedifferentiated liposarcoma (DDLPS; n=5) as shown in Table 1. The majority were of high pathological grade (FNCLCC grade 3, n=23, 65.7%), and 45.7% had developed in the upper or lower abdomen. All patients had previously received at least one line of chemotherapy, mainly doxorubicin- and/or ifosfamide-based treatment.

2. Molecular characterization and response to pazopanib-based treatment

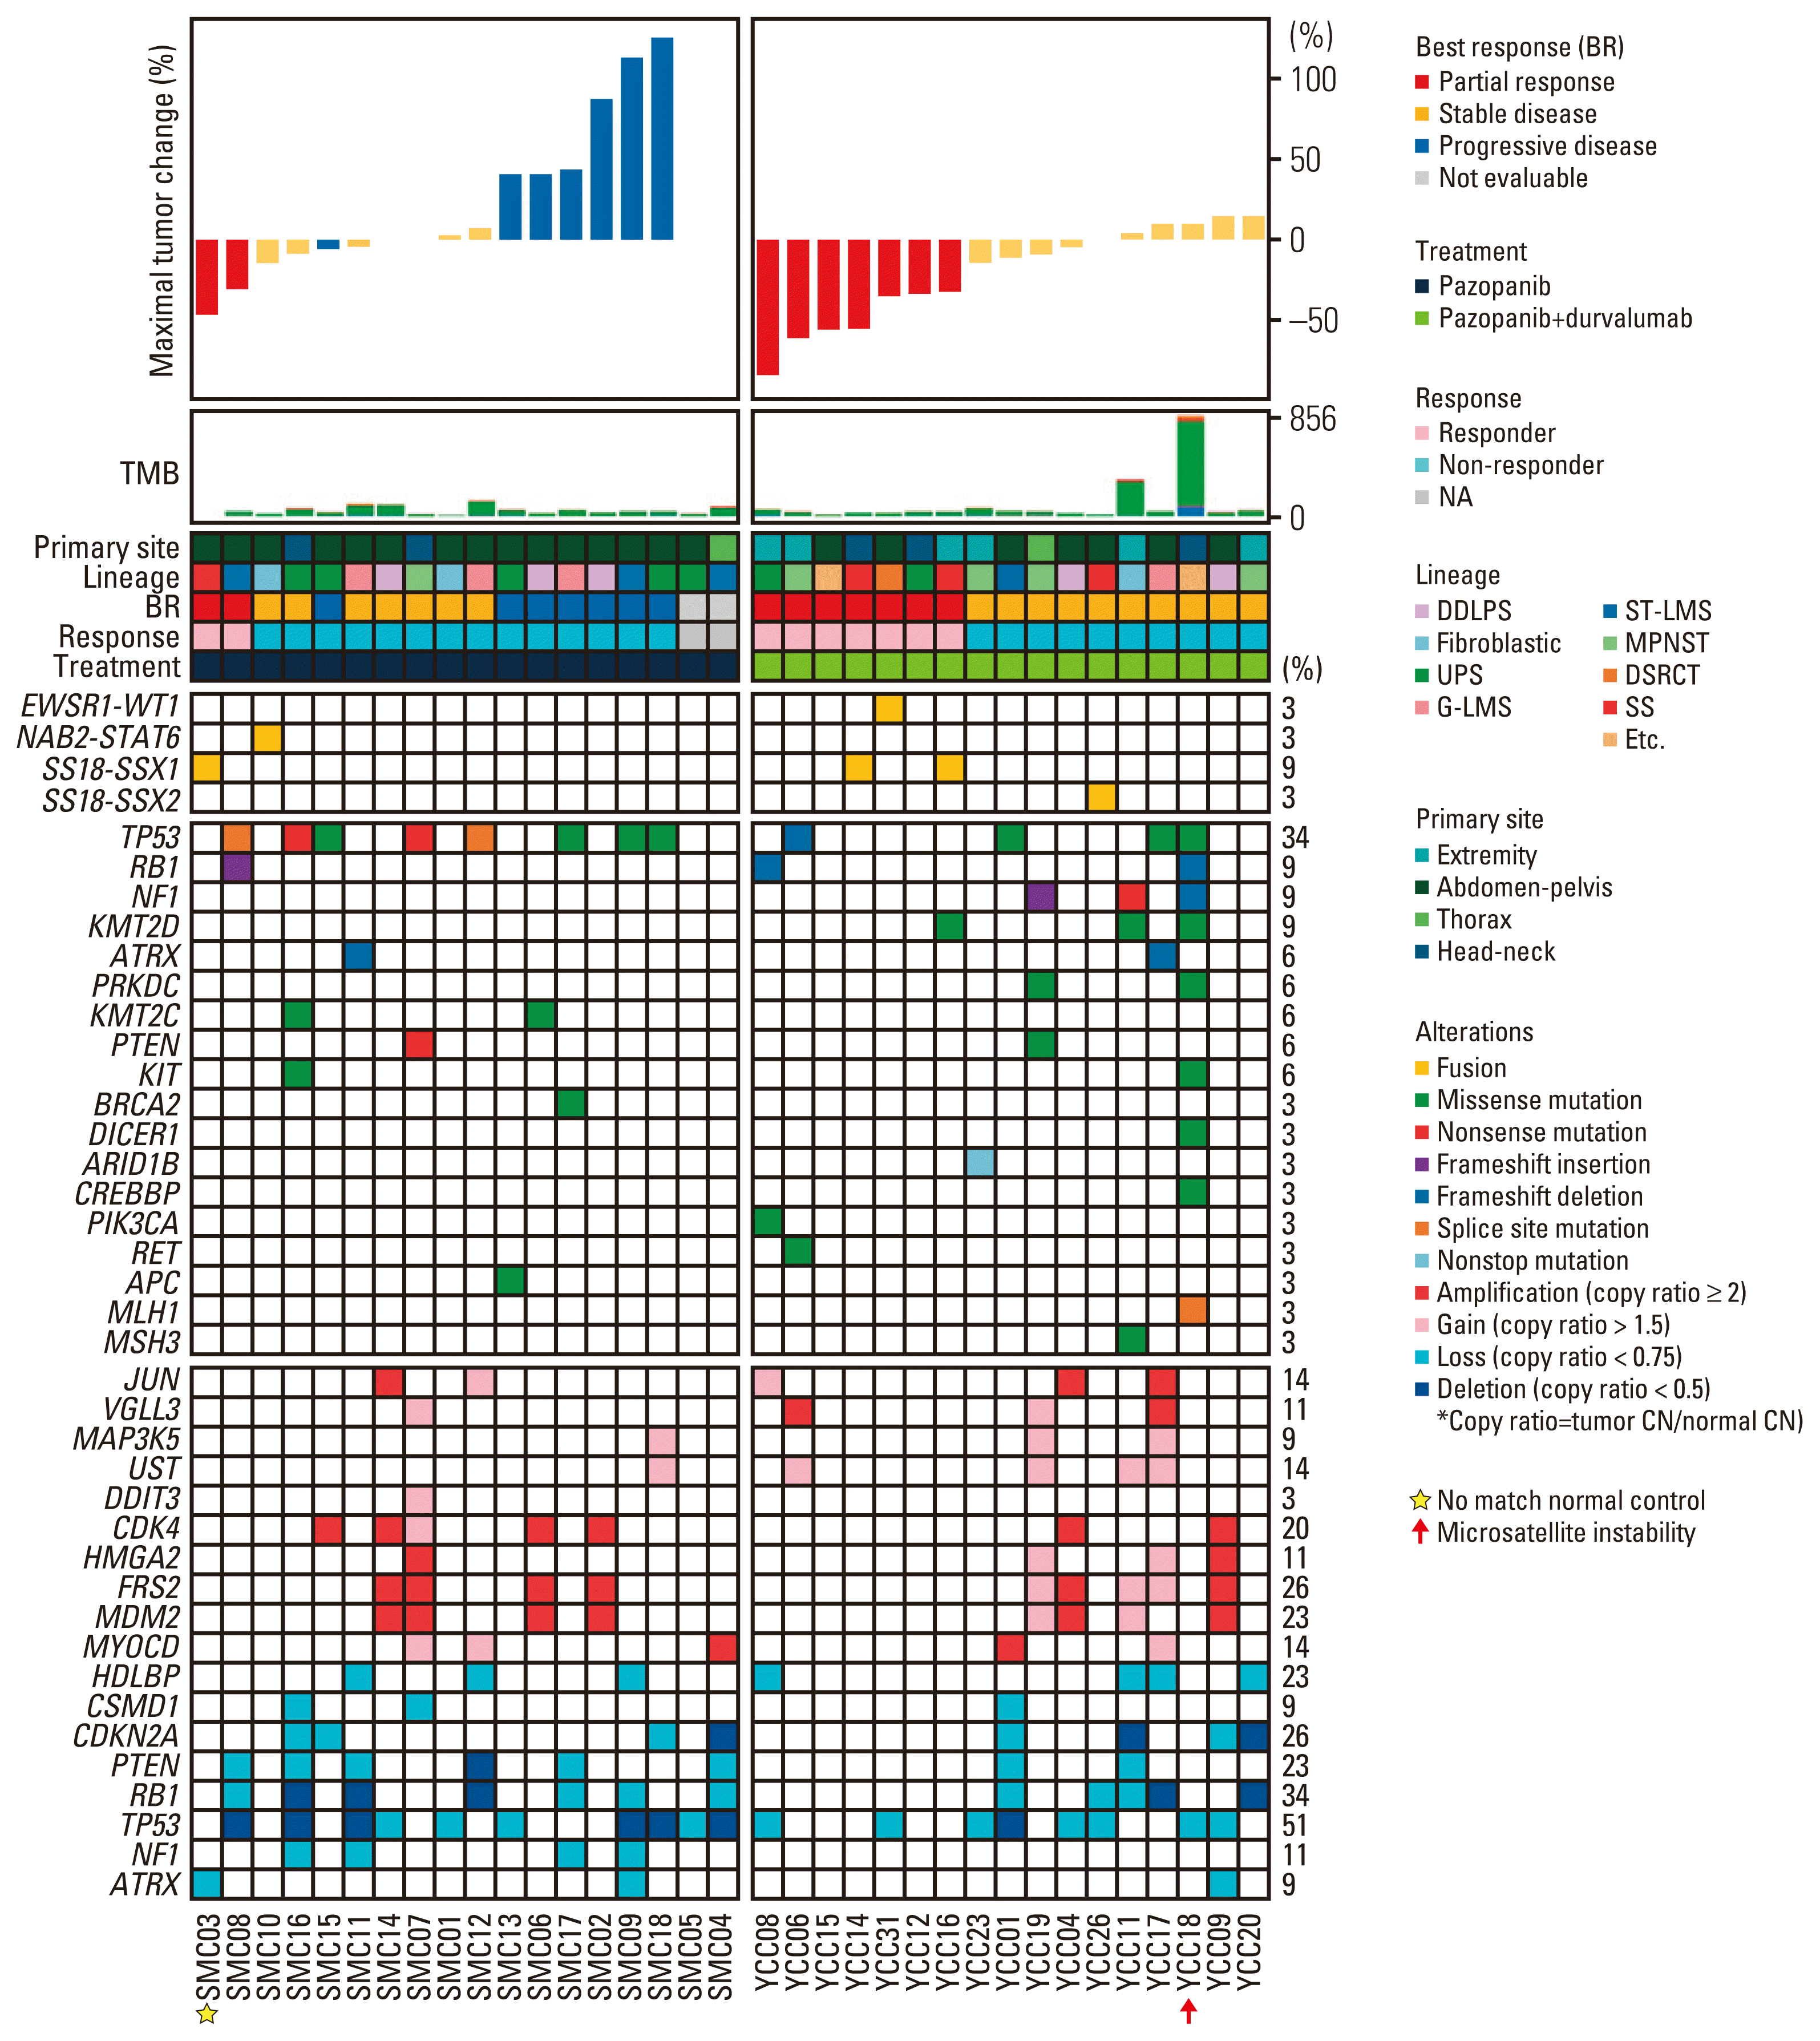
Data collection proceeded until April 31, 2020 with a median follow-up of 40.9 months (95% confidence interval [CI], 38.2 to 55.9). Of the 33 evaluable patients, nine achieved a PR, 17 had stable disease, and seven had progressive disease, resulting in an ORR of 27.3 % (Fig. 1). In the monotherapy group, two of the 16 evaluable patients (12.5%) achieved a PR, 2.0 and 3.6 months after initiating treatment, and this lasted for 18.1 and 15.9 months for soft tissue leiomyosarcoma and SS, respectively (Fig. 2A and B). In the combination group, seven out of the 17 patients (41.2%) achieved a PR, including patients with UPS (n=2), SS (n=2), MPNST (n=1), a desmoplastic small round cell tumor (n=1), and endometrial stromal cell sarcoma (n=1). Response was first detected 1.1–2.7 months after treatment initiation and lasted for a median of 7.8 months (range, 2.5 to 17.1 months) (Fig. 2B and C).
Twenty-nine patients (75.0%) had progressive disease, and the median PFS was 5.9 months (95% CI, 3.3 to 8.6) in the monotherapy group and 6.9 months (95% CI, 3.5 to 10.3) in the combination group. Median OS was 19.5 months (95% CI, 16.7 to 22.3) in the monotherapy group, and was not reached in the combination group.

3. Genomic landscape and correlates of pazopanib efficacy

We first evaluated the genomic alterations in the somatic mutation spectrum, somatic copy number alterations (SCNAs), and fusion transcripts in all 35 patients (Fig. 1, S3 Table). Mutations in genes involved in telomere stabilization and double-strand repair, including TP53 (34%), NF1 (9%), ATRX (6%), and PRKDC (6%) were most prevalent in leiomyosarcomas (LMS), UPS, and MPNST. The overall somatic mutational burden was similar to that of the TCGA sarcoma (SARC) dataset with a relatively low tumor mutational burden compared to other cancer types (median, 40.5 non-synonymous mutations) (S4 Fig). However, there was one case of clear cell sarcoma (YCC#18) that was hypermutated (856 non-synonymous mutations), including an MLH1 splice site mutation (Fig. 1). Mutational signature analysis revealed that DNA mismatch repair deficiency with microsatellite instability contributed to genomic instability in the YCC#18 sample (S5A and S5B Fig.).
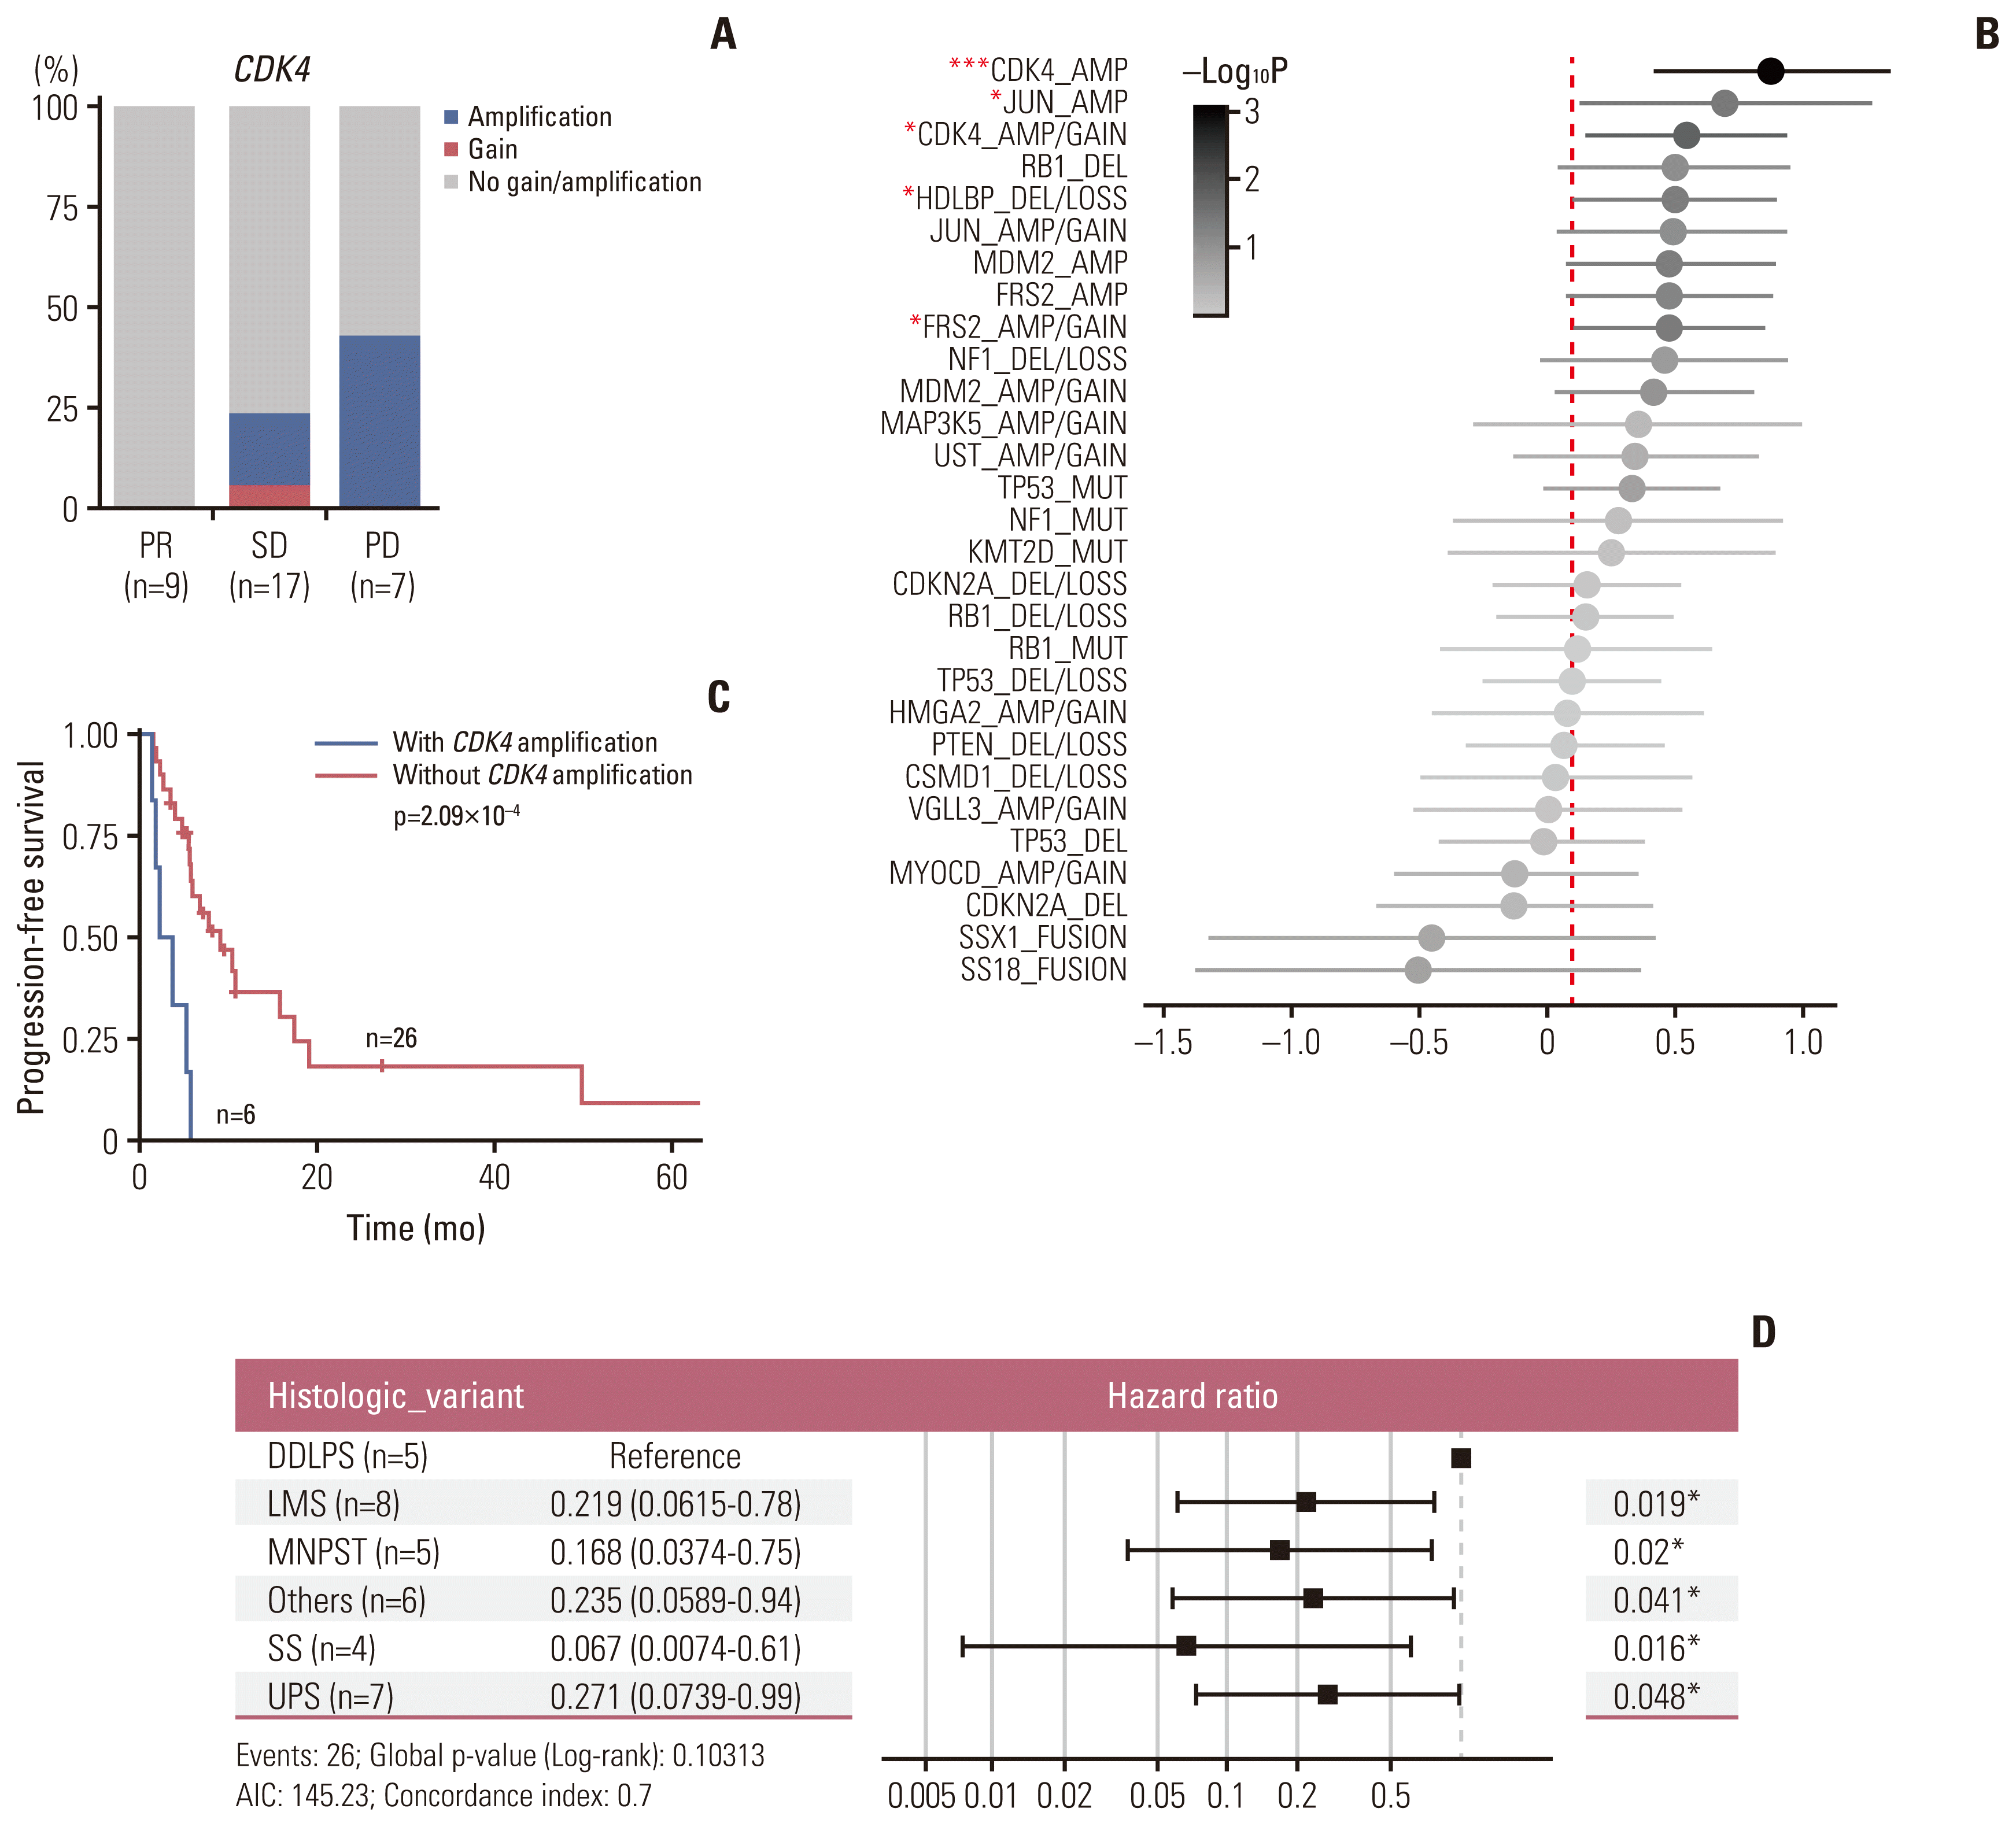
Frequently observed SCNAs included 12q13-15 copy number gains or amplifications of genes CDK4, MDM2, FRS2, as well as HMGA2 (Fig. 1). Interestingly, four cases initially diagnosed as SS (n=1, YCC#4), MPNST (n=1, SMC#6), UPS (n=1, SMC#14), and LMS (n=1, YCC#9) were revised as DDLPS (n=4) based on molecular results with CDK4 and MDM2 co-amplification. Patients with CDK4 amplification exhibited a poor response to pazopanib treatment, in which none of the nine partial responders had CDK4 amplification (Fig. 3A). A univariate Cox regression analysis revealed that CDK4 amplifications was predictive factors of poor PFS (hazard ratio [HR], 0.35; 95% CI, 0.14 to 0.86) (Fig. 3B). Cases with CDK4 amplification (n=6, copy ratio tumor to normal > 2.0) had significantly shorter PFS when compared to non-amplified (n=9, copy ratio tumor to normal ≤ 2.0) cases (CDK4: 3.7 vs. 7.9 months, p=2.09×10⁻⁴) (Fig. 3C). Among the six cases with CDK4 amplifications, five (83.3%) were DDLPS, and those showed poorer PFS than any other subtypes (Fig. 3D). The other UPS with CDK4 amplification (SMC#15) showed 2.3 months of PFS, suggesting that CDK4 may play a role as a poor predictor for pazopanib treatment.
Similary, cases with FRS2 gain or amplification (n=9, copy ratio tumor to normal > 1.5) had significantly shorter PFS when compared to non-amplified (n=26, copy ratio tumor to normal ≤ 1.5) cases (3.7 vs. 7.9 months, p=0.038) (S6A Fig.). On the other hand, patients with copy loss or deletion of the HDLBP gene (n=8, copy ratio tumor to normal < 0.75), located on chromosome 2q37.3, exhibited poor PFS (p=0.036) in both univariate and multivariate Cox regression survival analysis, suggesting that HDLBP may play a role as a tumor suppressor in STS (HR, 0.39; 95% CI, 0.16 to 0.99) (S6B and S6C Fig.). However, tumor response to treatment was not significantly different (ORR, 12.5% vs. 32.0%, p=0.39 by chi-square test). However, in covariate Cox regression analysis with the histologic variants, CDK4 and FRS2 amplifications were not associated with PFS (S6C Fig.).
We further analyze the clinical outcomes of all patients and pazopanib monotherapy patients according to the TP53 mutational status. However, tumor response to treatment was not significantly different between mutant and wild-type in all patients (ORR, 16.7% vs. 33.3%, p=0.43 by Fisher exact test) and pazopanib monotherapy patients (ORR, 12.5% vs. 12.5%, p > 0.99 by Fisher exact test). We could not find significant differences in PFS in all patients and pazopanib monotherapy patients (S7 Fig). We also investigated the vascular endothelial growth factor (VEGF) expression according to TP53 mutational status but could not find a statistically significant difference in the VEGF expression (S8 Fig).

4. Identification of transcriptional determinants dictating clinical response to pazopanib-based treatment

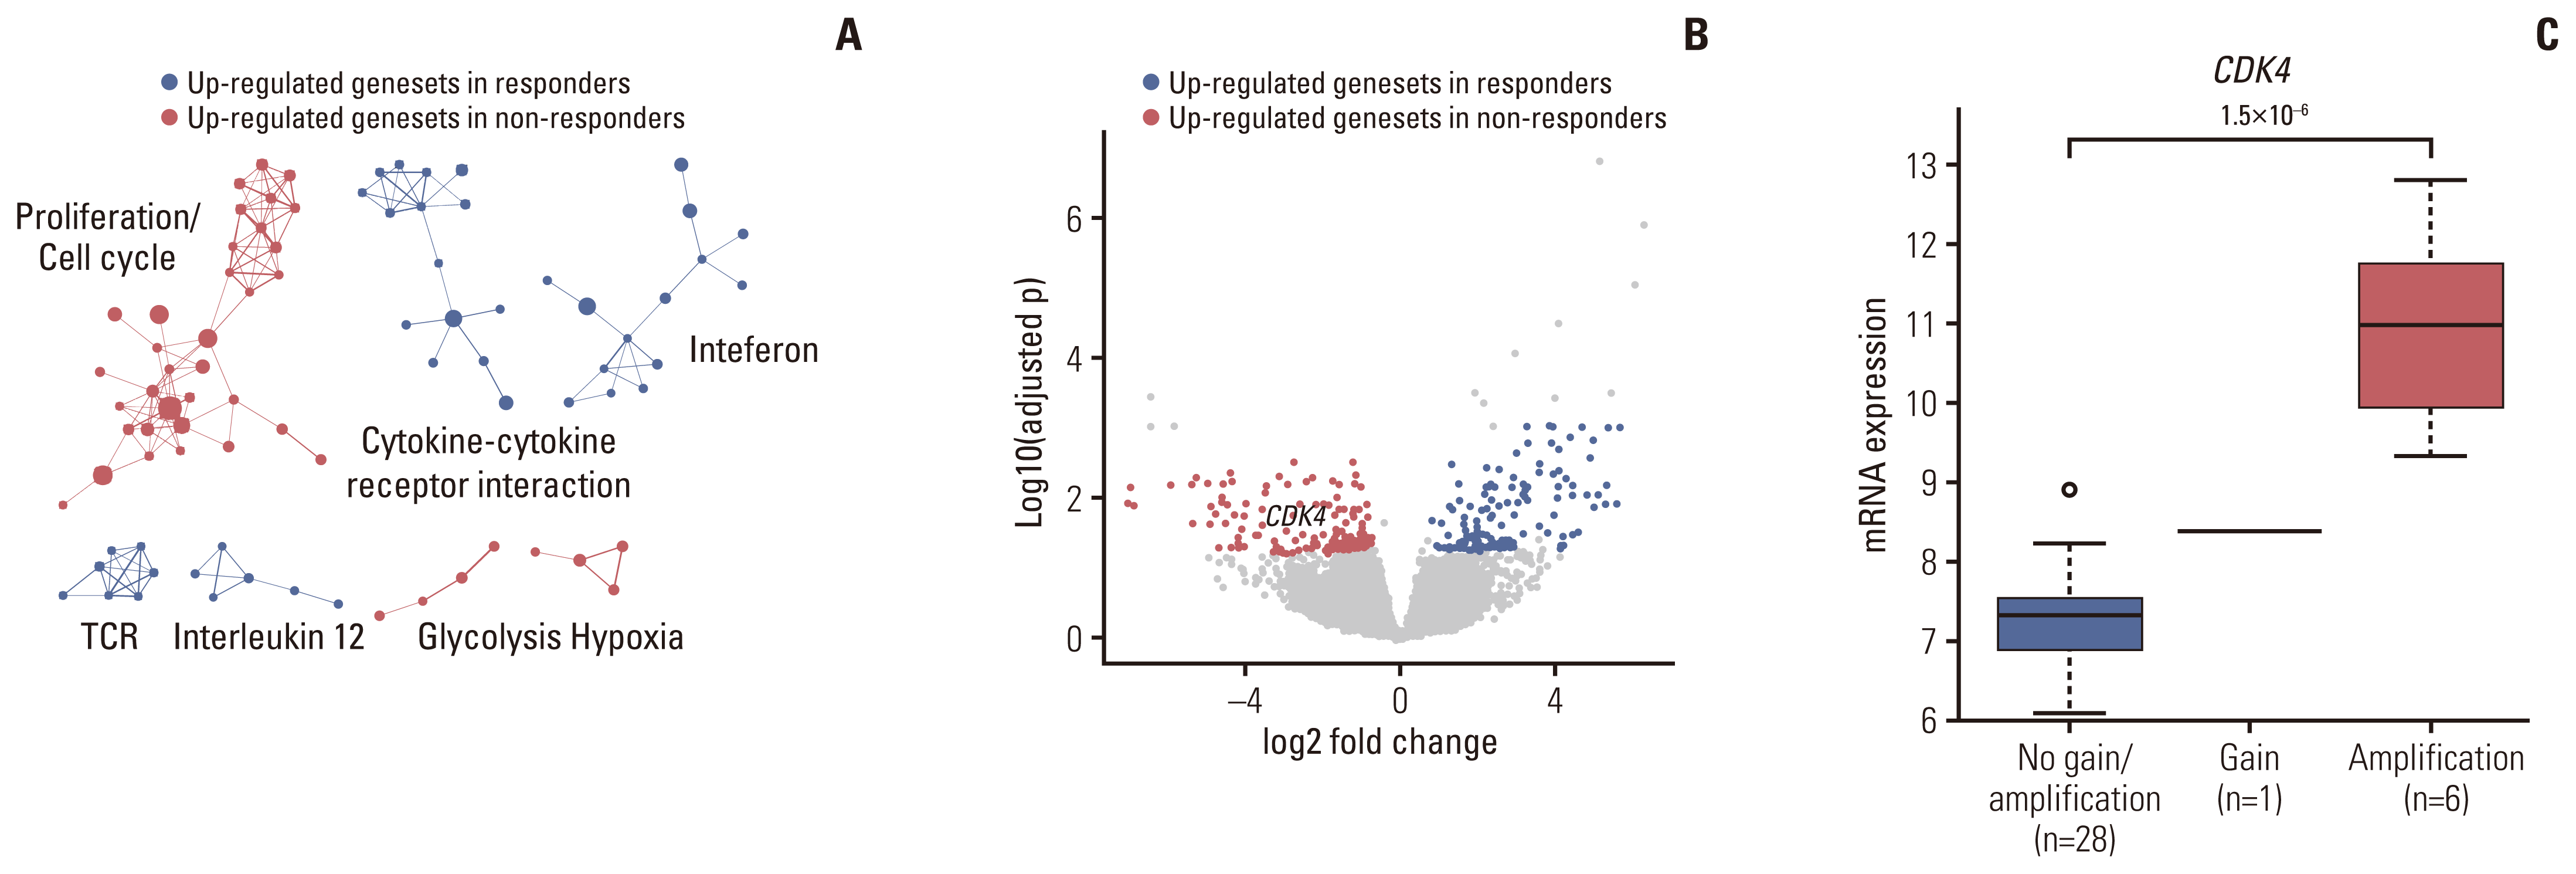
To assess distinct transcriptional features that dictate the clinical response to pazopanib, we analyzed the transcriptomic profiles of STS patients depending on their response to pazopanib. Gene Set Enrichment Analysis (GSEA) was performed to identify significantly enriched molecular pathways between responders and non-responders. GSEA revealed that gene sets associated with cell proliferation/cell cycle, hypoxia, and glycolysis were upregulated in non-responders while immune-associated gene sets were enriched in responders (Fig. 4A). Enrichment of cell cycle gene sets was observed in non-responders, which was in line with the observation that CDK4 was significantly amplified in non-responders, especially as it plays a major role in the cell cycle (Fig. 4B) [8]. Additionally, we performed genome-wide analysis of differentially expressed genes (DEGs) between pazopanib-based treatment responders and non-responders in order to identify genes that correlate with a response to pazopanib in STS. As a result, the expression of 123 and 106 genes was significantly up/downregulated (q-value < 0.05 and absolute log2 fold change > 1) in responders (responder DEGs) and non-responders (non-responder DEGs), respectively (S9 Table). CDK4 was among non-responder DEGs, concordant with the results of genomic and pathway analyses, which indicated that non-responders exhibited upregulation of CDK4 via DNA amplification, particular in DDLPS, resulting in cell cycle activation. We investigated the association between gene copy number variations and mRNA expression and found that CDK4 gene expression levels of CDK4-amplified tumors were significantly higher than those of tumors with non-amplified (Wilcoxon rank sum, p=1.5× 10⁻⁶) (Fig. 4C). The FRS2 amplification also showed consistent results (Wilcoxon rank sum, p=0.0018) but HDLBP-deletion was not significant (Wilcoxon rank sum, p=1.1×10⁻⁶) (S10 Fig.).

5. Predictors of treatment response to pazopanib and programmed death-ligand 1 blockade combination

Next, we sought to determine the potential correlates of programmed death-ligand 1 (PD-L1) blockade response using pre-treatment STS biopsies from 17 patients enrolled in the clinical trial (ClinicalTrials.gov Identifier: NCT03798106), which evaluated the efficacy of durvalumab in combination with pazopanib. Treatment consisted of pazopanib 800 mg orally, once a day, continuously, and durvalumab 1,500 mg via 60-minute intravenous infusion once every 3 weeks.
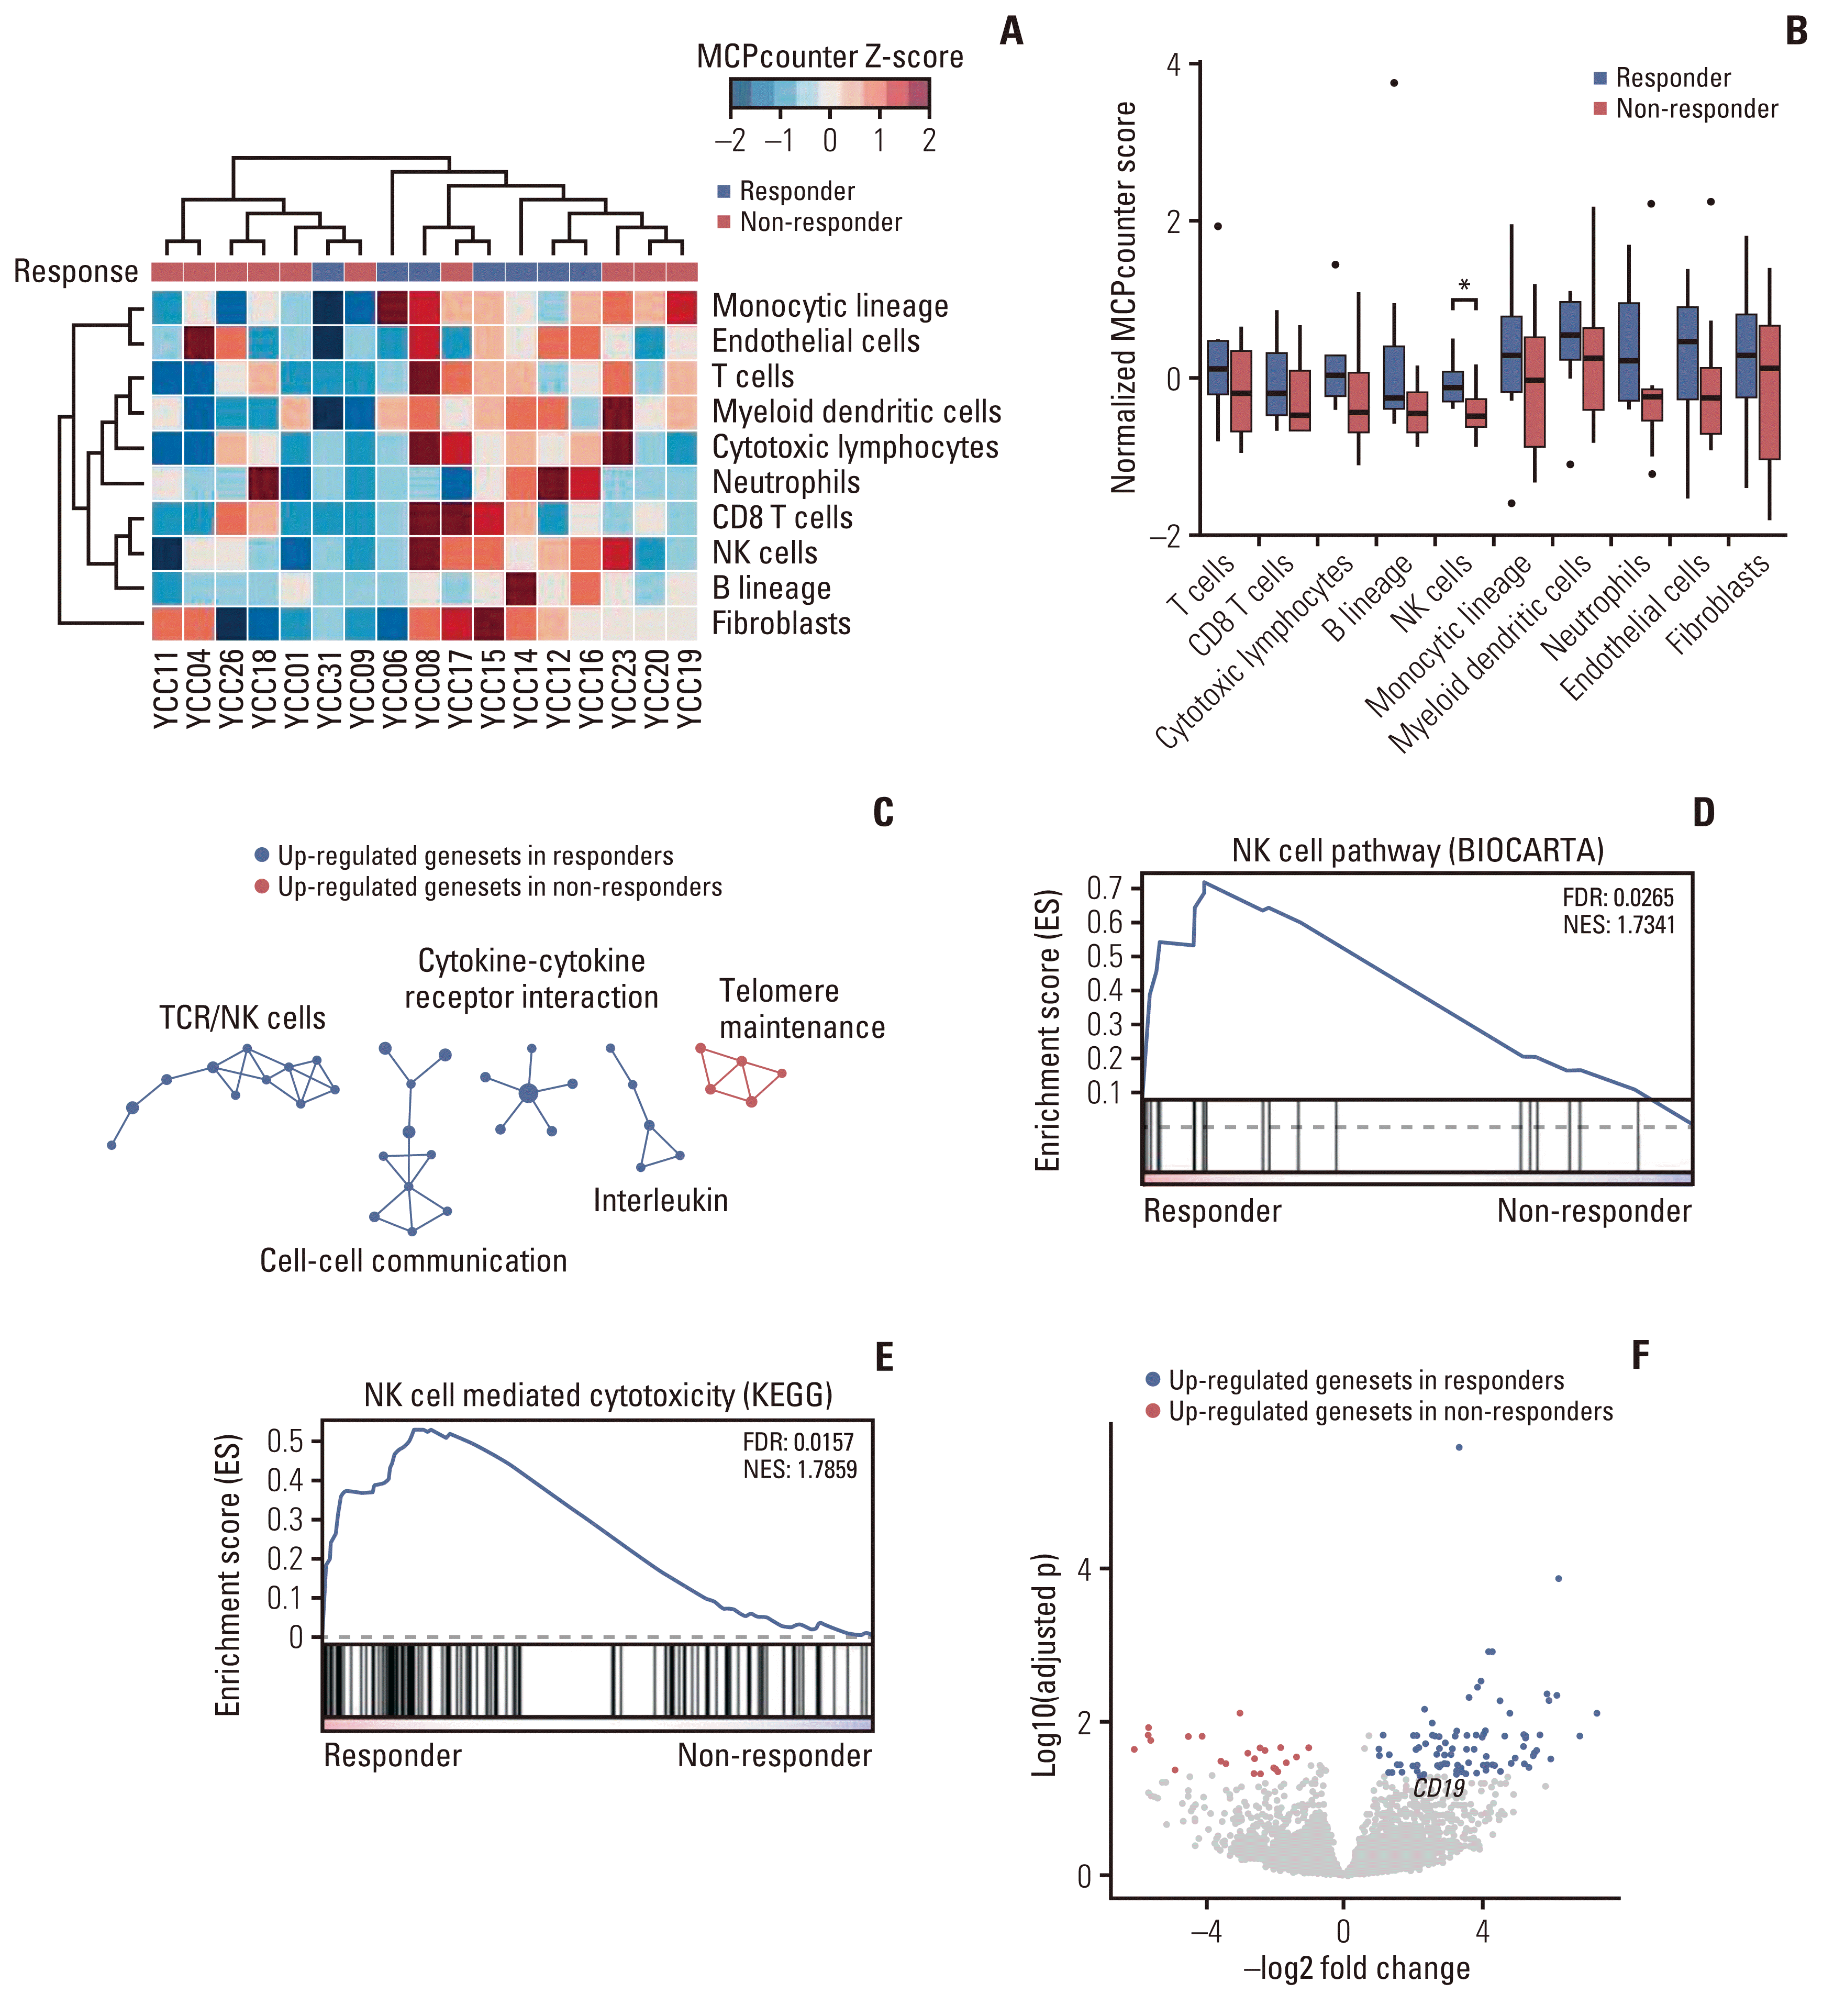
When we examined PD-1/PD-L1 gene expression via whole transcriptome sequencing, no association between pazopanib/durvalumab response and PD-1/PD-L1 expression was observed (S11 Fig.). Therefore, in order to characterize STS samples responding to the pazopanib and durvalumab combination using immunological features other than PD1/PD-L1 expression, we evaluated immune cell profiles in STS samples in silico by applying the Microenvironment Cell Populations-counter (MCPcounter) method to gene expression profiles in STS (Fig. 5A) [9]. For each cell type, the Student’s t test between responders and non-responders were performed and revealed that the MCPcounter scores for NK cells were higher in the responders (p=0.047 by Fig. 5B, p-value was not adjusted for multiple testing). In agreement with the results of tumor microenvironment cell count estimation, GSEA revealed that gene sets associated with the immune response were upregulated in responders, and, in particular, NK cell pathway enrichment was confirmed (Fig. 5C–E). DEG analysis between responders and non-responders revealed that CD19 was overexpressed in responders (Fig. 5F, S12 Table). Importantly, CD19 expression levels were not different between pazopanib-responders and non-responders (log2 fold change=0.18, false discovery rate=0.95), indicating that the differential CD19 expression between responders and non-responders may be the result of durvalumab treatment.

Discussion

Using whole-exome and transcriptome sequencing, we performed integrative molecular characterization of STS in patients receiving pazopanib-based treatment. To our knowledge, this is the first study to characterize molecular determinants of the response to pazopanib in STS.
Despite the improved PFS in the phase III trial, the response was modest, and OS was not significant, implying that only a minority of the patients benefit form pazopanib treatment. The lack of understanding of the molecular background underlying the pazopanib response represents a major challenge in STS. While previous studies have indicated clinicopathological parameters, including circulating angiogenic factors or neutrophil to lymphocyte ratio, their predictive role remains elusive [10,11]. Furthermore, the biological basis for any association with pazopanib response is still very limited. In order to identify predictive markers of the response to pazopanib, we performed integrative genomic and transcriptomic analysis of STS patients who received pazopanib-based treatment in hopes of improving the treatment choices within the clinical framework.
To date, our genome-wide analysis provided the most comprehensive dataset of STS with pazopanib-based treatment. Concordant with TCGA SARC data [12], copy number alterations and gene fusions were more prominent than activating point mutations and a low mutational burden. Furthermore, we observed that tumors with CDK4 amplification were less responsive to pazopanib. In a phase II trial, liposarcoma was identified as a non-sensitive histological subtype. The subsequent phase III PALETTE trial was conducted to investigate responses in non-adipocytic STS [4]. Consistent with our results, both well differentiated and dedifferentiated liposarcomas were characterized by chromosome 12q13-15 amplifications of oncogenes MDM2, CDK4, and HMGA2 [13] and were relatively insensitive to pazopanib [14]. Furthermore, in parallel to CDK4 overexpression, hypoxia- and glycolysis-associated genes were enriched in non-responders in our study. Importantly, these genes are known to be related to tumor cell proliferation, apoptosis inhibition, and resistance to angiogenesis inhibitors [15,16]. Aside from the initial diagnosis, four cases with non-adipocytic sarcoma revised as DDLPS based on molecular pathology in our study. Therefore, we hypothesize that alterations in CDK4 leading to its overexpression are associated with pazopanib resistance, and additional analyses are required to confirm and identify the underlying molecular mechanism. CDK4 amplification is present in 1.95% of the cases of American Association for Cancer Research Project Genomics Evidence Neoplasia Information Exchange Consortium, with lung adenocarcinoma, dedifferentiated liposarcoma, conventional glioblastoma multiforme, glioblastoma, and well differentiated liposarcoma having the greatest prevalence [17]. So, further studies are needed which investigate CDK4 amplification as a predictive biomarker for anti-VEGF treatment in other cancer types.
Recently, TP53 alterations have been suggested as a biomarker of response to anti-VEGF treatment [18,19]. However, we could not find significant differences in the outcomes (both response and progression survival) according to TP53 mutational status (S7 Fig.). Moreover, there was no statistically significant difference in the VEGF expression according to TP53 mutational status (S8 Fig.). These results may be due to the small number of patients and the heterogeneity of the study population.
Previous integrated analyses have described the following immune phenotype classification based on the composition of the tumor microenvironment in STS: immune-low, immune-high, and vascularized groups [20]. In this study, the immune-high group exhibited the highest levels of tertiary lymphoid structure (TLS), including T cells, B cells, and NK cells. Among those, B cell infiltration was a key discriminative factor for longer survival and a favorable response to PD-1 blockade through pembrolizumab. Likewise, in our study, high expression of CD19, a B cell marker, and the NK cell pathway were enriched in responders to the durvalumab combination, but not in those receiving pazopanib monotherapy. Therefore, high infiltration of B cell and TLS-rich features are a hallmark of better efficacy of anti–PD-L1 therapy in STS.
Based on the central role played by the vascular endothelial growth factor receptor (VEGFR) in immunosuppression, combination treatment strategies have been widely studied in various solid tumors. Addition of anti-angiogenic therapy to anti–PD-L1 regimens was found to induce high endothelial venules (HEVs) surrounding the tumor, resulting in enhanced cytolytic activity by recruiting active lymphocytes into the tumor [21]. Induction of HEVs by combination with a VEGFR inhibitor may transform immune-low tumors to immune-high tumors. Given the remarkable clinical response in renal cell carcinoma [22], the combination of axitinib and pembrolizumab has also demonstrated promising therapeutic activity (26.7% of ORR) in STS, particularly with respect to alveolar soft-part sarcoma [23]. Although these preliminary data and cross-study comparisons are speculative, we believe that high response rate in the combination of pazopanib and PD-L1 blockade is promising activity. Further investigation with ongoing clinical trial will help to elucidate these findings.
Our study has some limitations. This study included patients with heterogeneous subtypes of sarcoma and heterogeneous tumor samples (primary tumors and metastases). The study population also received heterogeneous treatment (pazopanib monotherapy and pazopanib+durvalumab).
While pazopanib is currently approved for STS treatment, a subset of patients does not experience a clinical benefit from treatment, highlighting the need for a more personalized approach through refined patient stratification. Based on our study, stratification should be actively considered in order to identify patients who will benefit from pazopanib or immunotherapies. Our findings lay the basis for patient stratifications with respect to therapeutic strategies for STS, which may be useful in future clinical trials investigating the effects of novel agents.

Notes

Ethical Statement

The study was approved by the committee of Samsung Medical Center (IRB file # 2014-03-173), and Severance Hospital (IRB file #4-2018-0743), Seoul, Republic of Korea on the use of human samples for experimental studies. Written informed consent was obtained from all study participants prior to enrollment. The research conformed to the principles of the Helsinki Declaration.

Author Contributions

Conceived and designed the analysis: Hong JY, Kim HS, Lee J.

Collected the data: Hong JY, Yun KH, Lee YH, Kim SH, Baek W, Kim HS, Lee J.

Contributed data or analysis tools: Cho HJ, Kim SK, Lee Y, Choi YL, Kwon M, Kim HS, Lee J.

Performed the analysis: Cho HJ, Kim SK, Lee Y, Choi YL, Kwon M, Kim HS, Lee J.

Wrote the paper: Hong JY, Kim HS.

Conflicts of Interest

Conflict of interest relevant to this article was not reported.

Acknowledgments

This study was supported by a faculty research grant of Yonsei University College of Medicine for 2019 (6-2019-0187, Hyo Song Kim) and by the National Research Foundation of Korea (NRF) grant funded by the Korea government (MSIT). (2021R1A2C1094530). This study was also supported by Future Medicine 20*30 Project of the Samsung Medical Center [SMX1220101, Jung Yong Hong].
A subset of biospecimens analyzed for this study were provided by Samsung Medical Center Biobank.

References

1. Hensley ML, Maki R, Venkatraman E, Geller G, Lovegren M, Aghajanian C, et al. Gemcitabine and docetaxel in patients with unresectable leiomyosarcoma: results of a phase II trial. J Clin Oncol. 2002; 20:2824–31.
crossref
2. Judson I, Verweij J, Gelderblom H, Hartmann JT, Schoffski P, Blay JY, et al. Doxorubicin alone versus intensified doxorubicin plus ifosfamide for first-line treatment of advanced or metastatic soft-tissue sarcoma: a randomised controlled phase 3 trial. Lancet Oncol. 2014; 15:415–23.
crossref
3. Italiano A, Mathoulin-Pelissier S, Cesne AL, Terrier P, Bonvalot S, Collin F, et al. Trends in survival for patients with metastatic soft-tissue sarcoma. Cancer. 2011; 117:1049–54.
crossref
4. Sleijfer S, Ray-Coquard I, Papai Z, Le Cesne A, Scurr M, Schoffski P, et al. Pazopanib, a multikinase angiogenesis inhibitor, in patients with relapsed or refractory advanced soft tissue sarcoma: a phase II study from the European organisation for research and treatment of cancer-soft tissue and bone sarcoma group (EORTC study 62043). J Clin Oncol. 2009; 27:3126–32.
crossref
5. van der Graaf WT, Blay JY, Chawla SP, Kim DW, Bui-Nguyen B, Casali PG, et al. Pazopanib for metastatic soft-tissue sarcoma (PALETTE): a randomised, double-blind, placebo-controlled phase 3 trial. Lancet. 2012; 379:1879–86.
crossref
6. Tawbi HA, Burgess M, Bolejack V, Van Tine BA, Schuetze SM, Hu J, et al. Pembrolizumab in advanced soft-tissue sarcoma and bone sarcoma (SARC028): a multicentre, two-cohort, single-arm, open-label, phase 2 trial. Lancet Oncol. 2017; 18:1493–501.
crossref
7. Feng X, Pleasance E, Zhao EY, Ng T, Grewal JK, Mohammad N, et al. Therapeutic implication of genomic landscape of adult metastatic sarcoma. JCO Precis Oncol. 2019; 3:1–25.
crossref
8. Baker SJ, Reddy EP. CDK4: a key player in the cell cycle, development, and cancer. Genes Cancer. 2012; 3:658–69.
crossref
9. Becht E, Giraldo NA, Lacroix L, Buttard B, Elarouci N, Petitprez F, et al. Estimating the population abundance of tissue-infiltrating immune and stromal cell populations using gene expression. Genome Biol. 2016; 17:218.
10. Sleijfer S, Gorlia T, Lamers C, Burger H, Blay JY, Le Cesne A, et al. Cytokine and angiogenic factors associated with efficacy and toxicity of pazopanib in advanced soft-tissue sarcoma: an EORTC-STBSG study. Br J Cancer. 2012; 107:639–45.
crossref
11. Kobayashi H, Okuma T, Oka H, Hirai T, Ohki T, Ikegami M, et al. Neutrophil-to-lymphocyte ratio after pazopanib treatment predicts response in patients with advanced soft-tissue sarcoma. Int J Clin Oncol. 2018; 23:368–74.
crossref
12. Cancer Genome Atlas Research Network. Comprehensive and integrated genomic characterization of adult soft tissue sarcomas. Cell. 2017; 171:950–65.
13. Barretina J, Taylor BS, Banerji S, Ramos AH, Lagos-Quintana M, Decarolis PL, et al. Subtype-specific genomic alterations define new targets for soft-tissue sarcoma therapy. Nat Genet. 2010; 42:715–21.
crossref
14. Nakamura T, Matsumine A, Kawai A, Araki N, Goto T, Yonemoto T, et al. The clinical outcome of pazopanib treatment in Japanese patients with relapsed soft tissue sarcoma: a Japanese Musculoskeletal Oncology Group (JMOG) study. Cancer. 2016; 122:1408–16.
crossref
15. Semenza GL. Defining the role of hypoxia-inducible factor 1 in cancer biology and therapeutics. Oncogene. 2010; 29:625–34.
crossref
16. Zelzer E, Levy Y, Kahana C, Shilo BZ, Rubinstein M, Cohen B. Insulin induces transcription of target genes through the hypoxia-inducible factor HIF-1alpha/ARNT. EMBO J. 1998; 17:5085–94.
17. AACR Project GENIE Consortium. AACR Project GENIE: powering precision medicine through an international consortium. Cancer Discov. 2017; 7:818–31.
18. Koehler K, Liebner D, Chen JL. TP53 mutational status is predictive of pazopanib response in advanced sarcomas. Ann Oncol. 2016; 27:539–43.
crossref
19. Wheler JJ, Janku F, Naing A, Li Y, Stephen B, Zinner R, et al. TP53 alterations correlate with response to VEGF/VEGFR inhibitors: implications for targeted therapeutics. Mol Cancer Ther. 2016; 15:2475–85.
20. Petitprez F, de Reynies A, Keung EZ, Chen TW, Sun CM, Calderaro J, et al. B cells are associated with survival and immunotherapy response in sarcoma. Nature. 2020; 577:556–60.
crossref
21. Allen E, Jabouille A, Rivera LB, Lodewijckx I, Missiaen R, Steri V, et al. Combined antiangiogenic and anti-PD-L1 therapy stimulates tumor immunity through HEV formation. Sci Transl Med. 2017; 9:eaak9679.
crossref
22. Aggen DH, Drake CG, Rini BI. Targeting PD-1 or PD-L1 in metastatic kidney cancer: combination therapy in the first-line setting. Clin Cancer Res. 2020; 26:2087–95.
crossref
23. Wilky BA, Trucco MM, Subhawong TK, Florou V, Park W, Kwon D, et al. Axitinib plus pembrolizumab in patients with advanced sarcomas including alveolar soft-part sarcoma: a single-centre, single-arm, phase 2 trial. Lancet Oncol. 2019; 20:837–48.
crossref

Fig. 1
Molecular landscape and response to pazopanib-based treatment. Integrated plot of clinical and molecular features. From top to bottom, panels indicate: Waterfall plot represents percentage of maximum tumor reduction as assessed according to Response Evaluation Criteria in Solid Tumor 1.1 criteria; the number of mutations; clinical characteristics including primary site, histological subtype, best response, treatment (pazopanib vs. pazopanib and durvalumab combination), and percentage of alterations (fusions, mutations, and somatic copy number alterations). Patient identity number is provided in S2 Table. CN, copy number; DDLPS, dedifferentiated liposarcoma; DSRCT, desmoplastic small round cell tumor; G-LMS, gynecological leiomyosarcomas; MPNST, malignant peripheral nerve sheath tumors; NA, not available; SS, synovial sarcoma; ST-LMS, soft tissue leiomyosarcomas; TMB, tumor mutation burden; UPS, undifferentiated pleomorphic sarcoma.
crt-2022-251f1.gif
Fig. 2
Response to pazopanib or pazopanib and durvalumab combination. (A) Waterfall plot represents percentage of maximum tumor reduction after treatment, as assessed according to Response Evaluation Criteria in Solid Tumor 1.1 criteria. (B) Swimmer plot. Each lane represents a single patient’s data. X-axis represents the duration of treatment for each patient. (C) Spider plots of the percentage change in the sum of target lesions by subject. CSS, clear cell sarcoma; DDLPS, dedifferentiated liposarcoma; DSRCT, desmoplastic small round cell tumor; ESS, endometrial stromal cell sarcoma; LMS, leiomyosarcomas; MFS, myxofibrosarcoma; MPNST, malignant peripheral nerve sheath tumors; SFT, solitary fibrous tumor; SS, synovial sarcoma; UPS, undifferentiated pleomorphic sarcoma.
crt-2022-251f2.gif
Fig. 3
CDK4, FRS2, and HDLBP copy number alterations are genomic determinants of pazopanib resistance. (A) Prevalence of tumors harboring CDK4 gains (red) and amplifications (bule) in responders and non-responders. PD, progressive disease; PR, partial response; SD, stable disease. (B) Univariate Cox regression analysis with genetic variables. Error bars represent the 95% confidence interval. X-axis indicates log10-transformed hazard ratio. AMP, amplification/gain; DEL, deletion/loss. *p < 0.05, ***p < 0.001. (C) Kaplan-Meier curve of progression-free survival (months) based on CDK4 amplification. (D) Univariate Cox regression analysis among histologic variants. Error bars represent the 95% confidence intervals. X-axis indicates hazard ratio (log10-scaled). AIC, Akaike information criterion; DDLPS, dedifferentiated liposarcoma; LMS, leiomyosarcomas; MPNST, malignant peripheral nerve sheath tumors; Others, other sarcoma subtypes; SS, synovial sarcoma; UPS, undifferentiated pleomorphic sarcoma. *p < 0.05.
crt-2022-251f3.gif
Fig. 4
Transcriptomic correlates of clinical response to pazopanib. (A) Gene Set Enrichment Analysis between pazopanib-sensitive and resistant patients. Significantly enriched gene sets (false discovery rate < 0.05) were clustered based on their similarity. (B) Volcano plot representation of genes differentially expressed between pazopanib-responders and non-responders. Genes with > 1 log2 fold change and an adjusted p < 0.05 are colored in red (responder DEGs), and those with < −1 log2 fold change and an adjusted p < 0.05 are colored in blue (non-responder DEGs). (C) The association between mRNA expression levels (log2(FPKM+1)) and copy number variations of CDK4. p-values were calculated using the two-sided Student t test. DEG, differentially expressed genes; FPKM, fragments per kilobase of transcripts per million mapped reads; TCR, T cell receptor.
crt-2022-251f4.gif
Fig. 5
Transcriptomic correlates of clinical response to the pazopanib-durvalumab combination. (A) Heat map and unsupervised hierarchical clustering describing tumor microenvironment cell infiltration. Color scale indicates Z-normalized MCP scores of each type of microenvironment cell across samples. Color bar above the heatmap indicates responders (blue) and non-responders (red) to the pazopanib-durvalumab combination. (B) Immune cell fraction analysis of responding and non-responding patients receiving the pazopanib-durvalumab combination. Immune cell fractions were estimated using MCPcounter scores. *p < 0.05. p-value is from Student’s t test and not adjusted for multiple tests. (C) Gene Set Enrichment Analysis (GSEA) between sensitive and resistant patients to the pazopanib-durvalumab combination. Significantly enriched gene sets (FDR < 0.05) were clustered based on their similarity. (D, E) GSEA plot showing BIOCARTA natural killer (NK) cell pathway and Kyoto Encyclopedia of Genes and Genomes (KEGG) NK cell–mediated cytotoxicity pathway enrichment in the responder group. FDR, false discovery rate; NES, normalized enriched score. (F) Volcano plot representation of differentially expressed gene analysis between responders and non-responders to the pazopanib-durvalumab combination. Genes with > 1 log2 fold change and an adjusted p < 0.05 are colored in red, and those with < −1 log2 fold change and an adjusted p < 0.05 are colored in blue.
crt-2022-251f5.gif
Table 1
Patient characteristics
Variable Total Pazopanib Pazopanib/Durvalumab p-valuec)
No. of patients 35 18 (51.4) 17 (48.6)
Age (yr) 48 51 (38–73) 45 (22–72)
Sex
 Male 16 8 (50.0) 8 (50.0) 0.78
 Female 19 10 (52.6) 9 (47.4)
ECOG PS
 0 10 3 (30.0) 7 (70.0) 0.14*
 1 25 15 (60.0) 10 (40.0)
Histologic variant
 LMS 8 6 (75.0) 2 (25.0) 0.23*
 UPS 7 5 (71.4) 2 (28.6)
 MPNST 5 1 (20.0) 4 (80.0)
 DDLPS 5 3 (60.0) 2 (40.0)
 Synovial sarcoma 4 1 (25.0) 3 (75.0)
 Othersa) 6 2 (33.3) 4 (66.7)
Primary site
 Upper abdomen/Retroperitoneum 11 8 (72.7) 3 (27.3) 0.10*
 Extremity 6 0 6 (100)
 Gynecologic organ 6 3 (50.0) 3 (50.0)
 Lower abdomen 5 4 (80.0) 1 (20.0)
 Head/Neck 5 2 (40.0) 3 (60.0)
 Thorax 2 1 (50.0) 1 (50.0)
Stage at diagnosisb)
 II 15 6 (40.0) 9 (60.0) 0.42*
 III 14 9 (64.3) 5 (35.7)
 IV 6 3 (50.0) 3 (50.0)
FNCLCC grade
 I 4 4 (100) 0 0.10*
 II 8 3 (37.5) 5 (62.5)
 III 23 11 (47.8) 12 (52.2)
No. of previous chemotherapy regimens
 1 17 6 (35.3) 11 (64.7) 0.21*
 2 12 7 (58.3) 5 (41.7)
 > 3 6 5 (83.3) 1 (16.7)
Sequencing samples
 Primary tumor 16 6 (37.5) 10 (62.5) 0.13
 Metastatic sites 19 12 (63.2) 7 (36.8)
Type of previous chemotherapy received
 Doxorubicin monotherapy 9 8 (72.8) 1 (11.1) NA
 Gemcitabine/Docetaxel 11 6 (54.5) 5 (45.5)
 Eribulin 1 1 (100) 0
 Doxorubicin/Ifosfamide 9 3 (33.3) 6 (66.6)
 Doxorubicin/Olaratumab 13 6 (46.2) 7 (53.8)
 Ifosfamide combination 15 11 (73.3) 4 (26.7)

Values are presented as number (%) or median (range). DDLPS, dedifferentiated liposarcoma; ECOG PS, Eastern Cooperative Oncology Group performance status; FNCLCC, Fédération Nationale des Centres de Lutte Contre le Cancer; LMS, leiomyosarcoma; MPNST, malignant peripheral nerve sheath tumor; NA, not available; UPS, undifferentiated pleomomorphic sarcoma.

a) Others: desmoplastic small round cell tumor, myxoid fibrosarcoma, high grade endometrial stromal cell sarcoma, clear cell sarcoma, low grade myofibroblastic sarcoma, and solitary fibrous tumor,

b) 8th edition of the American Joint Committee on Cancer guideline of tumor, node, and metastasis (TNM) classification,

c) The associations were analyzed by the chi-square test or Fisher exact test (*).

TOOLS
Similar articles