Abstract
Background/Aims
Caudal-related homeobox 2 (Cdx2) is expressed in the human intestinal metaplastic mucosa and induces intestinal metaplastic mucosa in the Cdx2 transgenic mouse stomach. Atrophic gastritis and intestinal metaplasia commonly lead to gastric achlorhydria, which predisposes the stomach to bacterial overgrowth. In the present study, we determined the differences in gut microbiota between normal and Cdx2 transgenic mice, using quantitative reverse transcription-polymerase chain reaction (qRT-PCR).
Methods
Twelve normal (control) and 12 Cdx2 transgenic mice were sacrificed, and the gastric, jejunal, ileac, cecal and colonic mucosa, and feces were collected. To quantitate bacterial microbiota, we used real-time qRTPCR with 16S rRNA gene-targeted, species-specific primers.
Results
The total numbers of bacteria in the gastric, jejunal, ileac, cecal, and colonic mucosa of the Cdx2 transgenic mice were significantly higher than those of the normal mice. The Bacteroides fragilis group and also Prevotella were not detected in the stomach of the normal mice, although they were detected in the Cdx2 transgenic mice. Moreover, the Clostridium coccoides group, Clostridium leptum subgroup, Bacteroides fragilis group, and Prevotella were not detected in the jejunum or ileum of the normal mice, although they were detected in the Cdx2 transgenic mice. The fecal microbiota of the normal mice was similar to that of the Cdx2 transgenic mice.
Caudal-related homeobox 2 (CDX2), a caudal-related homeobox transcription factor, is selectively localized in the nuclei of fetal and adult mucosal epithelial cells in the small and large intestines of humans and mice.1 CDX2 is important for the transcriptional regulation of intestinal genes and the differentiation of intestinal cells in vitro.2,3 Although normal gastric mucosa does not express CDX2, nuclear immunoreactivity for CDX2 is detected in the human gastric intestinal metaplastic mucosa.4,5,6,7,8 We previously established Cdx2 transgenic mice that exclusively expressed CDX2 in their gastric epithelium,9 and demonstrated that their gastric fundic mucosa was completely morphologically changed into intestinal metaplastic mucosa. Moreover, we previously showed that expression of CDX2 may be an early event that triggers the development of intestinal metaplasia in the human gastric mucosa.5 These findings suggest that CDX2 has a regulatory role in the development and differentiation of the intestinal metaplasia.
In humans, chronic gastritis due to Helicobacter pylori infection commonly leads to loss of parietal and chief cells, diminution of the gastric glands, and thus atrophy or thinning of the mucosa. In addition, chronic atrophic gastritis often leads to the development of intestinal metaplasia. In this situation, humans develop gastric achlorhydria.10 Gastric achlorhydria also occurs in association with intestinal metaplasia in Cdx2 transgenic mice.9 Gastric achlorhydria predisposes the stomach to bacterial overgrowth. To date, the few studies that have explored the microbiota of the stomach with either negative or positive H. pylori status have used molecular methods.11,12,13 However, to the best of our knowledge, there have been no studies published that focus on characterization of the gastric microbiota in severe atrophic gastritis or intestinal metaplasia.
Identification of bacterial strains by conventional culturebased methods provides an incomplete and biased picture of the biodiversity of intestinal microbiota, because many species cannot be cultivated in vitro.14 Therefore, cultureindependent molecular methods, based on 16S rRNA genes, such as fluorescent in situ hybridization,15 denaturing gradient gel electrophoresis,16 and cloning and sequencing of rDNA,14 have been introduced to obtain a better understanding of the gut microbiota. Recently, Matsuda et al.17 developed a quantitative RT-PCR (qRT-PCR) method with 16S rRNA-gene-targeted, species-specific primers for species that were designed for analysis of human intestinal microbiota.
The aim of the present study was to determine the differences in gut microbiota between normal and Cdx2 transgenic mice, using this qRT-PCR method.
We used Cdx2 transgenic mice with stomach-specific expression of Cdx2 under the control of the rat H+/K+-ATPase β-subunit gene promoter.9 The Cdx2 transgenic mice were originally from a C57BL/6J background. The transgenic mice and normal mice (C57BL/6J) had ad libitum access to standard laboratory chow (CE-2; CLEA Japan, Tokyo, Japan) and drinking water, and were maintained on a 12-hour light/dark cycle. Twelve normal mice and 12 Cdx2 transgenic mice (six male and six female, seven weeks old) were sacrificed, and the mucosae of the stomach, jejunum, ileum, cecum, and colon were scraped off with a spatula and collected in 1 mL RNAlater (Life Technologies, Carlsbad, CA, USA), an RNA stabilization solution, prior to bacteriological analysis. Feces were also collected in 1 mL RNAlater and the preparations were incubated for 10 minutes at room temperature.
All experiments were carried out in a humane manner after receiving approval from the Institutional Animal Experiment Committee of the Jichi Medical University, and in accordance with the Institutional Regulation for Animal Experiments and Fundamental Guidelines for Proper Conduct of Animal Experiment and Related Activities in Academic Research Institutions under the jurisdiction of the Ministry of Education, Culture, Sports, Science and Technology of Japan.
For RNA stabilization, an aliquot of the fecal homogenate (200 µL) was added to 1 mL sterilized phosphate buffer solution, and centrifuged at 5,000 × g for 10 minutes. The supernatant was discarded, and the pellet was stored at -80℃ until used for the extraction of RNA. RNA was isolated using a modified method of acid guanidinium thiocyanate-phenol-chloroform extraction.17,18 Finally, the nucleic acid fraction was suspended in 1 mL nuclease-free water (Ambion, Austin, TX, USA).
qPT-PCR was conducted according to previous reports.17,18,19,20,21,22,23 It was conducted in a one-step reaction, using a Qiagen OneStep RT-PCR kit (Qiagen GmbH, Hilden, Germany). Each reaction mixture (10 µL) was composed of 1× Qiagen OneStep RT-PCR buffer, 0.5× Q-solution, each dNTP at a concentration of 400 µmol/L, a 1:100,000 dilution of SYBR Green I (Life Technologies, Carlsbad, CA, USA), 0.4 µL Qiagen OneStep RT-PCR enzyme mix, each specific primer (Table 1) at a concentration of 0.6 µmol/L (except for g-Bfra-F2/g-Bfra-R at 1.2 µmol/L and sg-Lsak-F/sg-Lsak-R at 2.4 µmol/L), and 5 µL template RNA. The reaction mixture was incubated at 50℃ for 30 minutes for reverse transcription. The continuous amplification program consisted of one cycle at 95℃ for 15 minutes; 40 cycles at 94℃ for 20 seconds, 50, 55, or 60℃ (Table 1) for 20 seconds, and 72℃ for 50 seconds; and finally, one cycle at 94℃ for 15 seconds. Fluorescent products were detected in the last step of each cycle. Melting curve analysis was performed after amplification to distinguish the targeted from nontargeted PCR products. The melting curve was obtained by slow heating at temperatures from 60℃ to 95℃ at a rate of 0.2℃/s, with continuous fluorescent collection. Amplification and detection were performed in 384-well optical plates on an ABI PRISM 7900HT sequence detection system (Applied Biosystems, Foster City, CA, USA).
The standard curve was generated with qRT-PCR data, cycle threshold values, and the corresponding cell count, which was determined microscopically with the 4',6-diamidino-2-phenylindole (DAPI) staining method upon the dilution series of the following standard strains (appendix). For the determination and quantification of the target bacteria present in samples, three serial 10-fold dilutions of extracted RNA samples (corresponding to 1/2,000, 1/20,000, and 1/200,000 of the amount of RNA extracted from 20-mg samples) were applied to qRT-PCR, and cycle threshold values in the linear range of the assay were applied to the standard curve generated in the same experiment to obtain the corresponding bacterial count in each nucleic acid sample. The results were converted into the count per sample. Total bacteria were calculated as a total population of 12 bacterial groups.
We used SPSS Statistics 14.0 software (Nihon IBM Inc., Tokyo, Japan). A non-parametric Mann-Whitney U test was performed to determine the significance levels for the differences in mean bacterial number for normal and Cdx2 transgenic mice. The significance of the difference in numbers of mice positively testing for each bacterium between normal and Cdx2 transgenic mice was determined with Fisher's exact test. A value of P<0.05 was regarded as significant.
The compositions of both the predominant and subdominant bacterial populations were analyzed by qRT-PCR, with lower detection limits in the range of 102-104 cells/g feces, and the mean±SD for the total population of these 12 bacterial groups and one species was log10 10.3±0.5 cells/g feces (Table 2, Fig. 1,2,3,4,5,6). Lactobacillus was the dominant bacterial genus in normal mouse feces and was detected in almost all gut mucosa in normal mice (Table 2, Fig. 1,2,3,4,5,6). Lactobacillus was the dominant bacteria in the normal mouse gut. The C. coccoides group, C. leptum subgroup, and Enterococcus were detected in the normal mouse stomach. However, the detection rates were under 50% (Table 2, Fig. 1). Only Lactobacillus was detected in the jejunum of normal mice (Table 2, Fig. 2). Some other bacterial groups such as Enterococcus, Streptococcus, and Bifidobacterium were detected in the normal mouse ileum. However, the detection rates were under 50% (Table 2, Fig. 3). Various bacterial groups detected in the normal mouse feces were also detected in the cecum and the colon of normal mice, in contrast to the jejunum and the ileum, although the bacterial counts and detection rates were lower than those in normal mouse feces (Table 2, Fig. 4,5,6).
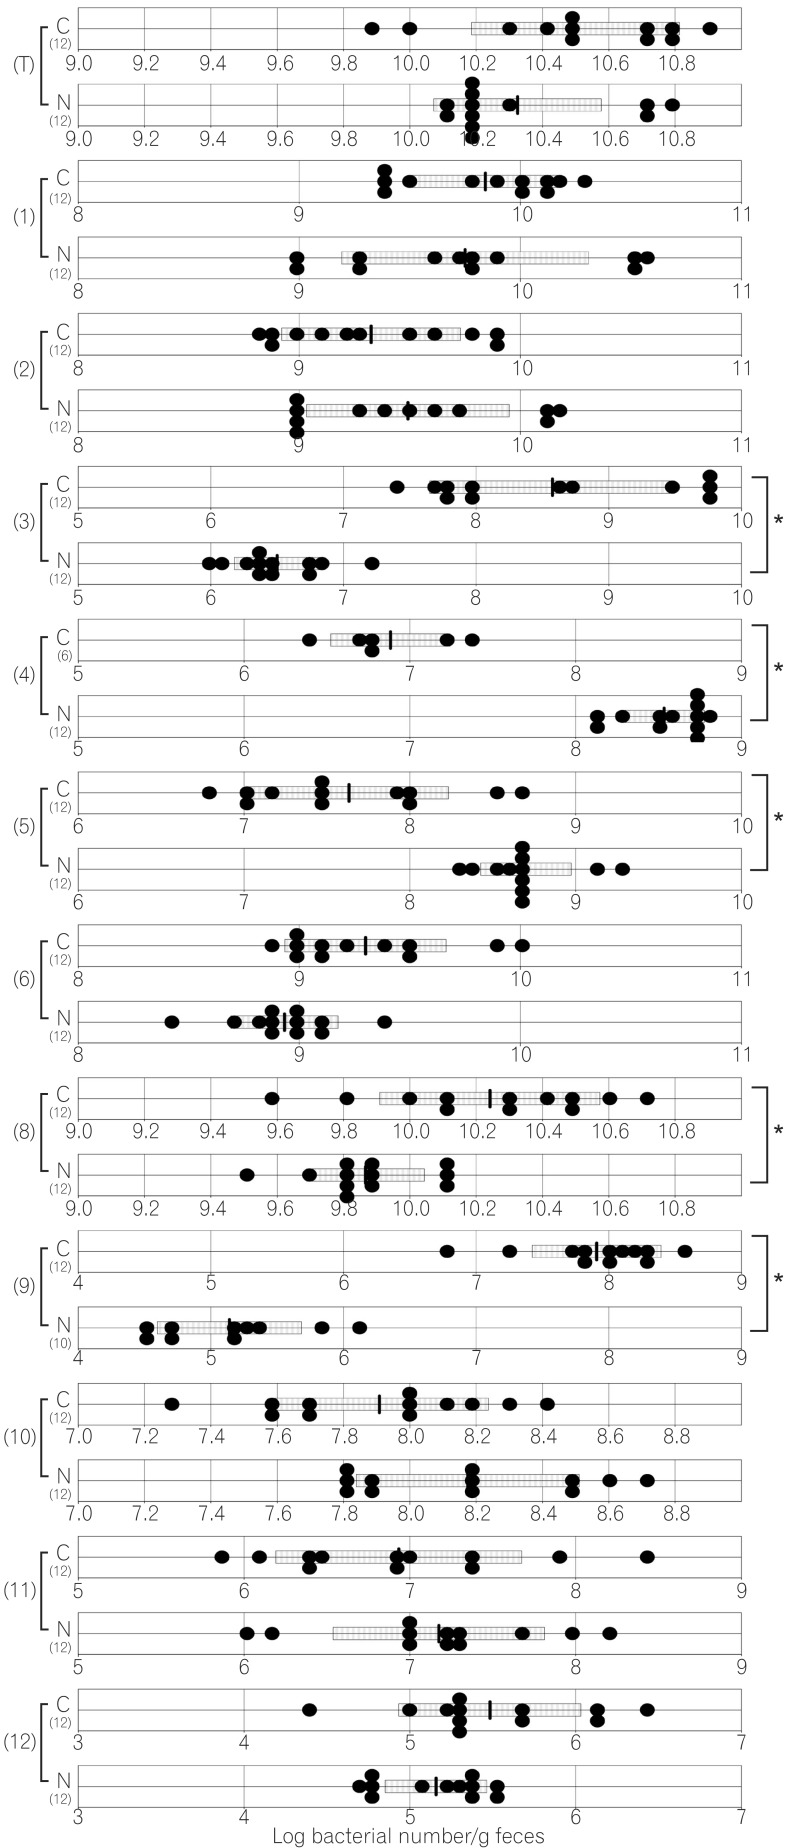
The average numbers of total bacteria in the gastric, jejunal, ileac, cecal, and colonic mucosa of Cdx2 transgenic mice were significantly higher than those in normal mice (Table 2, Fig. 1,2,3,4,5). The Bacteroides fragilis group and Prevotella were not detected in the stomach, jejunum, or ileum of normal mice but they were detected in Cdx2 transgenic mice (Fig. 1,2,3). Moreover, the detection rates of the C. coccoides group, C. leptum subgroup, and Enterococcus in the intestine of normal mice were significantly lower than those of Cdx2 transgenic mice (Table 2). In contrast, there was no significant difference between the average number of total bacteria in the feces of Cdx2 transgenic mice and that of normal mice (Fig. 6). However, presence of the B. fragilis group in the feces of Cdx2 transgenic mice was significantly higher than that for normal mice, and the number of Bifidobacterium in the feces of Cdx2 transgenic mice was significantly lower than that for the normal mice.
To our knowledge, this report represents the first quantitative examination of bacterial populations in intestinal metaplasia, without culture. We clarified that gastric achlorhydria due to intestinal metaplasia increases the diversity of gut microbiota. Moreover, this effect was observed not only in the stomach but also in the intestine.
Recently, the sequencing approach using 16S rRNA gene clones has extensively been conducted to investigate the composition of human gastric microbiota.11,12,24 These studies have demonstrated that the gastric community is highly dominated by Proteobacteria, Firmicutes, Actinobacteria, and Bacteroidetes in individuals with negative or positive H. pylori status. Although such studies have described the diversity of human gastric microbiota and its abundance in good detail, especially concerning predominant bacteria, sequence information about subdominant bacteria is limited and is not adequate for the accurate determination of subdominant bacteria.
The rRNA-targeted qRT-PCR method can detect targeted, viable bacterial populations in the range of 102-103 cells/g mucosa or more, including subdominant bacteria, with high resolution, and it has several advantages such as sensitivity, rapidity, and accuracy.17,18,19,20,21,22,23 These aspects of the qRTPCR method contribute to obtaining an accurate understanding of the relationships between viable bacteria and their hosts. However, qRT-PCR can only analyze bacteria for which the proper primers and absolute calibration curves are constructed. For example, Fusobacterium, Veillonella, and Neisseria, which are the dominant bacteria in the oral airway, were not analyzed in the present study. Osaki et al. have reported that Fusobacterium and Veillonella were not detected in the stomach of Mongolian gerbils.13 Moreover, previous reports have indicated that the mothers' intestinal microbiota influence gut colonization in their infants.25 Thus, the observed differences in microbiota between normal mice and Cdx2 transgenic mice might be influenced by their mothers' intestinal microbiota.
The bacterial counts and detection rates of the C. coccoides group, C. leptum subgroup, and Atopobium cluster in normal mouse feces were similar to those in human feces.17 These bacteria were the predominant species in human feces and their population was in the range of 109-1010 bacteria/g feces. However, the population levels of Bifidobacterium and the B. fragilis group in normal mice were smaller than those in humans, and these are also predominant bacteria in human feces. The bacterial count of Lactobacillus in normal mice was higher than that in humans. Lactobacillus was the dominant bacteria in normal mouse feces.
The total numbers of bacteria in the gastric, jejunal, ileac, cecal, and colonic mucosa of Cdx2 transgenic mice were significantly higher than those of normal mice. However, corresponding total numbers in the feces of Cdx2 transgenic mice were not significantly higher those of normal mice. One of the reasons for this is that feces are formed after water is absorbed in the rectum. Therefore, the bacteria in feces would be more concentrated than those in the mucosa. Another possible reason is that the composition of bacteria might not be the same between the surface of the mucosa and the lumen of the intestine. In fact, B. fragilis was not detected in any of the mucosa of Cdx2 transgenic mice, even though it was detected in the feces of all Cdx2 transgenic mice in the present study. Further studies would be needed to clarify these issues.
The average total number of bacteria in the gastric mucosa of Cdx2 transgenic mice was >100 times higher than that for normal mice. Osaki et al. have reported that there was no significant difference in the numbers of bacteria in the total microbiota between H. pylori-positive and -negative Mongolian gerbils.13 However, the stomach pH and the gastric pathological findings were not mentioned in their report. Therefore, the stomachs of H. pylori-positive Mongolian gerbils might have not progressed to severe atrophic gastritis or intestinal metaplasia. We have previously reported that the gastric fundic mucosa of Cdx2 transgenic mice was completely changed morphologically to intestinal metaplastic mucosa, and the pH of the stomach was 7.8±0.2 at the age of 37 days.9 The gastric acid provides an effective barrier, killing most bacteria that enter the gastrointestinal tract. However, gastric achlorhydria due to intestinal metaplasia provides an opportunity for foreign microbes to enter and colonize the stomach. Furthermore, the effect may extend to intestinal microbiota. We revealed that the total number of intestinal microbiota in Cdx2 transgenic mice was significantly increased. Gastric achlorhydria due to intestinal metaplasia affects not only small intestinal microbiota but also large intestinal microbiota.
In the present study, the dominant bacteria in the mouse gastric mucosa were Lactobacillus, the C. coccoides group, C. leptum subgroup, and Enterococcus. Similarly, another study also reported that the dominant bacteria in the mouse gastric mucosa were Lactobacillaceae and Bacteroidales.26 Mice have a habit of autocoprophagy, i.e., eating their own feces; therefore, bacteria in the murine stomach may originate chiefly from their own intestinal microbiota. Bacteria that have a tolerance to acid, or spore-forming ability, might be dominant bacteria. We reported that intestinaltype adenocarcinoma developed from intestinal metaplastic mucosa in the stomach of Cdx2 transgenic mice without H. pylori infection.27 Moreover, Lofgren et al.28 reported that H. pylori-infected transgenic insulin-gastrin (INS-GAS) mice, with complex gastric microbiota, had more severe gastritis and early onset of gastrointestinal intraepithelial neoplasia compared to germ-free and H. pylori monoinfected INSGAS mice. These results suggest a role of microbiota in the chronic inflammation and carcinogenesis of the stomach. Dicksved et al.29 reported that the gastric microbiota from 10 patients with gastric cancer was dominated by different species of corresponding genera such as Streptococcus, Lactobacillus, Veillonella, and Prevotella. Certain bacteria may be linked with carcinogenesis, although this requires further investigation for confirmation.
In conclusion, intestinal metaplasia affects not only gastric microbiota but also intestinal microbiota. A better understanding of the resident microbial communities in intestinal metaplasia should shed light on the pathogenesis, diagnosis, and treatment of gastrointestinal illnesses.
Notes
Financial support: This work was supported in part by Jichi Medical University Young Investigator Award, a Grant-in-Aid for Scientific Research (C) (24590926 to H.M.) and a Grant-in-Aid for Scientific Research on Innovative Areas (22114002 to H.M.) from the Japan Society for the Promotion of Science.
References
1. Meyer BI, Gruss P. Mouse Cdx-1 expression during gastrulation. Development. 1993; 117:191–203. PMID: 7900985.
2. Suh E, Chen L, Taylor J, Traber PG. A homeodomain protein related to caudal regulates intestine-specific gene transcription. Mol Cell Biol. 1994; 14:7340–7351. PMID: 7935448.

3. Suh E, Traber PG. An intestine-specific homeobox gene regulates proliferation and differentiation. Mol Cell Biol. 1996; 16:619–625. PMID: 8552090.

4. Mizoshita T, Inada K, Tsukamoto T, et al. Expression of Cdx1 and Cdx2 mRNAs and relevance of this expression to differentiation in human gastrointestinal mucosa--with special emphasis on participation in intestinal metaplasia of the human stomach. Gastric Cancer. 2001; 4:185–191. PMID: 11846061.

5. Eda A, Osawa H, Yanaka I, et al. Expression of homeobox gene CDX2 precedes that of CDX1 during the progression of intestinal metaplasia. J Gastroenterol. 2002; 37:94–100. PMID: 11871772.

6. Satoh K, Mutoh H, Eda A, et al. Aberrant expression of CDX2 in the gastric mucosa with and without intestinal metaplasia: effect of eradication of Helicobacter pylori. Helicobacter. 2002; 7:192–198. PMID: 12047325.
7. Bai YQ, Yamamoto H, Akiyama Y, et al. Ectopic expression of homeodomain protein CDX2 in intestinal metaplasia and carcinomas of the stomach. Cancer Lett. 2002; 176:47–55. PMID: 11790453.

8. Almeida R, Silva E, Santos-Silva F, et al. Expression of intestinespecific transcription factors, CDX1 and CDX2, in intestinal metaplasia and gastric carcinomas. J Pathol. 2003; 199:36–40. PMID: 12474224.

9. Mutoh H, Hakamata Y, Sato K, et al. Conversion of gastric mucosa to intestinal metaplasia in Cdx2-expressing transgenic mice. Biochem Biophys Res Commun. 2002; 294:470–479. PMID: 12051735.

10. Watanabe H. Intestinal metaplasia -the effect of Acid on the gastric mucosa and gastric carcinogenesis. J Toxicol Pathol. 2010; 23:115–123. PMID: 22272022.

11. Bik EM, Eckburg PB, Gill SR, et al. Molecular analysis of the bacterial microbiota in the human stomach. Proc Natl Acad Sci U S A. 2006; 103:732–737. PMID: 16407106.
12. Maldonado-Contreras A, Goldfarb KC, Godoy-Vitorino F, et al. Structure of the human gastric bacterial community in relation to Helicobacter pylori status. ISME J. 2011; 5:574–579. PMID: 20927139.
13. Osaki T, Matsuki T, Asahara T, et al. Comparative analysis of gastric bacterial microbiota in Mongolian gerbils after long-term infection with Helicobacter pylori. Microb Pathog. 2012; 53:12–18. PMID: 22783557.
14. Suau A, Bonnet R, Sutren M, et al. Direct analysis of genes encoding 16S rRNA from complex communities reveals many novel molecular species within the human gut. Appl Environ Microbiol. 1999; 65:4799–4807. PMID: 10543789.
15. Langendijk PS, Schut F, Jansen GJ, et al. Quantitative fluorescence in situ hybridization of Bifidobacterium spp. with genusspecific 16S rRNA-targeted probes and its application in fecal samples. Appl Environ Microbiol. 1995; 61:3069–3075. PMID: 7487040.
16. Satokari RM, Vaughan EE, Akkermans AD, Saarela M, De Vos WM. Polymerase chain reaction and denaturing gradient gel electrophoresis monitoring of fecal Bifidobacterium populations in a prebiotic and probiotic feeding trial. Syst Appl Microbiol. 2001; 24:227–231. PMID: 11518325.
17. Matsuda K, Tsuji H, Asahara T, Matsumoto K, Takada T, Nomoto K. Establishment of an analytical system for the human fecal microbiota, based on reverse transcription-quantitative PCR targeting of multicopy rRNA molecules. Appl Environ Microbiol. 2009; 75:1961–1969. PMID: 19201979.
18. Matsuda K, Tsuji H, Asahara T, Kado Y, Nomoto K. Sensitive quantitative detection of commensal bacteria by rRNA-targeted reverse transcription-PCR. Appl Environ Microbiol. 2007; 73:32–39. PMID: 17071791.
19. Matsuki T, Watanabe K, Fujimoto J, Takada T, Tanaka R. Use of 16S rRNA gene-targeted group-specific primers for real-time PCR analysis of predominant bacteria in human feces. Appl Environ Microbiol. 2004; 70:7220–7228. PMID: 15574920.
20. Matsuki T. Development of quantitative PCR detection method with 16S rRNA gene-targeted genus- and species-specific primers for the analysis of human intestinal microflora and its application. Nihon Saikingaku Zasshi. 2007; 62:255–261. PMID: 17575792.
21. Kikuchi E, Miyamoto Y, Narushima S, Itoh K. Design of speciesspecific primers to identify 13 species of Clostridium harbored in human intestinal tracts. Microbiol Immunol. 2002; 46:353–358. PMID: 12139395.
22. Watanabe K. inventor. Yakult Honsha Co., Ltd., assignee. Primers for lactic acid bacterium. Japan patent 11-151097. 1999. 6. 08.
23. Sakaguchi S, Saito M, Tsuji H, et al. Bacterial rRNA-targeted reverse transcription-PCR used to identify pathogens responsible for fever with neutropenia. J Clin Microbiol. 2010; 48:1624–1628. PMID: 20351213.
24. Stearns JC, Lynch MD, Senadheera DB, et al. Bacterial biogeography of the human digestive tract. Sci Rep. 2011; 1:170. PMID: 22355685.
25. Gronlund MM, Grzeskowiak L, Isolauri E, Salminen S. Influence of mother's intestinal microbiota on gut colonization in the infant. Gut Microbes. 2011; 2:227–233. PMID: 21983067.
26. Gu S, Chen D, Zhang JN, et al. Bacterial community mapping of the mouse gastrointestinal tract. PLoS One. 2013; 8:e74957. PMID: 24116019.
27. Mutoh H, Sakurai S, Satoh K, et al. Development of gastric carcinoma from intestinal metaplasia in Cdx2-transgenic mice. Cancer Res. 2004; 64:7740–7747. PMID: 15520178.
28. Lofgren JL, Whary MT, Ge Z, et al. Lack of commensal flora in Helicobacter pylori-infected INS-GAS mice reduces gastritis and delays intraepithelial neoplasia. Gastroenterology. 2011; 140:210–220. PMID: 20950613.
29. Dicksved J, Lindberg M, Rosenquist M, Enroth H, Jansson JK, Engstrand L. Molecular characterization of the stomach microbiota in patients with gastric cancer and in controls. J Med Microbiol. 2009; 58:509–516. PMID: 19273648.
Fig. 1
Number of gastric bacteria for normal and caudal-related homeobox 2 (Cdx2) transgenic mice. C corresponds to results for Cdx2 transgenic mice, N corresponds to results for normal mice. (T) Number of total bacteria; (1) number of Clostridium coccoides group; (2) number of Clostridium leptum subgroup; (3) number of Bacteroides fragilis group; (6) number of Prevotella ; (8) number of total Lactobacillus ; (9) number of Enterobacteriaceae, (10) number of Enterococcus. The SD value of the bacterial number for each group is shown as a bar. *P<0.05.
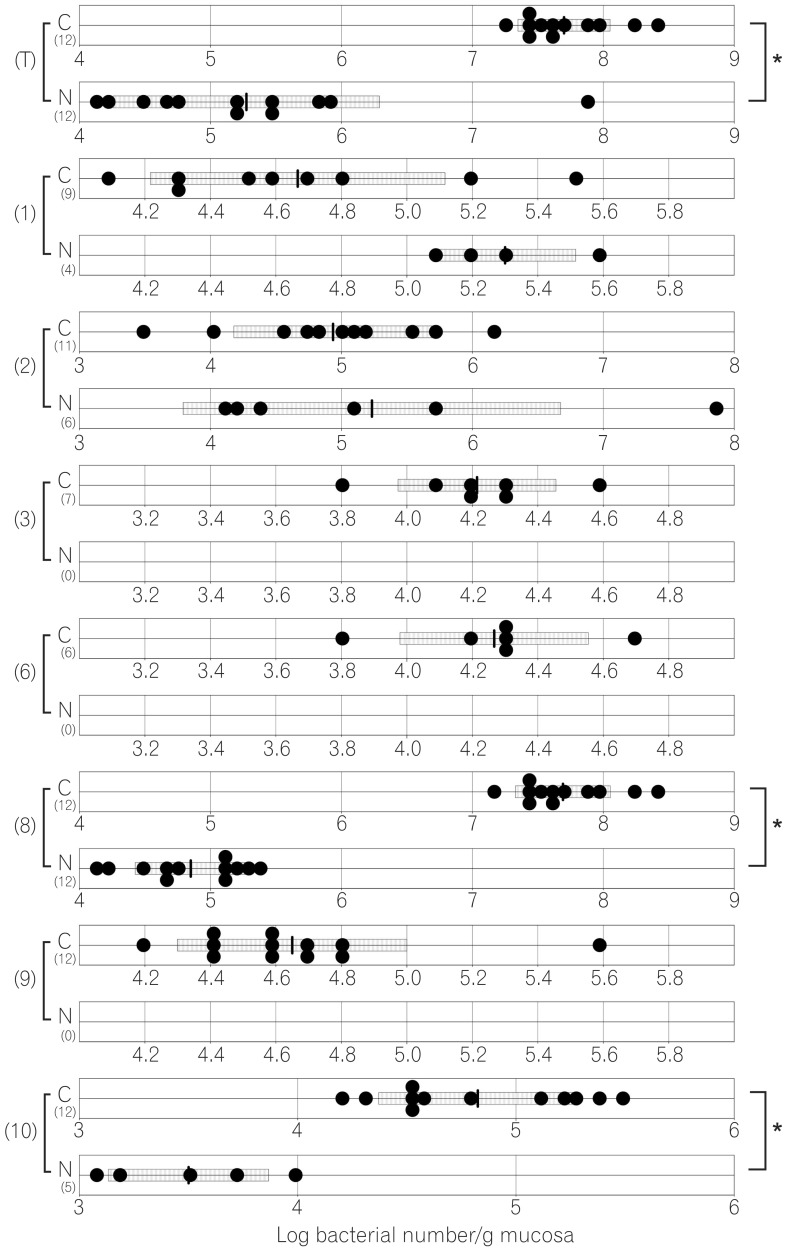
Fig. 2
Number of jejunal bacteria in normal and caudal-related homeobox 2 (Cdx2) transgenic mice. C corresponds to results for Cdx2 transgenic mice, N corresponds to results for normal mice. (T) Number of total bacteria; (1) number of Clostridium coccoides group; (2) number of Clostridium leptum subgroup; (3) number of Bacteroides fragilis group; (4) number of Bifidobacterium; (5) number of Atopobium cluster; (6) number of Prevotella ; (8) number of total Lactobacillus ; (9) number of Enterobacteriaceae ; (10) number of Enterococcus ; (12) number of Staphylococcus. The SD value of the bacterial number for each group is shown as a bar. *P<0.05.
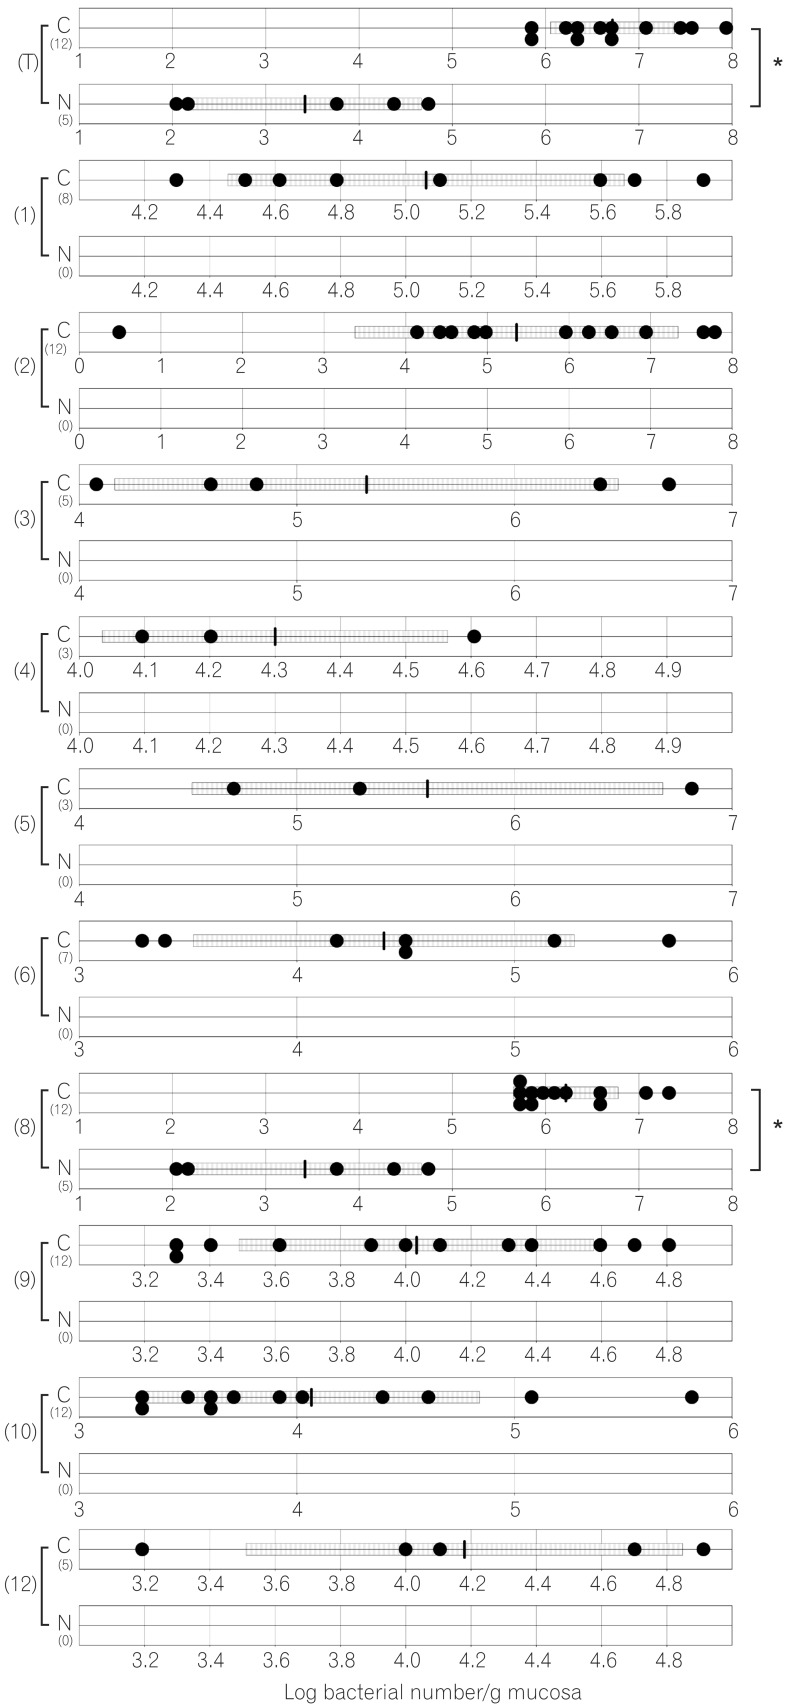
Fig. 3
Number of ileal bacteria in normal and caudal-related homeobox 2 (Cdx2) transgenic mice. C corresponds to results for Cdx2 transgenic mice, N corresponds to results for normal mice. (T) Number of total bacteria; (1) number of Clostridium coccoides group; (2) number of Clostridium leptum subgroup; (3) number of Bacteroides fragilis group; (4) number of Bifidobacterium; (5) number of Atopobium cluster; (6) number of Prevotella ; (8) number of total Lactobacillus ; (9) number of Enterobacteriaceae ; (10) number of Enterococcus ; (11) number of Streptococcus ; (12) number of Staphylococcus. The SD value of the bacterial number for each group is shown as a bar. *P<0.05.
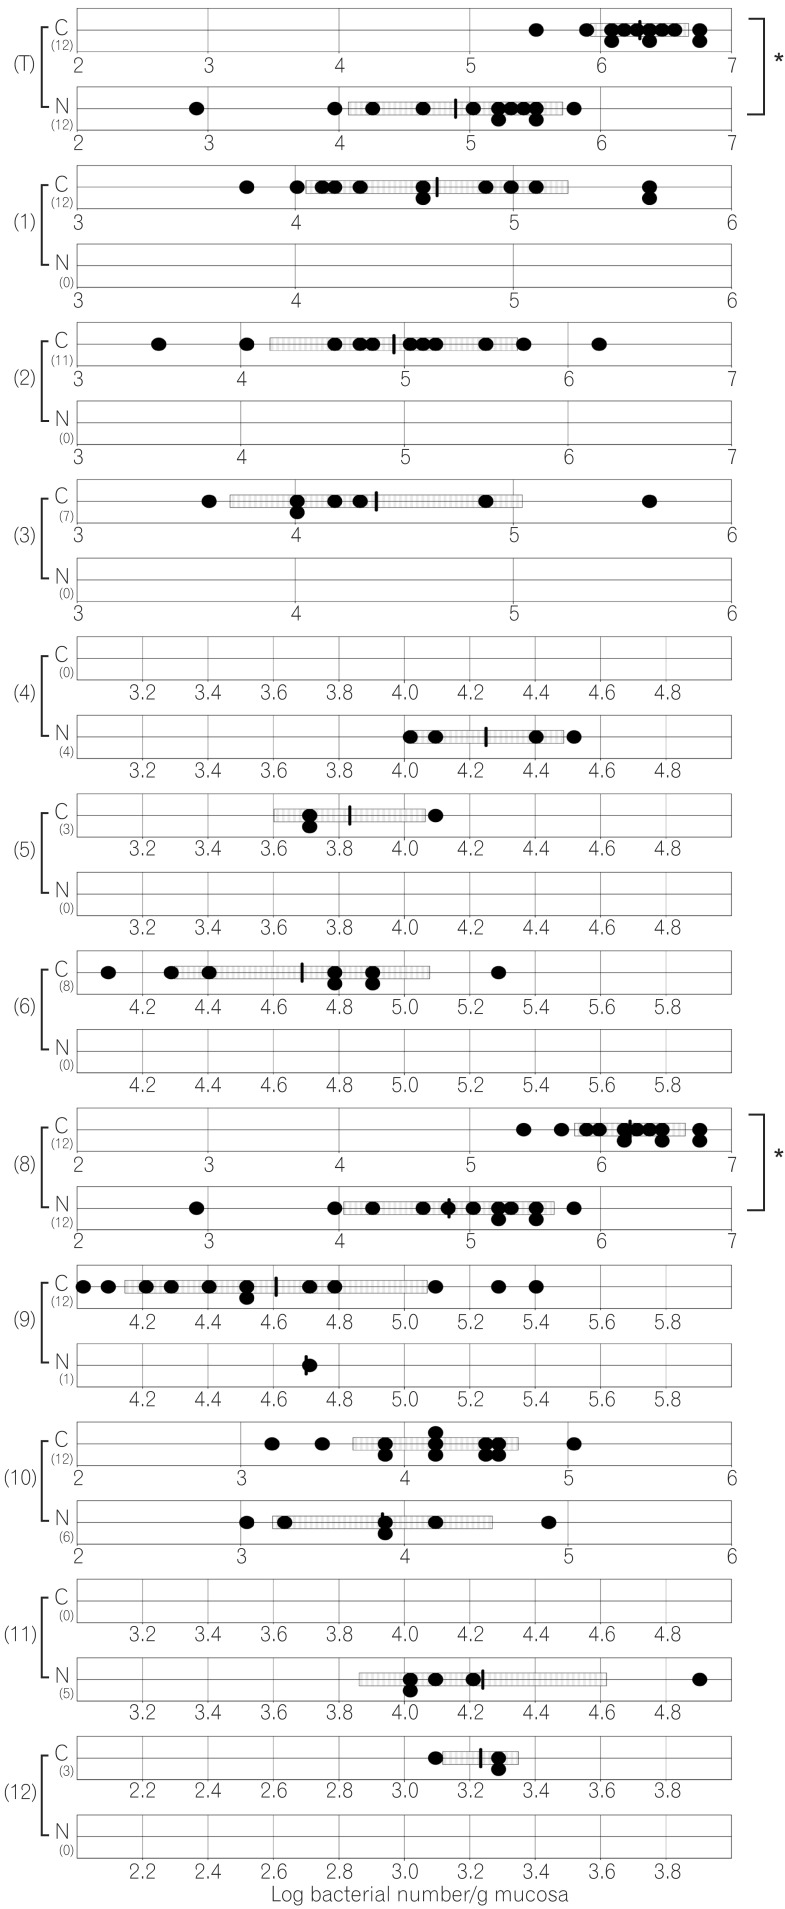
Fig. 4
Number of cecal bacteria in normal and caudal-related homeobox 2 (Cdx2) transgenic mice. C corresponds to results for Cdx2 transgenic mice; N corresponds to results for normal mice. (T) Number of total bacteria; (1) number of Clostridium coccoides group ; (2) number of Clostridium leptum subgroup; (3) number of Bacteroides fragilis group; (4) number of Bifidobacterium; (5) number of Atopobium cluster; (6) number of Prevotella ; (8) number of total Lactobacillus ; (9) number of Enterobacteriaceae ; (10) number of Enterococcus ; (11) number of Streptococcus ; (12) number of Staphylococcus. The SD value of the bacterial number for each group is shown as a bar. *P<0.05.
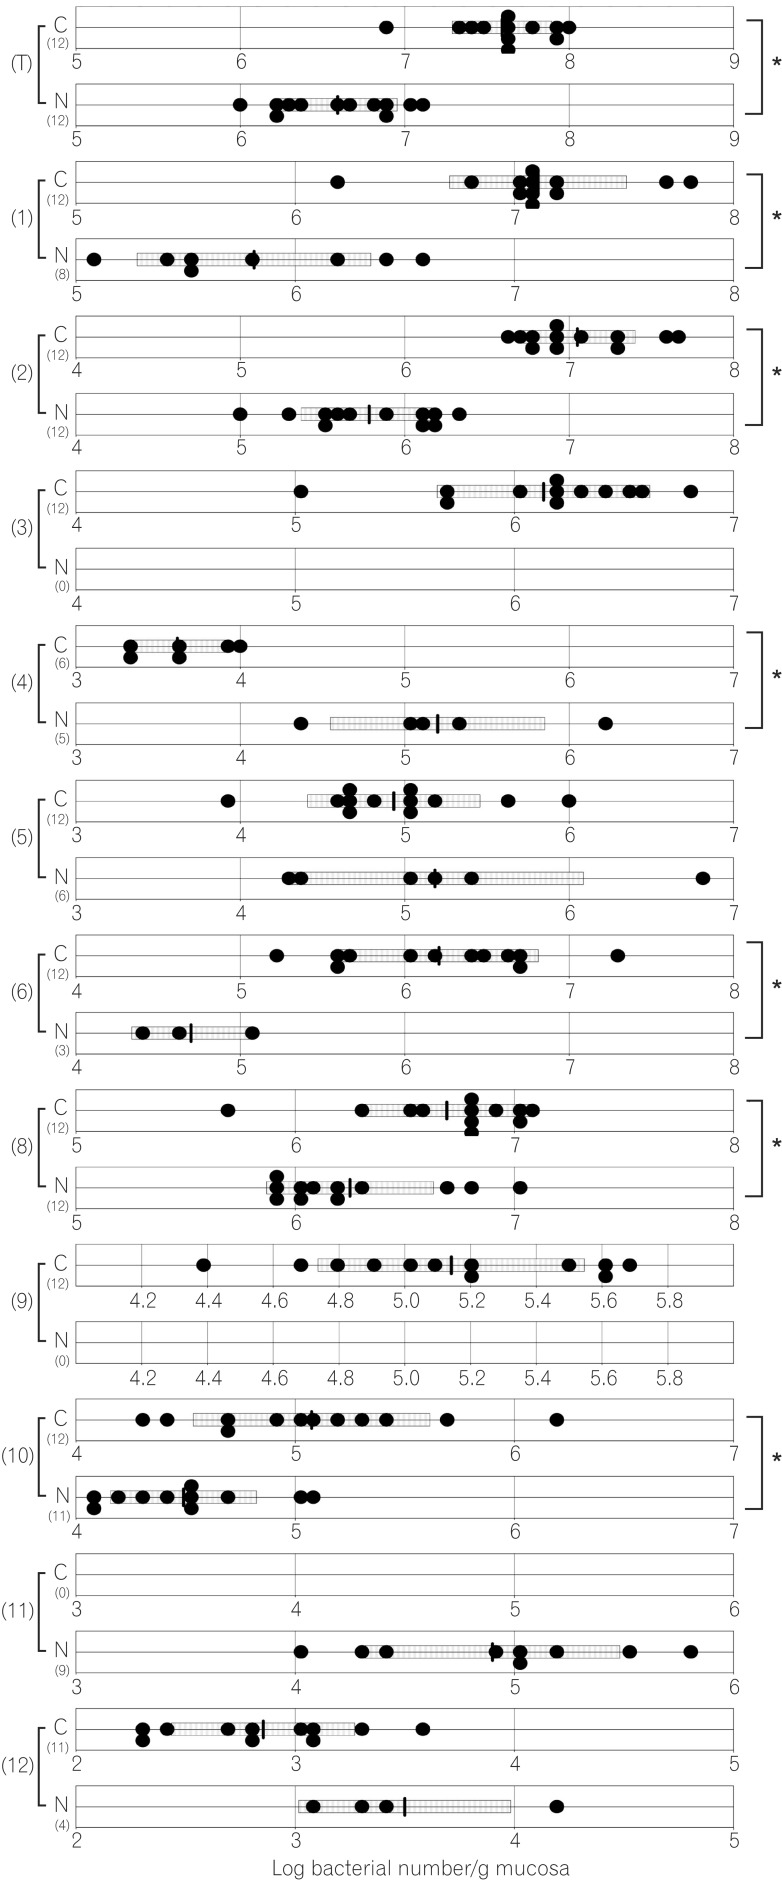
Fig. 5
Number of colonic bacteria in normal and caudal-related homeobox 2 (Cdx2) transgenic mice. C corresponds to results for Cdx2 transgenic mice; N corresponds to results for normal mice. (T) Number of total bacteria; (1) number of Clostridium coccoides group; (2) number of Clostridium leptum subgroup; (3) number of Bacteroides fragilis group; (4) number of Bifidobacterium; (5) number of Atopobium cluster; (6) number of Prevotella ; (8) number of total Lactobacillus ; (9) number of Enterobacteriaceae ; (10) number of Enterococcus ; (11) number of Streptococcus ; (12) number of Staphylococcus. The SD value of the bacterial number for each group is shown as a bar. *P<0.05.
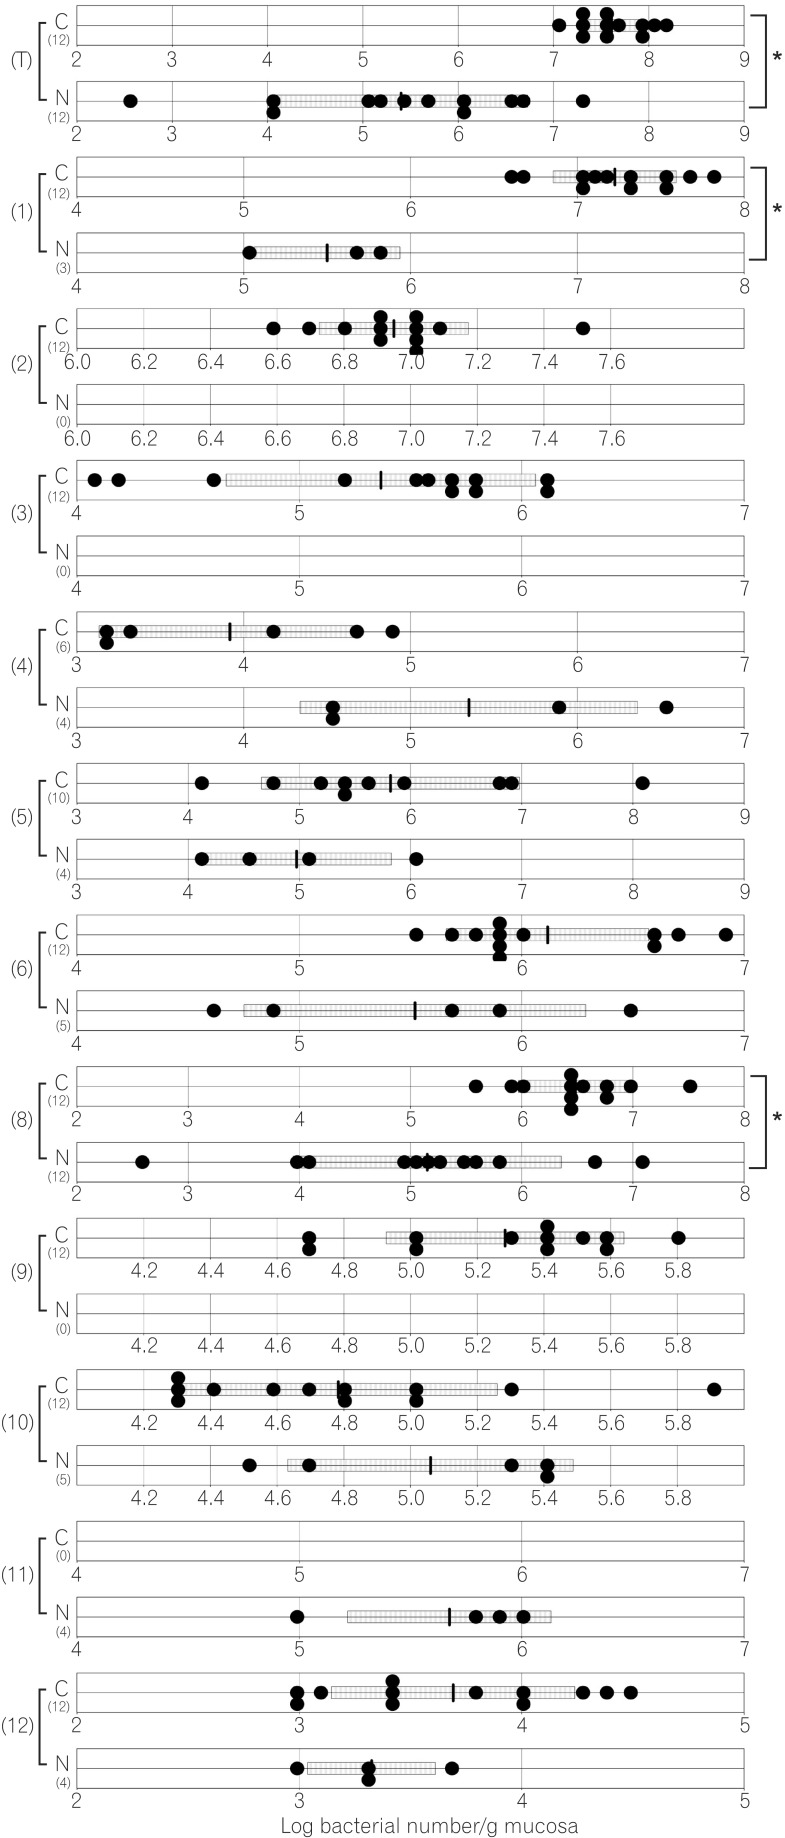
Fig. 6
Number of fecal bacteria in normal and caudal-related homeobox 2 (Cdx2) transgenic mice. C corresponds to results for Cdx2 transgenic mice; N corresponds to results for normal mice. (T) Number of total bacteria; (1) number of Clostridium coccoides group; (2) number of Clostridium leptum subgroup; (3) number of Bacteroides fragilis group; (4) number of Bifidobacterium; (5) number of Atopobium cluster; (6) number of Prevotella ; (8) number of total Lactobacillus ; (9) number of Enterobacteriaceae ; (10) number of Enterococcus ; (11) number of Streptococcus ; (12) number of Staphylococcus. The SD value of the bacterial number for each group is shown as a bar. *P<0.05.


 PDF
PDF ePub
ePub Citation
 Print
Print


 XML Download