INTRODUCTION
Lipopolysaccharide (LPS) is a molecule formed by lipids and polysaccharides and is the major cell wall component of gram-negative bacteria. It can be released during bacterial cell division or death. LPS is considered an endotoxin that activates Toll-like receptors 2 and 4 (TLR2 and TLR4)
1 and plays a crucial role in the pathophysiology of inflammation, sepsis, and shock caused by gram-negative bacteria. Once LPS is released systemically, monocytes and phagocytic cells produce large amounts of cytokines such as tumor necrosis factor-α (TNF-α), interleukin-6 (IL-6), and IL-8.
23 Conditions associated with abnormal intestinal permeability may increase LPS absorption and induce a state of metabolic endotoxemia characterized by elevated serum LPS concentration.
45 The origin of metabolic endotoxemia is still unclear, but it is strongly suggested that it may be associated with changes in the gut microbiota, especially in diets with high fat content, leading to increased activation of inflammatory pathways and impaired insulin signaling.
1
CD is characterized by an autoimmune transmural bowel inflammatory process based on increased production of inflammatory cytokines, such as interleukins and TNF-α.
6 Changes in gut microbiota and bowel permeability are observed in CD. It has also been speculated that LPS may be related to the etiology of inflammation in CD. With increased bowel permeability, gut bacterial overgrowth occurs in IBD.
45 The combination of abnormal microbiota and a damaged mucosal barrier may increase serum LPS levels.
7
High LPS levels are also known to block CD26 expression by activating TLR4. CD26, also known as dipeptidyl peptidase IV (DPP-IV), is a multifunctional type II transmembrane glycoprotein. It has been shown to play a crucial role in T cell activation, natural killer cells, and immune system functions.
8 CD26 also potentially modulates immune responses by directly regulating lymphocytes. Serum CD26 levels are generally decreased in individuals with arthritis,
910 lupus erythematous, human immunodeficiency virus,
8 and IBD.
11 Changes in serum CD26 levels in other situations might reflect changes in levels released by lymphocytes. Several studies evaluated CD26 serum levels in IBD with conflicting results. Moran et al.
10 showed that CD26 levels are is reduced in tissue and plasma during active CD. This finding is unlikely to just represent the downregulation induced by inflammation since this key proinflammatory cytokine (TNF-α) strongly upregulates CD26 expression. Another study showed that CD26 activity in serum was inversely correlated with known disease activity scores.
11
Both LPS and CD26 may interfere in the immune system directly and little is known about LPS toxin in IBD. Therefore, this study aimed to determine the serum levels of LPS and CD26 in CD subjects and correlate them with disease activity (CDAI) and levels of CRP, interleukins, and TNF-α.
Go to :

METHODS
1. Patients
This was a cross-sectional single-center study, performed in individuals with previously diagnosed CD and healthy controls.
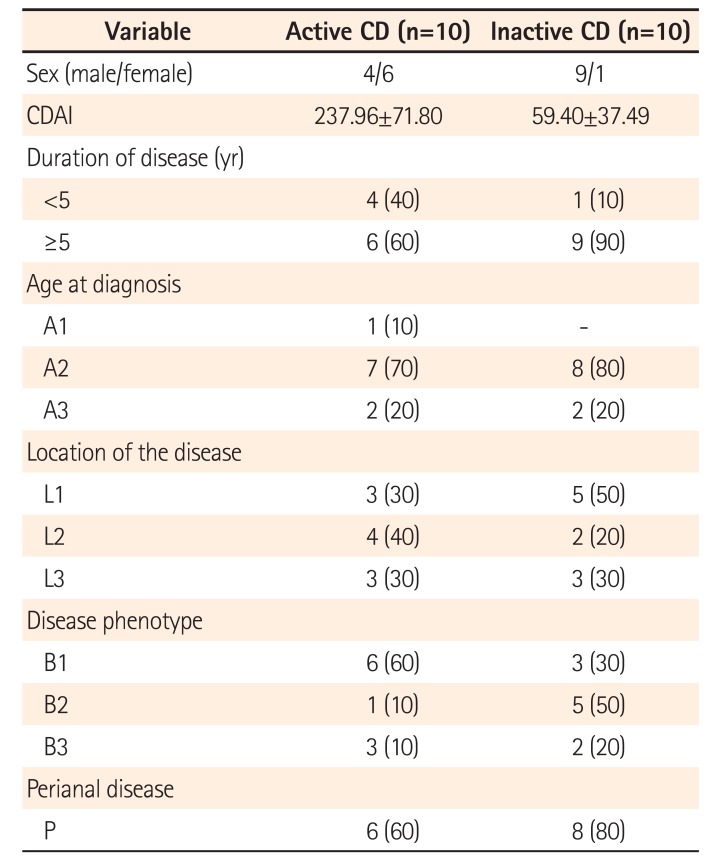
Between August 2014 and March 2015, at the IBD clinics of Campinas State University (UNICAMP), in Campinas, Brazil, 27 consecutive individuals were studied. From those, 10 patients had active CD, 10 had inactive CD, and 7 were healthy controls. The control group was recruited among healthy volunteers (women) who worked or studied at the University.
Disease activity in CD patients was assessed by the CDAI.
12 A score under 150 indicated inactive disease (clinical remission), while a CDAI score above 150 indicated active disease. After providing their informed consent, patients had their blood samples collected during routine consultations in the IBD clinics.
2. Laboraytory Test
The levels of TNF-α, IL-1β, IL-6, IL-17, CD26, and CRP were determined using an ELISA kit (R&D Systems Inc., Minneapolis, MN, USA). LPS was determined from sterile serum samples that were diluted to 20% (vol/vol) with endotoxin-free water and then heated to 70℃ for 10 minutes to inactivate serum proteins. LPS was quantified using a commercially available Limulus Amebocyte assay (Cambrex, Walkersville, MD, USA), according to the manufacturer's protocol. The levels of the previously described molecules were then correlated to disease status (active or inactive) at the moment of the consultation, using the CDAI. In the controls, simple measurements were performed, with no correlation with any disease status.
The protocol was approved by the Institutional Ethics Review Board at UNICAMP, in Campinas, Brazil, under reference number 245/2010.
3. Statistical Analysis
The results were expressed as means±SD. To compare the results obtained from the 2 groups, Mann-Whitney test was used. To compare among more than 2 groups, we used the Kruskal-Wallis test for nonparametric variables. To correlate LPS and CD26 with other variables, Spearman correlation tests were used. Statistical significance was assumed if P<0.05 for all statistical tests. Statistical analyses were used according to SPSS version 16.0 (SPSS Inc., Chicago, IL, USA).
Go to :

DISCUSSION
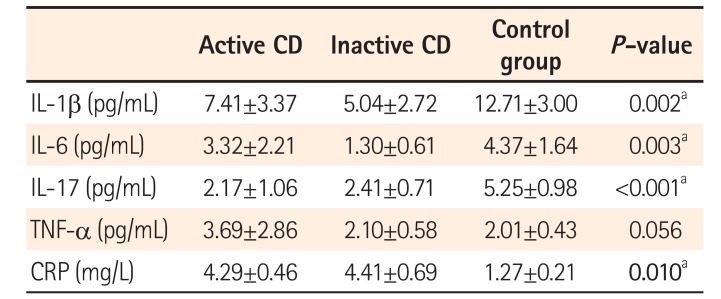
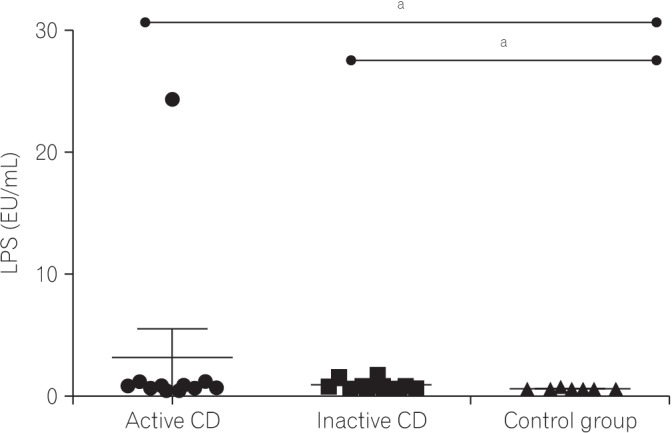
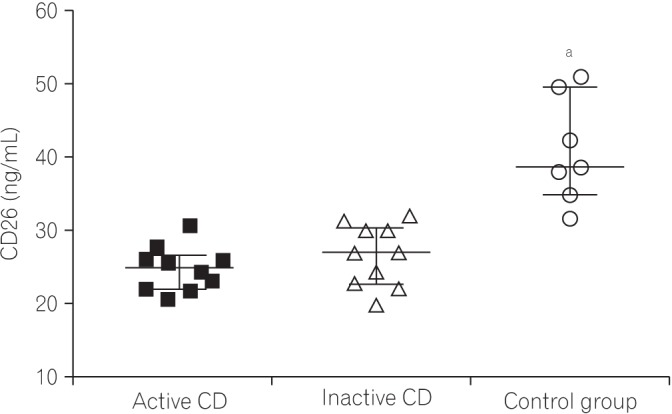
In the present study, 6-fold and 2-fold increases in LPS levels were observed in active CD individuals and inactive CD individuals, respectively, as compared to healthy controls. There was no correlation between LPS and CDAI in both the CD group. Moreover, there was increase in TNF-α, IL-1, IL-6, and CRP levels, along with lower levels of IL-17 and CD26 in the active CD group. These results suggest a positive correlation between disease severity and the inflammatory activity.
An association between high LPS levels and IBD has been historically observed. As early as 1978, it was demonstrated by Aoki
14 that serum LPS levels were associated with metabolic endotoxemia caused by intestinal barrier damage, worsening of UC, and CD. Wellmann et al.
7 also observed high endotoxin levels among individuals with active CD. Recently, Guo et al.
15 demonstrated that LPS levels were increased in patients with active CD compared with patients in the control group, and were also correlated with CDAI.
Intestinal homeostasis maintenance depends on a complex dynamic array between intestinal epithelial cells, gut microbiota, and local immune cells. The pathogenesis of IBD is very likely related with these interactions.
1617
Active CD is associated with strongly increased basal levels of circulating LPS, signaling an impairment in the mechanisms responsible for maintaining the intestinal mucosal barrier. Hölttä et al.
18 suggested that activation of the IL-23/IL-17 axis is fundamentally connected to CD etiology and may represent the basis for the relapsing nature of the disease by increasing the sensitivity of the epithelium to microbial LPS. In our study, IL-17 levels were decreased in active CD patients when compared to controls, possibly due to the continuous use of immunomodulators in this population.
There is accumulating evidence regarding the influence of gut microbiota on LPS levels and inflammatory activity. Butler et al.
19 observed that although dietary microparticles per se have limited effects on basic macrophage functions, their ability to act as adjuvants along with bacterial antigens such as LPS could aggravate ongoing inflammatory responses towards bacterial antigens in the gastrointestinal tract. The composition of gut microbiota may play a critical role in these pathophysiological events. Changes in the gut microbiota have been reported in CD, mainly a reduction in the microbial diversity, as well as an increase in the presence of adherent-invasive
Escherichia coli.
2021
In our study, we observed a 6-fold increase in LPS levels in active CD individuals and a 2-fold increase in inactive CD individuals, a finding that represents that the CD groups evaluated in this study are very likely to exhibit metabolic endotoxemia.
In our results, TNF-α levels were not significantly different between the CD patients and control patients. This finding mostly can be explained by the fact that some patients in the CD groups had their serum levels measured during continuous therapy with anti-TNF agents such as infliximab or adalimumab.
Impaired DPP-4/CD26 enzyme activity has been reported in a number of inflammatory states. In IBD, a significant decrease in plasma activity of this enzyme has been observed and is negatively correlated with disease activity markers such as CDAI and CRP.
9 In our study, there was no correlation between CD26 and CRP, CD26, or CDAI, but in CD groups, CD26 levels were reduced and CRP was elevated compared to levels in the control group. Guo et al.
15 also observed that patients in CD groups present higher CRP levels compared to levels in healthy controls.
The significantly negative correlation between DPP-4 and CRP could potentially highlight a role for CD26 as a surrogate biomarker for disease activity in IBD, particularly if reduced enzyme activity might directly influence the pathophysiology of this condition.
9 In addition, attenuation of disease activity in individuals with rheumatoid arthritis through TNF-α blockade increases plasma CD26 enzyme activity.
910 These findings were strongly reinforced in this study, since the control group presented with lower levels of CRP and higher CD26 secretion. It is reasonable to suppose that since the ultimate role played by CD26 in IBD could be identified, these individuals would benefit from therapies targeting CD26 activity, which might be achieved by means of TLR4 blockade or even direct CD26 antagonism.
The highly elevated LPS levels observed among CD individuals may predict the long-term development of potentially harmful conditions, especially insulin resistance and cardiovascular disease,
8 in this population. Therapies targeting this abnormality or its immediate consequences have the potential to improve the general homeostatic state and avoid these negative effects, possibly leading to improved life expectancy. Nutritional counseling towards the importance of low-fat content diets,
1 mainly avoiding omega-6 fatty acids, may directly affect the gut microbiota and thereby decrease chronic endotoxemia.
2223 Interventions on gut microbiota aiming to eliminate potentially harmful bacteria by means of antibiotic therapy, prebiotics, or probiotics may play a role in controlling intestinal permeability and endotoxemia. Pharmacologic blockade of TLR4 may also improve LPS-mediated chronic inflammation.
17
This study still has some limitations that must lead to a cautious interpretation of its results. First, it was performed in a small patient population. Second, measuring inflammatory status during continuous CD therapy (mainly biological agents) may have biased the results of some of the molecules that were measured.
In summary, our study demonstrated that individuals with CD exhibited higher serum levels of LPS, with an increase varying from 2- through 6-fold depending on the disease activity when compared to healthy controls, and CD26 levels were lower in the CD groups. Both LPS and CD26 levels correlated with the severity of the disease and serve as biomarkers of CD. Future implications of these findings may correlate these molecules to the inflammatory status of CD, and need to be further studied.
Go to :



 PDF
PDF ePub
ePub Citation
 Print
Print


 XML Download