

 PDF
PDF Citation
 Print
Print


INTRODUCTION
Obesity is a progressive, multifactorial, chronic relapsing disease that has significant societal and global health implications.1 The global prevalence of body mass index (BMI) above 30 kg/m2 has nearly tripled since 1975.2 In 2016, approximately 40% of the total global adult population had a BMI ≥ 25 kg/m2 and 13% of these had a BMI ≥ 30 kg/m2. In particular, the number of obese children and adolescents has increased approximately tenfold over the past four decades.3 In the Korean population, the number of obese people increased sharply after coronavirus disease 2019, and the prevalence of BMI ≥ 25 kg/m2 was 48% of men and 27.7% of women in 2020.4
Excessive accumulation of body fat or adipose tissue caused by weight gain can lead to being overweight or obese. Weight gain in adults is associated with several comorbidities, including type 2 diabetes mellitus, hypertension, cardiovascular disease (CVD), cancer, and osteoarthritis, as well as increased risk of all-cause mortality and CVD.5 Even within the normal weight range, weight gain of 5–8 kg in middle-aged women increases the risk of coronary heart disease by 1.25-fold,6 whereas in men, weight gain of 5–10 kg increases it by 1.6-fold.7 Progressive weight gain from young adulthood to midlife or late adulthood is associated with an increased risk of death.8
The increase in body weight is also associated with higher healthcare costs. A weight gain of 3 kg per year in overweight and obese middle-aged adults is associated with a correspondingly larger increase in total medical costs when compared with those who maintain their weight.9 Patients with type 2 diabetes who gained at least 5% of their baseline body weight and did not maintain glycated hemoglobin (HbA1c) < 7% over 4 years experienced a 14% increase in medical costs.10 With the development of advanced technologies, increasing economic growth, industrialization, mechanized transportation, urbanization, increasingly sedentary lifestyles, and a nutritional transition to processed foods and high-calorie diets, the prevalence of weight gain is expected to increase significantly in the future.11 A recent study reports that rising trends in BMI among children and adolescents have accelerated in parts of Asia and have even plateaued in many high-income countries.3
Asians have a higher risk of obesity-related diseases than Caucasians for a given BMI.12 In fact, the average BMI of Koreans is 24 kg/m24 which is 5 kg/m2 lower than the average BMI of Americans of 29.4 kg/m213 but the prevalence of diabetes was 14.4% in Korea14 and 12.0% in the United States.15 A Chinese study also found that the prevalence of diabetes and hypertension was about twice as high in Chinese with the same BMI range as in Whites.16 Based on these data, it appears that weight gain in Asians may be prone to obesity-related comorbidities. However, there are insufficient data on the prevalence of weight gain and associated comorbidities in Asian populations. Additionally, it is important to evaluate the factors that may lead to weight gain and thus prevent weight gain and the increasing incidence of obesity. Therefore, we investigated the prevalence of, comorbidities, and factors associated with weight gain in Korean adults using a nationally representative study.
METHODS
Data source and study participants
We conducted a cross-sectional study using data from individuals who participated in the Korea National Health and Nutritional Examination Survey (KNHANES) 2016–2019. The KNHANES consists of a health and nutrition survey and a health examination. It provides data on demographic characteristics, health-related behaviors, anthropometric measures, physical examinations, clinical profiles for non-communicable diseases, and dietary intake through face-to-face interviews, as well as biochemical data obtained through blood sampling at mobile examination centers. A stratified, multistage probability sampling procedure is used to select households to participate in the survey.17
We first included all individuals aged 19–64 years who participated in KNHANES during 2016–2019 (n = 19,304). In this study, study subjects were referred to as study subjects 1 and study subjects 2 because they differed in determining the prevalence of weight gain and in analyzing comorbidities and associated factors for weight gain. Study subjects 1 were selected among 19,304 participants except for individuals who did not answer the question about the body weight change (n = 3,790). Data from 15,514 adults (6,521 men and 8,993 women; study subjects 1) were used to analyze the prevalence of weight gain in the general population.
Study subjects 2 were selected from study subjects 1 to compare comorbidities according to the degree of weight gain and to determine the related factors for weight gain with the weight-maintenance group as the control or reference group. We need to exclude cases suspected of pathological weight loss in the past year. Among 15,514 participants, we excluded individuals with cancer, diabetes mellitus, thyroid disease, and renal diseases (n = 1,889), those who had lost weight in the past 1 year (n = 1,603), and those who were missing other variables (n = 545). Finally, data from 11,477 apparently healthy adults (4,867 men and 6,610 women; study subjects 2) were analyzed.
Assessment of body weight gain and lifestyle factors
Data on body weight changes were collected using a self-report questionnaire. The change in body weight was classified into three groups (those who experienced weight loss, no change, and weight gain) based on the following question: “Has your body weight changed compared with 1 year ago?” ‘Weight loss’ was defined when participants answered that their body weight had decreased by ≥ 3 kg compared with 1 year ago. ‘No change’ was defined if participants answered that their body weight had not changed compared with 1 year ago or that it had decreased or increased by < 3 kg. ‘Weight gain’ was defined if they answered that their body weight had increased by ≥ 3 kg compared with 1 year ago. Then, participants who had gained ≥ 3 kg of body weight were asked, “How much have you gained?” and instructed to select an answer from the 3 options: ‘3–6 kg,’ ‘6–10 kg,’ and ‘≥ 10 kg.’
Socioeconomic factors and lifestyle were also assessed using a self-report questionnaire. Educational level was divided into two groups according to whether participants had a higher or lower level of education than high school. Marital status was divided into two groups depending on whether the participants were married or not. Participants were divided into three occupational groups: white-collar, blue-collar, and none. Monthly income levels were divided into two groups: the lowest quartile group and the second lowest to the highest quartile group. Individuals who had consumed at least one alcohol per month in the year preceding the survey were defined as alcohol drinkers and those who did not were defined as never drinkers. Never smokers were defined as those who had either smoked < 100 cigarettes or had never smoked in their lives. Of the participants who had smoked at least 100 cigarettes in their lifetime, those who smoked at the time of the survey were defined as current smokers, and those who did not smoke were defined as ex-smokers. Regular physical activity was defined as exercise on > 2 days per week. Participants were divided into two groups concerning breakfast consumption: those who skipped breakfast and those who did not. Nutritional intake, including total energy, protein, fat, and carbohydrate intake, was estimated using the 24-hour recall method.
Anthropometric and cardiometabolic measurements
Anthropometric parameters included height, body weight, and waist circumference (WC), measured by trained personnel using standard protocols and equipment. Participants’ heights were measured to the nearest 0.1 cm with a stadiometer (SECA 225; SECA, Hamburg, Germany). Body weight was measured to the nearest 0.1 kg on a scale (GL-6000-20; CAS, Yangju, Korea), with participants wearing a light gown or undergarments. WC was measured midway between the lower end of the subcostal area and the upper end of the iliac crest with fiberglass tape. BMI was calculated by dividing body weight (kg) by height (m) squared (kg/m2). According to the World Health Organization’s definition of obesity for the Asia-Pacific region18 and the Korean Society for the Study of Obesity (KSSO),19 BMI was classified as follows: < 18.5, 18.5–22.9, 23–24.9, 25–29.9, and ≥ 30 kg/m2. According to KSSO guidelines, abdominal obesity was defined as WC ≥ 90 cm in men and ≥ 85 cm in women.20 Weight gain of 3–6, 6–10, and ≥ 10 kg were classified as mild, moderate, and severe, respectively. Body weight in the year before the study was arbitrarily calculated as follows: For the groups with weight gain of 3–6, 6–10, and ≥ 10 kg, 4.5, 8, and 12 kg, respectively, were subtracted from the current weight of the study subjects 2.
Blood pressure (BP) was measured thrice with a sphygmomanometer in the sitting position.21 Participants rested in the sitting position for a few minutes before starting the BP measurements. BP was measured thrice at 30-second intervals. The average values of the second and third measurements were used for analyses. A blood sample was taken from each participant after fasting overnight for 8 hours. Fasting plasma glucose (FPG) was analyzed using the reaction between glucose and adenosine triphosphate catalyzed by the enzyme hexokinase ultraviolet (UV) (Hitachi Automatic Analyzer 7600-210; Hitachi, Tokyo, Japan), and HbA1c was measured using high-performance liquid chromatography (Tosoh G8; Tosoh, Tokyo, Japan). Concentrations of total cholesterol (TC) and triglycerides (TGs) were measured by an enzymatic method. Serum levels of high-density lipoprotein cholesterol (HDL-C) and low-density lipoprotein cholesterol (LDL-C) were analyzed by a homogeneous enzymatic colorimetric method. Alanine aminotransferase (ALT) was measured using International Federation of Clinical Chemistry methods and UV without pyridoxal-5-phosphate (Hitachi Automatic Analyzer 7600-210; Hitachi). Elevated BP was defined as systolic BP ≥ 130 mmHg or diastolic BP ≥ 85 mmHg. Elevated FPG, TG, and LDL-C levels were defined as ≥ 100 mg/dL, ≥ 150 mg/dL, and ≥ 130 mg/dL, respectively. Low HDL-C was defined as HDL-C < 40 mg/dL in men and < 50 mg/dL in women. ALT ≥ 40 IU/L was defined as an elevated level.
Statistical analyses
We extracted and combined the data from the 2016–2019 KNHANES in accordance with the KNHANES raw data analysis guidelines. Because of the complex nature of the sample design, we conducted all analyses by assigning a dispersed stratification estimate, stratification variables, and weighted sample values. Continuous variables were analyzed using the general linear model and presented as means and standard errors. Categorical variables were presented as ratios and standard errors and analyzed using the χ2 test. The prevalence of weight gain as a function of the age group and baseline BMI was analyzed using the trend test. We performed multivariable logistic regression analysis and calculated odds ratios (ORs) and 95% confidence intervals (CIs) adjusted for age, education, marital status, occupation, income, alcohol consumption, smoking status, physical activity, and skipping breakfast to assess the factors associated with weight gain in men and women, respectively. The P value < 0.05 indicated statistical significance. All analyses were performed using SPSS version 24.0 (IBM Corp., Armonk, NY, USA).
Ethics statement
All participants gave written informed consent to participate in the study. The survey was approved by the Institutional Review Board of the Korea Centers for Disease Control and Prevention (IRB No: 2018-01-03-P-A and 2018-01-03-C-A). The study complied with the tenets of the Declaration of Helsinki, the Ethical Guidelines for Clinical Research, and the Act on the Protection of Personal Information.
RESULTS
General characteristics of the study participants
Table 1 presents the general characteristics of study subjects 1 and 2. For study subjects 1, the mean age was 41.4 ± 0.2 years for men and 42.4 ± 0.2 years for women. Mean BMI and WC were 24.7 ± 0.1 kg/m2 and 86.4 ± 0.1 cm in men and 23.0 ± 0.1 kg/m2 and 77.3 ± 0.1 cm in women. Energy intake was 2,452 ± 16 kcal/day in men and 1,718 ± 10 kcal/day in women. The proportion of alcohol drinkers, current smokers, and participants with regular physical activity was 74.1%, 38.2%, and 52.9% in men and 51.0%, 6.4%, and 47.0% in women, respectively. The characteristics of study subjects 2 were similar to those of study subjects 1.
Table 1
General characteristics of study subjects 1 and study subjects 2
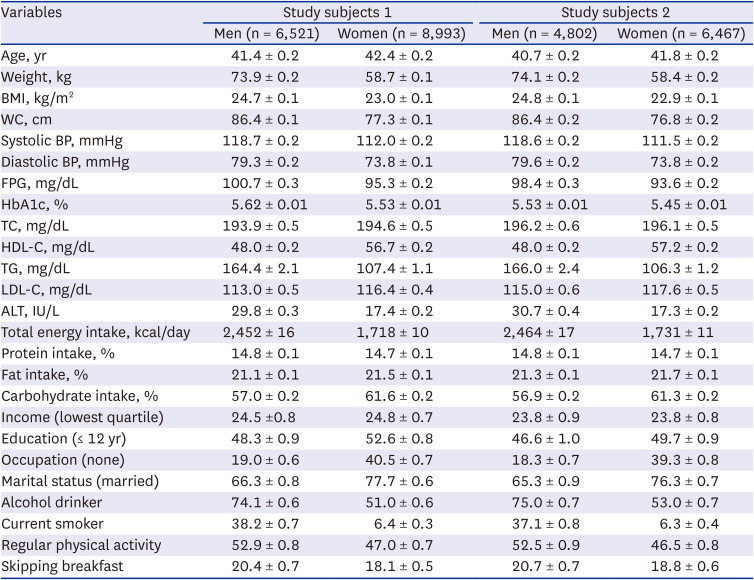
Values are presented as mean value ± SE or percentage ± SE.
BMI = body mass index, WC = waist circumference, BP = blood pressure, FPG = fasting plasma glucose, HbA1c = glycated hemoglobin, TC = total cholesterol, HDL-C = high-density lipoprotein cholesterol, TG = triglyceride, LDL-C = low-densitsy lipoprotein cholesterol, ALT = alanine aminotransferase, SE = standard error.
Prevalence and patterns of weight gain according to age groups
Of the study subjects 1, who had answered the question about changes in their body weight (n = 15,514), 58.8% had maintained their body weight; 12.8% of participants had decreased weight, and 26.4% of participants had increased weight. Overall, 25.7% of men and 31.3% of women had gained weight in the previous year.
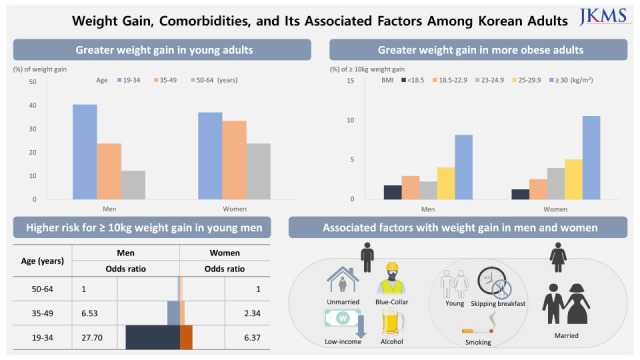
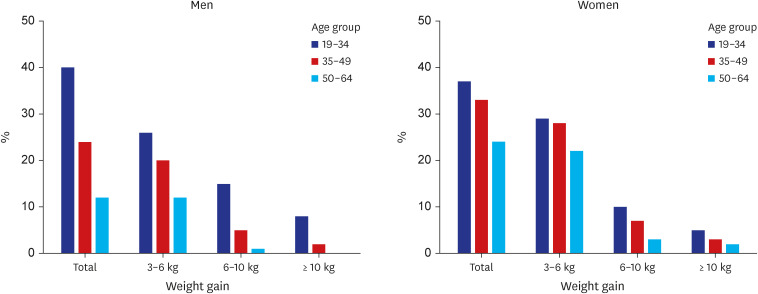
The prevalence of weight gain of 3–6, 6–10, and ≥ 10 kg was 19.5%, 6.9%, and 3.2% in men and 26.0%, 6.4%, and 3.2% in women, respectively. Fig. 1 shows the prevalence of weight gain by age group in men and women among study subjects 1. Among adults aged 19–34, 35–49, and 50–64 years, the prevalence of weight gain was 40.4%, 23.8%, and 12.2% in men and 37.0%, 33.4%, and 23.8% in women, respectively. For both sexes, the rates in all weight gain groups were significantly higher in the younger age groups than in the older age groups in a graded fashion (P for trend < 0.001).
Proportions of severe and moderate weight gain according to calculated BMI 1 year prior
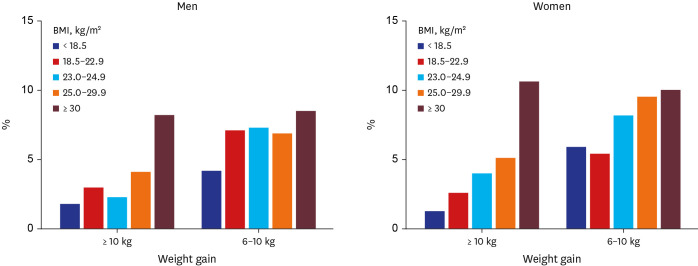
Fig. 2 shows the proportions of severe and moderate weight gain by calculated BMI 1 year before the survey among study subjects 2. The more obese the participants already were, the greater the tendency to gain weight. In the group whose calculated BMI in the previous year was ≥ 30 kg/m2, the rates of severe (≥ 10 kg) and moderate (6–10 kg) weight gain were highest compared with the other BMI groups: 8.2% and 8.5% for men and 10.6% and 10.0% for women, respectively.
Anthropometric measurement, cardiometabolic parameters, and nutrition intakes according to weight gain amount
Table 2 presents the anthropometric measures, cardiometabolic parameters, and food intake of the study participants as a function of weight gain. As weight gain increased, the mean age decreased in both sexes. Mean weight, BMI, and WC increased with greater weight gain. Systolic BP in men and diastolic BP in women also increased with greater weight gain. FPG levels in women tended to increase with weight gain, whereas FPG and HbA1c levels in men tended to decrease. In men, LDL-C and ALT levels increased, and HDL-C levels decreased with weight gain, whereas in women, TC, TG, and ALT levels increased. In men, weight gain increased with fat intake (%), whereas carbohydrate intake (%) decreased in both sexes.
Table 2
Anthropometric measurement, cardiometabolic parameters, and nutrition intake according to weight gain amount in study subjects 2
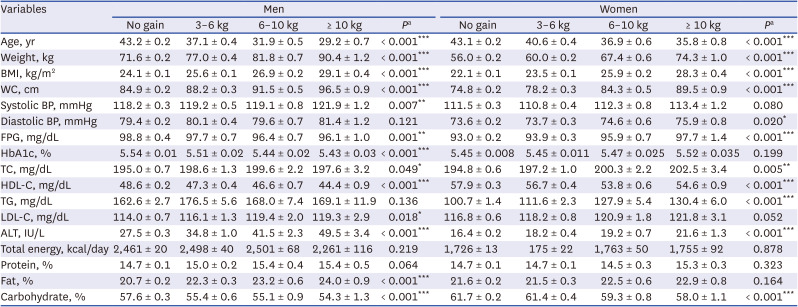
Values are presented as mean value ± standard error.
BMI = body mass index, WC = waist circumference, BP = blood pressure, FPG = fasting plasma glucose, HbA1c = glycated hemoglobin, TC = total cholesterol, HDL-C = high-density lipoprotein cholesterol, TG = triglyceride, LDL-C = low-density lipoprotein cholesterol, ALT = alanine aminotransferase.
aP values obtained using a generalized linear model.
*P < 0.05; **P < 0.01; ***P < 0.001.
Proportions of obesity, abdominal obesity, and cardiometabolic risk factors according to weight gain amount
Table 3 shows the proportions of obesity, abdominal obesity, and cardiometabolic risk factors according to the amount of weight gain in study subjects 2. The rates of obesity and abdominal obesity tended to increase in the groups with greater weight gain in both sexes (P for trend < 0.001). The rate of obesity in the group with weight gain ≥ 10 kg was 87.0% in men and 77.5% in women, and the rate of abdominal obesity in this group was 76.0% in men and 81.7% in women. With increasing weight gain, the rates of increased FPG in all groups increased in women but decreased in men. Rates of elevated TG, low HDL-C, and ALT tended to increase with weight gain in both sexes. The trend toward an increase in the rate of elevated LDL-C with increasing weight gain was significant only in men.
Table 3
Prevalence of obesity, abdominal obesity, and cardiometabolic risk factors according to weight gain amount in study subjects 2
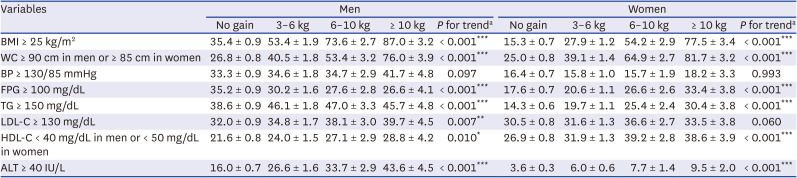
Values are presented as percentage ± standard error.
BMI = body mass index, WC = waist circumference, BP = blood pressure, FPG = fasting plasma glucose, TG = triglyceride, LDL-C = low-density lipoprotein cholesterol, HDL-C = high-density lipoprotein cholesterol, ALT = alanine aminotransferase.
aP for trend was obtained using analysis of variance.
*P < 0.05; **P < 0.01; ***P < 0.001.
Multivariate logistic regression analysis for weight gain according to age group, socioeconomic, and lifestyle factors
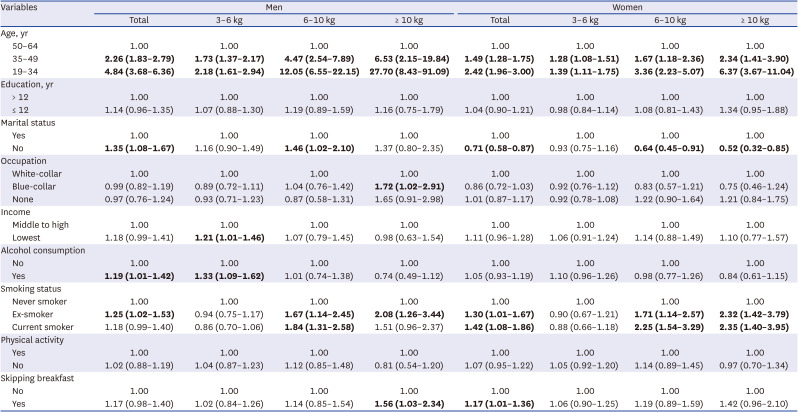
Table 4 shows a multivariate logistic regression analysis for the relationship between age group, socioeconomic factors, lifestyle, and weight gain among study subjects 2. After adjustment for confounding variables, the likelihood of weight gain increased in younger age groups compared with older age groups in both sexes. This finding was more pronounced in men than in women. The ORs (95% CIs) for severe and moderate weight gain in men aged 19–34 years compared with older age groups were 27.70 (8.43–91.09) and 12.05 (6.55–22.15), respectively, showing a steeply increasing pattern, whereas in women in this age group, they were 6.37 (3.67–11.04) and 3.36 (2.23–5.07), respectively. Regarding socioeconomic status concerning weight gain, unmarried men were more likely to gain body weight, whereas, among women, married participants were more likely to gain body weight than their unmarried counterparts. Men with blue-collar jobs had a higher risk of major weight gain than those with white-collar jobs, and men with the lowest income levels had a higher risk of minor weight gain than those with middle to high-income levels. Regarding lifestyle factors associated with weight gain, male alcohol users were at risk for weight gain. Regarding smoking status, ex-smokers had a higher risk of weight gain for both sexes. Male smokers who were current smokers were at risk of moderate weight gain, and females who were current smokers were at risk for moderate to severe weight gain. Adults who skipped breakfast were at risk for weight gain in both sexes.
Table 4
Adjusted odds ratios and 95% confidence intervals for weight gain according to sociodemographic and lifestyle factors in study subjects 2
DISCUSSION
This study shows that young age is the strongest risk factor for weight gain in the Korean adult population. In the younger age group, the rates for all categories of weight gain were significantly higher in both sexes. Similar to our results, a recent longitudinal study in England showed that adults in the youngest age group were more likely to transition from normal weight to overweight or obese than those in the oldest age group.22 Not only stable obesity in adulthood but also weight gain from young to middle adulthood is associated with an increased mortality risk.8 These findings imply that preventing weight gain in early adulthood and maintaining a normal weight throughout adulthood is important to prevent premature death later in life.
Generally, young adulthood is a time of pronounced weight gain.23 Major lifestyle changes during this transitional period include moving from school to college, leaving the parental home, and new employment.24 The causes of weight gain appear to be primarily related to lifestyle, including less healthy eating habits25 and reduced physical activity.26 Consumption of packaged foods, skipping breakfast, excessive alcohol consumption, and a sedentary lifestyle have been associated with weight gain in young adults.27 Poor lifestyle factors are more prevalent among Koreans of both sexes in the young age groups than in the older age group. In particular, young Korean adults like to eat a high-fat diet and have already adopted Western dietary habits such as the consumption of fast food and processed foods. The likelihood of moderate and severe weight gain in the younger age group was more prevalent in men than in women. Young Korean men were found to have a very low awareness of obesity and neglect to deal with it.28 Evidence suggests that once weight is gained in early adulthood, it is difficult to lose it, and the trend of weight gain often continues into later adulthood.29 Therefore, lifestyle interventions are needed to prevent the harmful trend of weight gain in the young population.27
Our results show certain gender differences in weight gain among Korean adults. Women aged 35–64 years had higher weight gain than men of the same age. In other studies, weight gain and obesity are more prevalent in women than men.3031 Accordingly, in our study, weight gain in the general population was more prevalent in women, 31.3%, than in men, 25.7%. This is partly due to the fluctuations in sex hormones during different reproductive phases, such as menarche, pregnancy, and transition to menopause, which affect the expansion of adipose tissue.31 Women aged 50–64 years had higher weight gain than men in the same age group, which is probably due to menopause. Consistently, hormonal changes during menopause are associated with increased fat and abdominal fat in women.3132 Estrogen plays a critical role in controlling food intake and regulating adipose tissue distribution through interaction with orexigenic and anorexigenic neuropeptides.33 Therefore, estrogen deficiency is a major cause of weight gain in postmenopausal women. Additionally, lifestyle habits, including low physical activity, are also associated with weight gain in this group.32
In addition, our study showed that severe weight gain (≥ 10 kg) was more pronounced in more obese individuals. This was probably because they had already adopted and continued unhealthy lifestyle habits. One study has shown that obesity is an increased risk of its obesogenic factor that triggers weight gain.34 A previous study has shown that factors associated with weight gain in adults with obesity are a lack of ability to control one's behavior or overcome obstacles, emotional stress, and physical inactivity.35 Therefore, it is necessary to strictly reinforce unhealthy lifestyle changes to prevent a vicious cycle in obese individuals because weight gain in adulthood is associated with a higher risk of coronary heart disease,6 stroke,36 cancer,37 and mortality.38 In our study, almost all obesity indices and cardiometabolic parameters worsened with the degree of weight gain, even when the mean age decreased. This suggests that in Korean adults, the cardiometabolic risk may increase even in young people if they gain a lot of weight. Prevention of excessive weight gain in young adults should be considered an important aspect of health policy in Korea. Although body weight and BMI differed between groups, they were not adjusted because body weight and BMI in Table 2 are influenced by the degree of weight gain in the past year. If body weight or BMI were adjusted in the statistical model, the possibility of adjustment for weight gain itself could not be excluded. We attempted to present the difference in obesity indices and cardiometabolic parameters as dependent variables as a function of weight gain as an independent variable in a simple comparison table.
In our results, the different factors were associated with weight gain. Socioeconomic status is related to weight gain and obesity,3940 and the patterns of association between socioeconomic status and weight gain are sex-specific.41 In terms of marital status, this study showed that unmarried men, whereas married women, were more likely to gain weight. Our results differed somewhat from those of other studies,42 suggesting that marital status has a different effect on weight change in different cultures. As in a previous study,42 factors such as pregnancy, childbirth, eating habits, physical activity, and attitudes toward body weight might differ between men and women before and after marriage. A blue-collar job and low income were significantly associated with weight gain in men. Because high-energy diets are associated with lower costs,43 low-income men primarily consume these foods and are more likely to gain weight.
Behavioral factors are also important determinants of weight gain.44 In this study, alcohol consumption was found to be significantly associated with weight gain in men, and smoking status and skipping breakfast were significantly associated with weight gain in both sexes. Another study had shown that alcohol consumption was positively associated with weight gain.45 Energy ingested with alcohol is additive to that from other food sources, providing 7 kcal/g of intake.46 In addition, alcohol causes increased energy intake by inhibiting the action of leptin.47 Regarding smoking, individuals who quit gained 4.1 kg over 5 years48 because nicotine withdrawal affects the central nervous system.49 Heavy smokers are more likely to gain weight, which appears to be related to the prevalence of risk behaviors, including poor diet and alcohol consumption and lower socioeconomic status.50 It is widely believed that skipping breakfast leads to weight gain.51 Skipping breakfast may lead to upregulation of appetite or overcompensation for the lack of energy in the morning by higher energy expenditure, possibly leading to weight gain over time.51 In addition, our study shows that weight gain increased when fat intake increased in men and carbohydrate intake decreased in both sexes. Another study reported that consumption of fat, such as from snacks, was associated with a higher risk of obesity in both sexes.52
Although some factors did not occur significantly in the overall group, these factors were significant only in a subgroup when the degree of weight gain was divided into subgroups of mild, moderate, and severe weight gain. Conversely, other factors were significant in the overall group but did not occur significantly in the subgroups which is attributed to insufficient statistical power in the subgroups. When significance does not occur in the overall group but only in the subgroups, it cannot be concluded that there is no relationship. Therefore, we interpreted the variables that were significant in the overall group or the subgroups as relevant factors for weight gain in this study.
This study has several limitations. First, because it was a cross-sectional study, causal relationships between associated factors and weight gain could not be established. Second, because the KNHANES 2016–2019 did not include body composition data, participants’ fat and fat-free mass could not be analyzed. Third, we arbitrarily calculated baseline body weight using data from a self-reported questionnaire; therefore, it might be inaccurate. Fourth, we could not rule out the possibility that participants underreported their food intake or alcohol consumption. Fifth, we could not analyze psychological stress, emotional states, and other potential confounding variables. However, our study provided important insights into weight gain and associated factors among Koreans.
In conclusion, this study shows that young age is the strongest risk factor for weight gain and that moderate to severe weight gain is more prevalent in young men. Unmarried status, blue-collar job, low income, and alcohol consumption in men and married status in women were significantly associated with weight gain. Smoking status and skipping breakfast were significantly associated with weight gain in both sexes. Public education and health policies to prevent unnecessary weight gain should be strengthened by addressing the associated factors in Korean adults.
 XML Download