

 PDF
PDF Citation
 Print
Print


INTRODUCTION
Perception of musical emotion is one of the main perceptual issues in persons with hearing loss. The nature of the perception of musical emotion remains obscure, however, since little is known about the fundamentals of musical perception in hearing-impaired people. Researchers have attempted to determine the perceptual foundations of musical emotion in clinical populations for decades.123456 For example, pitch perception in older adults with hearing loss is strongly correlated with discrimination in prosodic emotion, regardless of the type of hearing loss.7 In individuals with cochlear implants (CIs), tempo cues have been used to discriminate between happy and sad music rather than mode cues.3 In these studies, the applied stimuli were tones or excerpts from classical music to focus on the relationship between acoustical features such as the pitches of tones, tempo, and mode and the perception of musical emotion. The consideration of frequency range for musical stimuli is crucial for auditory information in hearing-impaired people; however, many studies have used existing melodies without considering the frequency range.
Episodic memory is one of the key processes in music-evoked emotions rather than in the perception of musical emotion.8 In individuals with hearing-impairment, excerpts from familiar music may bias emotional perception based on memory of the specific melody. As long as most adults’ hearing loss is not congenital, they may have experience listening to music from movies, television commercials, and famous singers in their daily lives.9 Nonetheless, most studies (75%) investigating musical emotions have used excerpts of commercially recorded music as stimuli according to Eerola and Vuoskoski’s review,10 even in studies on people with hearing loss.346
Although a number of studies have contributed to the increasing knowledge of musical emotions using excerpts from familiar music,111213 the limitations of the existing stimuli have led few groups to develop a set of musical stimuli for research on emotions to fully understand musical emotions.1415 However, there are still limitations to exploring the perception of musical emotions in people with hearing loss as mentioned above.
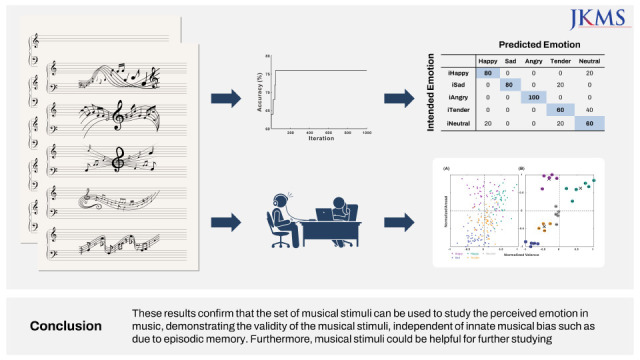
In this study, we developed new musical stimuli to control the pitch of the melody and avoid biasing the participants with hearing loss, as may have occurred previously. We selected four categories of emotions, including happy, sad, angry, and tender, and no emotion as neutral, with these distributed in terms of valence and arousal. These emotions were chosen based on the two representative models for emotion classification, discrete and dimensional models. The former suggests that emotions can be expressed in terms of a limited number of descriptors, such as happiness, anger, sadness, disgust, surprise, and fear,16 whereas the latter describes all emotions in two dimensions (arousal and valence).17 Once the musical stimuli were developed, the expression of the intended emotion for each stimulus was evaluated in two ways: 1) the classification of intended musical emotion with musical features and 2) the perception of emotion in musical stimuli by an online survey in individuals with normal hearing. We hypothesized that the developed stimuli expressed the intended emotions as classified by the models. In addition, the musical stimuli represented musical emotions in people with various types of hearing loss. Furthermore, listeners with high-frequency hearing loss participated testing the applicability of the musical stimuli to study the effect of hearing loss on the perceived emotions of music in future studies.
METHODS
Stimuli
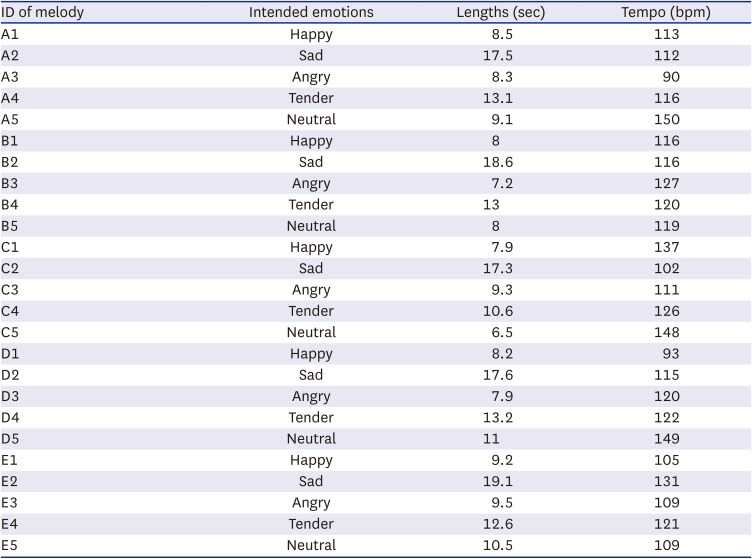
Five melodies in a monophonic piece were constructed by a professional musician as the music stimuli (Fig. 1, Table 1). The pitches of the melodies were evenly distributed around 1 kHz and are intended to express five target emotions: happy, sad, angry, tender, and neutral. All of these emotions, except neutral, were selected according to the folksonomy representation by clustering social data.18 The musician was asked to maintain the pitches in the piece and was otherwise free to vary the musical features such as tempo, dynamics, and articulation to express the intended emotion. Five melodies expressing the 5 intended emotions were recorded using a Yamaha S90ES synthesizer (Yamaha, Japan).
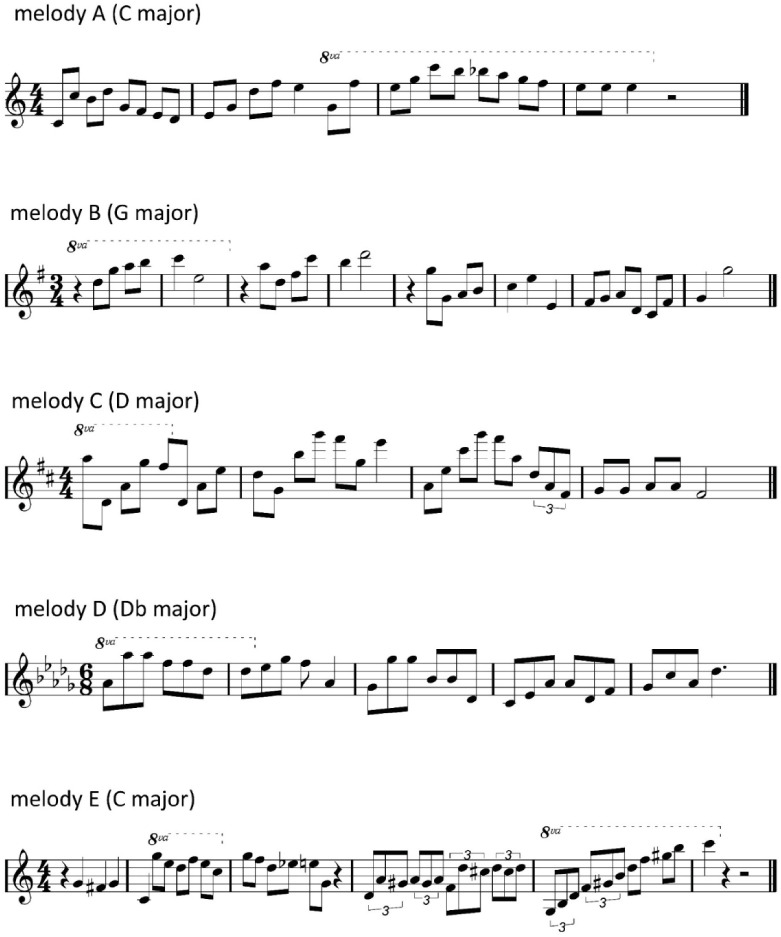
Table 1
Stimuli properties of the melodies employed in the current study
Evaluation method 1: Musical features
Musical feature extraction
MIRtoolbox was employed to extract features from each musical stimulus.19 A total of 60 features were extracted from six types of measures: full length, dynamics, rhythm, spectral, pitch, and harmony using the frame-based approach.20 The length of each frame was 46 ms, with 50% overlap for most of the features. Features including low-energy ratio, fluctuation, tone-related features, tempo, and pulse clarity, which require longer frame length, were extracted with 2 seconds frames and 50% overlap (Table 2). The entire length of each musical stimulus was the first feature (F1). The dynamic features included the means and standard deviations of the RMS energy, low-energy ratio, attack time, attack slope, decay time, decay leap, and decay slope (F2–F14), whereas the rhythm features were event density, fluctuation strength, tempo, and pulse clarity (F15–F22). Brightness, centroid, zero-cross, roll-off, spread, skewness, kurtosis, and flatness (F23–F38) were constructed from the spectral features. The means and standard deviations of the first 7 Mel-frequency cepstral coefficients (MFCCs) with or without delta were also included in the timbre features (F39–F52). The pitch features included the mean and standard deviation of pitch and chromagram (F53–F56) while the final harmony features contained those of mode and entropy (F57–F60).
Table 2
The extracted feature set
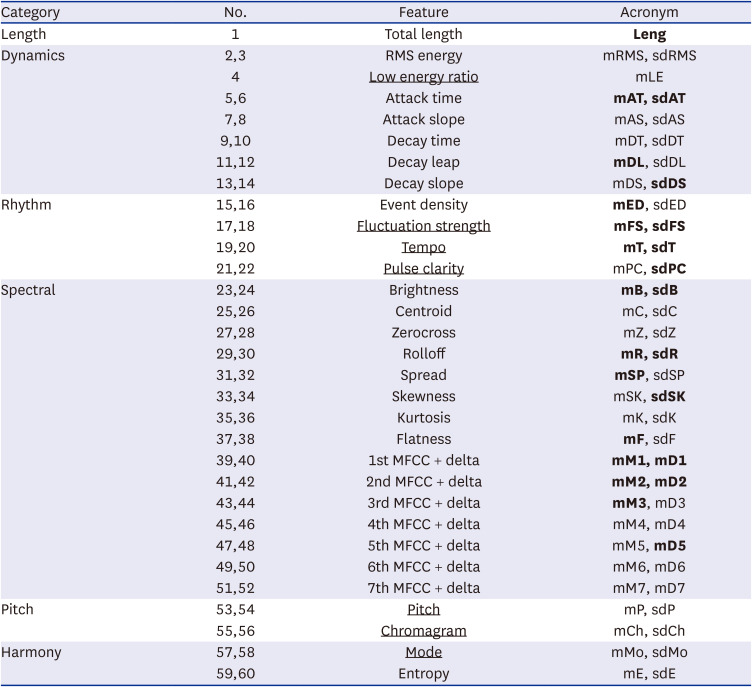
Bold characters in the acronym represent features selected by a genetic algorithm method. Characters with the underbar in the feature column mean that extracted with a 2 seconds frame and 50% overlapping. Note that ‘m’ and ‘sd’ in the acronym indicate the mean and standard deviation, respectively.
MFCC = Mel-frequency cepstral coefficient.
Musical feature selection and classification
A genetic algorithm (GA)-based feature selection method was applied to increase the efficiency of standard classifiers and find the optimal features from a set of given features, which is guided by the principles of evolution and natural genetics.21 We used a MATLAB-based toolbox to adopt the GA method.22
A GA method began with a set of ten initial chromosomes, called a population. Each chromosome consisted of a randomized number of musical features. Each chromosome was assessed with the k-nearest neighbor (KNN) as a fitness function and a classifier for fitness values. We adopted the leave-one-out cross-validation technique to evaluate the classification accuracy. In each generation, two chromosomes were selected based on the best two fitness values as the parents and reproduced the next generation with the following procedures: 1) crossover with 60% probability to combine two parents, 2) mutation with 5% probability to change randomly to the individual parent to choose the next generation.23 The above process was iterated 1,000 times with an evolved population that consisted of two parents and the remaining chromosomes.
Evaluation method 2: Behavioral experiment
Participants
Forty-four native Korean speakers with normal hearing (NH; 22 females and 22 males) aged 19–36 years (mean age 24.9 ± 4.3 years) participated in the evaluation procedure of musical stimuli. The NH group participants had normal pure-tone average thresholds (lower than 25 dB) in both ears and no neurological or cognitive issues. They were recruited through social network platforms and help-wanted advertisement sites. In addition to the NH subjects, 4 individuals with high-frequency hearing loss (HFHL; 3 females and 1 male) participated in the evaluation procedure to test the applicability of the stimuli. The pure tone audiogram of the HFHL participants showed a slope to the right, with averaged thresholds of 72.5 dB at 4 and 8 kHz (Supplementary Table 1). The average 4-tone (0.5, 1, 2, and 3 skHz) pure-tone audiometry thresholds of the HFHL participants were equal to or higher than 25 dB HL, and the types of hearing loss were symmetrical (interaural difference ≤ 20 dB). All participants reported no emotional or anxiety disorders and no neuropsychiatric medication during the last six months.
Procedure
The evaluation procedure for the musical stimuli was administered by an online survey which was developed with the online questionnaire tool (ko.surveymonkey.com).
For the procedure, a total of 125 stimuli (25 auditory stimuli × 5 repetitions) were created. During the survey, three kinds of questions based on the dimensional and discrete models were used for each stimulus, and they were randomly presented. Two out of each three questions (dimensional questions) were evaluated based on a 9-point Likert scale to rate the levels of arousal (1 = very calm and 9 = very excited) and valence of the perceived emotion (1 = negative and 9 = positive). To clarify the scales, we added a self-assessment manikin as a picture-oriented instrument.24 Last, in the third question, the participants were asked to select one of the expressed emotions among five choices: happy, sad, angry, tender, and neutral. For the third question, the participants earned a point for a correct answer only if the answer coincided with the emotion expressed by the melody, and they were informed whether they could receive a reward after finishing the survey. The participants were also informed that they could earn additional financial rewards when they received scores higher than 70 points to help them maintain their attention during the survey. There were no time constraints on the responses. The participants completed the survey individually in a quiet environment.
k-means clustering analysis
k-means clustering analysis was conducted to classify the participants’ responses to the perceived musical emotions based on the two dimensions of arousal and valence. The individual 25 objects (stimuli) were averaged across the arousal and valence ratings of all participants. Then, the average rated arousal and valence values were normalized by a scale ranging between −1 and 1. The average value for each cluster was computed, and all objects were allocated to the closest cluster. The distance between the object and each cluster was calculated using the squared Euclidean distance with the number of clusters (k) as 5. This clustering was replicated 10 times to return the solution with the lowest total sum of distances among all the replicates. The process was performed using the function “kmeans” in MATLAB 2018b (The MathWorks Inc., Natick, MA, USA).
Statistical analysis
A two-way repeated-measures analysis of variance (rANOVA) was used to assess the effect of the choice of emotions and types of melodies on both the categorical selection and dimensional ratings of the participants. This analysis was performed using the functions “fitrm” and “ranova” in MATLAB. Post hoc testing was conducted using Tukey’s honestly significant difference tests, and a P value < 0.05 was used as the cutoff for statistically significant differences. To examine group differences using a discrete approach, the percent of correct choices of the intended emotion was calculated for each emotion and compared between groups. The Mann-Whitney U test was applied to account for unequal group sizes. All data are expressed as the mean ± standard error unless otherwise stated.
RESULTS
Evaluation method 1: Musical features
Feature selection was performed to choose a proper subset of the original feature set and find the maximal prediction accuracy25 using the machine learning technique and genetic algorithm. Fig. 2 shows the accuracy against the number of iterations. Twenty-four of the 60 features were selected as the best solutions for their 76% accuracy. The selected features included Length, mAttacktime, sdAttacktime, mDecayleap, sdDecayslope, mEventdensity, mFluctuation, sdFluctuation, mTempo, sdTempo, sdPulseclarity, mBrightness, sdBrightness, mRolloff, sdRolloff, mSpread, sdSkewness, mFlatness, mMFCC1, mMFCC1d, mMFCC2, mMFCC2d, mMFCC3, and mMFCC5d (bold characters of acronym in Table 2).
Fig. 2
Genetic algorithm evolution. The accuracy is defined by the maximum fitness of each iteration. The genetic algorithm was repeated 1,000 times to obtain the best accuracy.

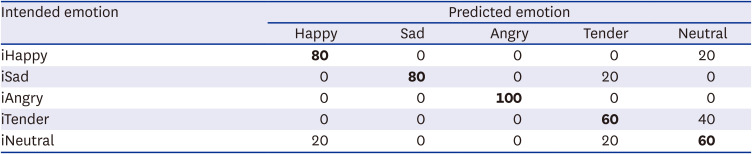
The results for KNN classification after feature selection are shown in Table 3. Note that we added ‘i’ in front of the intended emotions, as in iHappy, to distinguish them from the emotions predicted by classification or the emotions selected by the participants. iAngry was predicted only as angry, while iHappy and iSad were recognized as happy and sad, respectively, with 80% accuracy. iTender was confused with neutral (40%), and iNeutral was confused with happy and tender (20%).
Evaluation method 2: Behavioral experiment
Dimensional approach
We examined the rating scales for consistency with the stimuli as the unit of measurement to justify averaging the subjective ratings over the participants. The arousal and valence ratings proved to be interindividual consistent (Cronbach’s α: arousal = 0.97, valence = 0.91) based on the widely used criterion threshold of 0.70.26 Since each auditory stimulus was presented five times during the survey, averaging across the participants’ ratings, including five trials per auditory stimulus, is justified.
Fig. 3A shows the averaged ratings of arousal and valence by each participant. The rated arousal and valence were normalized in the range of −1 to 1 since the arousal ratings exhibited more extensive ranges than the valence ratings (1.7–6.4; arousal, 4.1–7.3; valence).
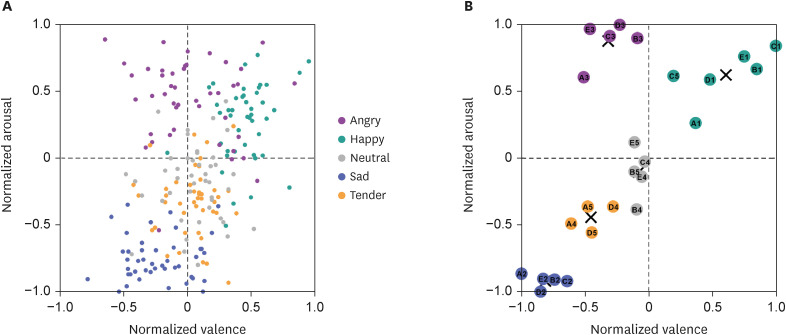
Fig. 3
Arousal and valence ratings. (A) The subject ratings of intended emotions on the normalized arousal and valence dimensions. Each dot represents the individual subject’s mean ratings of each intended emotion for all melodies with five repeated trials. Five colors indicate five intended emotions: green – happy, purple – angry, blue – sad, yellow – tender, and gray – neutral. (B) k-means clustering analysis of normalized arousal and valence ratings. The stimuli were classified into five clusters. Each dot represents an individual stimulus. The X of each cluster indicates the centroid location. Each color denotes the same emotion as those of (A).
Next, we examined whether the intended emotions were clearly distinguished according to the normalized ratings of arousal and valence. An rANOVA was performed to determine the main effect of musical stimuli and the intended emotions for each normalized rating of arousal and valence. The rANOVA results showed significant interaction effects between type of melodies and intended emotions for the rated arousal (F [16,688] = 25.26; P < 0.001; partial η2 = 0.37). We performed post hoc comparisons to determine which components were significantly different from others. The arousal ratings between all pairs of intended emotions were significantly distinguished from each other in melody D, whereas the ratings between iNeutral and iTender were not significantly different in melody A. No differences in arousal ratings between iAngry and iHappy were shown among melodies B, C, and E.
For the rated valence, rANOVA showed significant interaction effects between types of melodies and types of emotions (F [16,688] = 3.77; P < 0.001; partial η2 = 0.08). Post-hoc tests revealed that most valence ratings were significantly different from those of other intended emotions, with several exceptions. The valence ratings of iAngry were not distinguishable from those of the other intended emotions except for iHappy. More specifically, the valence ratings of iAngry were not significantly different from those of iSad in melodies C and E. The valence of iAngry was also not distinguishable from that of iTender in all melodies. For iNeutral, a post hoc test revealed that the valence ratings were significantly different from those for iAngry in only melody C (P = 0.019). In addition, the valence ratings of iNeutral were not different from those of iTender for any melodies.
In Russell’s circumplex dimensional model, each quadrant on the arousal and valence plane corresponds to basic emotions, including happy, sad, angry, and tender. Additionally, neutral was added by Ekman27 in the discrete model. To determine whether the ratings of arousal and valence were placed in the representative of the quadrants of interest, we conducted a k-means clustering analysis (Fig. 3B). The melodies were classified into five clusters. The clustering accuracy for the arousal and valence scales corresponded to our classification of musical features with 76% accuracy. All melodies expressing happy, angry, and sad were in the first, second and, third quadrants, respectively. However, melodies that were intended to be tender and neutral were indistinguishable.
Discrete approach
The selected perceived emotions of the musical stimuli in the NH and HFHL groups are shown in Fig 4A. The percent corrects for each emotion in the NH group were 77.6 ± 2.4% for happy, 48.8 ± 3.4% for sad, 38.6 ± 4.6% for angry, 43.2 ± 3.1% for tender, and 54.5 ± 3.9% for neutral. To examine the perceptual effects of HFHL on the musical emotion for those stimuli, the percent correct on the perceived emotion for the musical stimuli were obtained in 4 subjects with HFHL (Fig. 4A). The rANOVA results showed no significant differences between the NH and HFHL groups. However, the overall percent correct of the intended emotions in the NH group tended to be higher than that in the HFHL group, except for iTender and the percent correct averaged across all intended emotions (Fig. 4B).
Fig. 4
The percent correct for intended emotions in the discrete approach. (A) The bar graphs show the average percent correct of each chosen intended emotion in all participants, including the NH group and the HFHL group. The error bars of the NH group indicate the standard error of the mean, and the pentagon shapes represent individuals with HFHL. (B) The sorted percent correct for the NH group (open circles) and HFHL groups (filled pentagon shapes) averaged over all intended emotions.
NH = normal hearing, HFHL = high-frequency hearing loss.

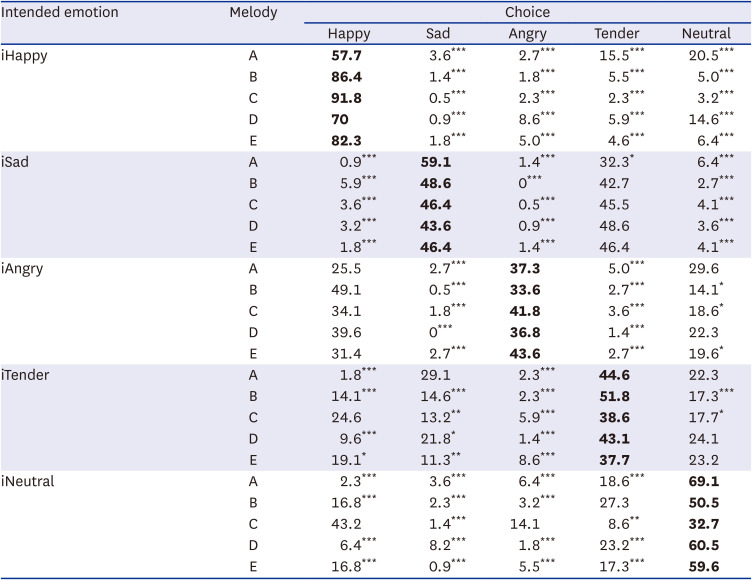
Table 4 shows the percentage of choice for the intended emotions as a function of stimulus type. An rANOVA was performed to examine the main effect of melody type and the choice of emotions on each intended emotion. For all intended emotions, the interaction between type of musical stimuli and choice of emotions was significantly different (iHappy: F [16,688] = 10.71, P < 0.001; iSad: F [16,688] = 2.88, P < 0.001; iAngry: F [16,688] = 4.20, P < 0.001; iTender: F [16,688] = 4.77, P < 0.001; and iNeutral: F [16,688] = 16.16, P < 0.001). Post-hoc tests revealed that the intended emotions were chosen significantly more often than the other emotions for each type of musical stimulus. Specifically, iHappy was selected more often than other emotions for all types of stimuli (P < 0.001 in all), and iSad was also selected more often than other emotions for all stimuli except for tender (A only; P < 0.05). In addition, iAngry was selected significantly more often than sad and tender for all types of stimuli (P < 0.001). However, there were no significant differences for all stimuli with iHappy. There were also no significant differences compared to iNeutral for stimuli A and D. iTender was selected significantly more often than angry, happy (except for C), and sad (except for A), but was confused with neutral in stimuli A, D, and E. iNeutral was chosen significantly more often than other emotions for most stimuli (except for C with happy and angry and for B with tender).
Table 4
The percentage of chosen intended emotion in each melody
DISCUSSION
This study aimed to develop new musical stimuli and to evaluate whether these stimuli accurately express the intended emotions. The properties of the developed melodies were evaluated using musical features for emotional classification and self-reports of the perceived emotions to stimuli, to support their validity and reliability. Twenty-four of the 60 acoustic features were selected by a GA method from the musical stimuli, which were used to classify emotions by a KNN method with 76% accuracy. The k-means clustering analysis with arousal and valence ratings revealed that the musical stimuli were classified into quadrants of interest in the plane of the dimensional model. In addition, the NH subjects selected the expressed emotions the most in the categorical choice. The stimuli were also applicable in the participants with HFHL since they also perceived the intended emotions of the musical stimuli, although the percent correct was lower than that of the NH subjects.
This study developed new musical stimuli based on two considerations: the pitches of the melodies and musical timbre. Pitch perception in hearing-impaired listeners is strongly related to emotional recognition.7 Thus, musical stimuli were developed with evenly distributed pitches around 1 kHz for future studies with various types of HL.
A previous report showed that infants can differentiate and memorize various types of timbre even for stimuli they have never heard before.28 A close relationship between timbre and emotion is further evident in a neurophysiological study that suggests significant correlations between the intended emotions and timbral differences.29 Pitch and timbre were considered the main features of music in our study.
A digital piano was chosen based on these two considerations. It covers the full range of pitch, even over 2 kHz, and is emotionally neutral. It has also been suggested that the timbral features of pianos are emotionally neutral which indicates the minimal effect on the judgment of musical emotion.30 Furthermore, using only one instrument may implicate no bias to the auditory memory incurred by timbre.
Over the past decade, studies on the perceived emotions of music have demonstrated that a computational perspective can explain musical emotions.31 The main goal of the computational approach is to explore the relationships between emotions and acoustic features extracted from music. To this end, research groups have attempted to predict emotional categories using machine learning techniques such as KNN.32 The KNN with feature selection precludes redundant and irrelevant features, thereby vastly improving classification performance.32 In our study, the classification accuracy with KNN was enhanced using GA (76%; Fig. 2) compared to classification without feature selection (56%, data not shown).
The result of the classification of the selected musical features indicates that iAngry, iHappy, and iSad were mostly recognized as intended (Table 3). However, iTender was confused with neutral, and iNeutral was frequently selected as tender and happy. Previous meta-analysis results revealed similar decoded accuracy patterns, where anger and sadness were decoded with the highest accuracy, followed by fear and happiness, and tenderness had the lowest accuracy.33 Considering that the meta-analysis results are in line with our classification data, we infer that the musical stimuli used in this study have similar patterns of acoustic features.
For the rANOVA results of both arousal and valence ratings, most intended emotions were significantly distinguished from other emotions in all melodies. The arousal ratings for iAngry were not significantly different from those for iHappy, whereas the valence ratings for iAngry were significantly different from those for only iHappy. Regardless of the nonsignificant differences in iAngry from others, the k-means clustering analysis depicted that the melodies expressing angry separated from those expressing other emotions (Fig. 3B). This classification between iAngry and other emotions was due to contrast arousal and valence levels.
The participants could not discriminate between iTender and iNeutral in melody A in terms of arousal ratings but did differentiate iTender from iNeutral in terms of the valence ratings for all melodies. The k-means clustering analysis also showed that melodies expressing tender and neutral were indistinguishable from each other (Fig. 3B). iTender might be confused with neutral since the two were rated mid-level for both arousal and valence whereas other emotions were rated higher or lower than those.
iSad was exceedingly confused with tender. A previous study that assessed the effect of pitch variation on arousal and valence ratings revealed that pitch level was positively correlated with valence ratings but negatively correlated with arousal ratings.34
In this study, iSad, which has a negative valence, was considered tender. Meanwhile, tender has a positive valence with a similar level of arousal to that of sad, while sad was not selected in response to iTender. Considering that higher pitches were distributed around 1 kHz in our study, these findings lead us to regard the possibility that high pitches might cause biased choices toward positive emotions as mentioned above.
In this study, angry was confused with happy in that the happy was not differentiated from angry in the rating of iAngry for all melodies. Nonetheless, the angry was selected significantly less often than happy in iHappy. Such distinction in selection between iHappy and iAngry would be related to the tendency toward positive valence. Another discrepancy was shown between the result of the discrete approach (cf. Fig. 4, angry) and the classification of iAngry using musical features (cf. Table 3). In terms of musical features, the musician in this study might have created five angry musical stimuli using similar acoustic features. This led to the iAngry stimuli being recognized as angry completely in the emotional classification using acoustic features, while the participants perceived the iAngry stimuli as positive because of their high pitch. Interestingly, iNeutral was mainly perceived as neutral, which was in line with a previous study suggesting that no expression seemed easy to convey.35
The musical stimuli were developed for our main motivation to assess differences between hearing loss and normal-hearing individuals in perceiving the emotions of music. To this end, we performed a pilot study with a small subgroup of HFHL participants, aiming to test whether they perceived musical emotion less than people with NH because of their impairment in specific frequency areas, without musical bias such as episodic memory. The average percentage at which the intended was chosen emotion was lower in the HFHL group than in the NH group (Fig. 4A). Therefore, the average percent correct across all emotions was lower in HFHL group than in the NH group (Fig. 4B). Considering the small size of the HFHL group, the group comparisons in this study are difficult to generalize. Nevertheless, the tendency of the results was similar to those of previous study regarding the perception of musical emotion in hearing-impaired children.36 In addition, all of the individuals with HFHL participated in the test without claiming any difficulty until the end.
Taken together, our data suggest that the newly developed musical stimuli have the potential to be applicable for future studies regarding the perception of musical emotions in people with hearing loss.
In conclusion, novel musical melodies were developed and evaluated for their accessibility as ecologically valid stimuli to investigate the behavioral and neural processing of perceived musical emotion. The findings indicate that the intended emotion can be delivered by listening to the stimuli, yet some variability exists among the listener responses. With only a few subjects with hearing loss being recruited, we showed that these musical stimuli were able to reflect the intended emotions in this clinical population, revealing their suitability for use in future studies. This work provides an example for developing musical stimuli for researchers who study musical emotional perception in hearing-impaired people.
 XML Download