

 PDF
PDF Citation
 Print
Print


INTRODUCTION
Atomic bombs were dropped on Hiroshima and Nagasaki, Japan, on August 6 and 9, 1945, respectively.1 It has been estimated that approximately 440,000 people in Hiroshima and 271,500 in Nagasaki had atomic bomb exposure, of whom 300,000 died in that year.1 Of these 230,000 people, nearly 50,000 Koreans in Hiroshima and 20,000 Koreans in Nagasaki are estimated to be dead, and approximately 40,000 people died shortly after being exposed to the atomic bomb explosion.1 After the Korean liberation in 1945, a total of 23,000 people were estimated to have returned to Korea.1 However, the estimated number is not accurate owing to limited investigation and information.2 The Korean atomic bomb survivors had not received attention until the Japanese government tracked Korean atomic bomb survivors in the early 1990s, and only those atomic bomb survivors who had survived until the 1990s were identified. According to the Special Act on Korean Atomic Bomb Survivors implemented in 2017,3 as of July 2021, 2,040 atomic bomb victims were still alive, and the average age was 81.6 years,4 suggesting that most of the atomic bomb survivors had already died.
In Japan, to investigate the health effects of atomic bomb radiation, cohorts of atomic bomb survivors, in utero survivors, and offspring of survivors have been constructed and observed through follow-ups since 1950. The results revealed an increased risk of the incidence of or mortality due to thyroid diseases, chronic liver diseases, liver cirrhosis, uterine myoma, and cataract, with a linear dose-response relationship between the exposed radiation dose and disease risk.5 In addition, the risks of heart diseases; stroke; digestive diseases; respiratory diseases; cancers including stomach cancer, colon cancer, lung cancer, breast cancer, ovarian cancer, bladder cancer, and thyroid cancer; and death were increased in atomic bomb survivors.67 Mortality due to gastric, lung, liver, colon, breast, gallbladder, bladder, ovarian, and esophageal cancers was also increased.8
Atomic bomb radiation exposure is associated with non-specific inflammatory reactions that cause genome instability9 or chronic inflammation through the disruption of T-cell immunity.10 In a cohort study of nuclear workers in France, the United Kingdom, and the United States, low-dose radiation exposure was associated with increased mortality due to heart diseases and cerebrovascular diseases11 and increased risk of cancer.12
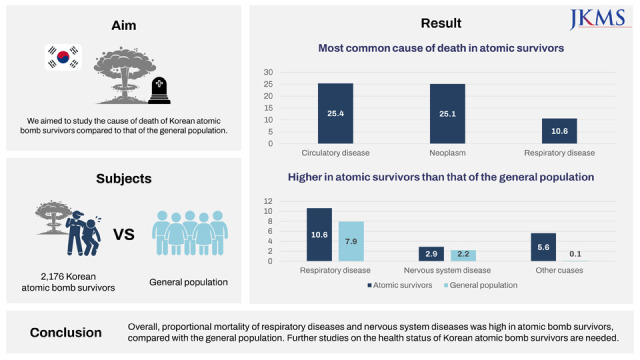
Only a few studies of atomic bomb survivors have been conducted in Korea. The medical usage for atomic bomb survivors was 1.4–5 times higher than that of the general population of the same age group, and approximately 67% of atomic bomb survivors reported long-term health problems.13 The prevalence of rare diseases, hypertension, chronic liver disease, and hyperlipidemia is higher in atomic bomb survivors in Korea than in the general population.214 However, studies on atomic bomb survivors in Korea have been limited to small sample sizes and focus over a specific region. This study therefore aimed to investigate the causes of death among atomic bomb survivors in Korea based on the total records registered in the Korean Red Cross and compare the causes of death in the general population using proportional mortality.
METHODS
Study population
Since 1990, Japan has entrusted medical support for atomic bomb survivors to the Korean Red Cross, and atomic bomb survivors have been registered to receive support. Atomic bomb survivors in Korea who registered at the Korean Red Cross are classified into three groups: individuals with proof of being an atomic bomb survivor issued by the Japanese government, individuals with proof of being an atomic bomb survivor in Hiroshima or Nagasaki on the date of atomic bomb explosion, and individuals with proof of being an atomic bomb survivor verified by the Korea Atomic Bomb Casualty Association.2
Since 1992, atomic bomb survivors have been registered in the Korean Red Cross. The total number of registered atomic bomb survivors from 1992 to 2019 was 4,472 and the number of deaths was also recorded annually. In 2019, the number of registered alive individuals was 2,173. A total of 2,299 deaths of atomic bomb survivors have been reported and the year of death ranged from 1901 to 2020. Because the registration of atomic bomb survivors by the Korean Red Cross started in 1992, we did not consider 51 deaths before 1992 because of possibly inaccurate information. In addition, because the most recently available death registration data at the time of analysis was up to 2019, we further excluded the 72 deaths in 2020 and later.
A total of 2,176 deaths were linked to the Causes of Death Statistics of Statistics Korea, and the causes of death were linked for 2,054 deaths using the resident registration number. Information on the situation of the atomic bomb explosion (distance from the hypocenter, location of exposure) and age at death was extracted from the Korean Red Cross. Only information on deaths was provided; thus, the requirement for written informed consent of the study subjects was waived. All personal identifiable information data were deleted after linking the Korean Red Cross data to Statistics Korea data. Mortality data, including the cause and date of death, were obtained by linking the National Health Insurance Service and National Health Insurance Database with the nationwide Death Registration Database provided by the Korea National Statistical Office. From 1992 to 2019, a total of 6,377,781 deaths were reported in the general population.
Variables
In our data, information on age at death, distance from the hypocenter (from the Korean Red Cross), date of death, and cause of death (by linkage to the Causes of Death Statistics of Statistics Korea) was available. Age at death for atomic bomb survivors and the general population was categorized as 45–64, 65–69, 70–74, 75–79, and ≥ 80 years. Distance from the hypocenter was categorized as 0–1 km, 2–3 km, 3–4 km, and ≥ 4 km. Causes of death were classified according to the Korean Standard Classification of Diseases, version 8). Because there were no deaths caused by congenital malformations, deformations and chromosomal abnormalities (Q00–Q99); diseases of the eye and adnexa (H00–H57); diseases of the ear and mastoid process (H60–H93); pregnancy, childbirth, and puerperium (O00–O99); and certain conditions originating in the perinatal period (P00–P96) among atomic bomb survivors, these diseases were excluded from the analysis.
Statistical analysis
Proportional mortality refers to the proportion of deaths attributable to different causes in a specific population over time. Proportional mortality was calculated as the observed number of deaths due to certain causes over the total number of deaths in the same population.15 If d be the death count in the study population and i be a specific disease, the proportional mortality is calculated using the following equation16:
Proportional mortality among atomic bomb survivors and the general population was then compared. Considering the different distribution of age at death of atomic bomb survivors compared with the general population and changes in cause of death during the study period, the proportional mortality in atomic bomb survivors and the general population was further compared according to age at death (45–64, 65–69, 70–74, 75–79, and ≥ 80 years) and year of death (1992–1999, 2000–2009, 2010–2019). In addition, in atomic bomb survivors, proportional mortality according to the distance from the hypocenter was compared and we performed the χ2 test and the Cochran-Armitage trend test to identify the trends in differences in proportional mortality according to the distance from the hypocenter. Statistical analyses were performed using SAS software (version 9.4; SAS Institute Inc., Cary, NC, USA) and two-sided tests, and a significance level of P < 0.05 was used.
RESULTS
Table 1 shows the age at death and the distance from the hypocenter for atomic bomb survivors who died during 1992–2019. The mean age of the atomic bomb survivor at the time of death was 78.8 years. Age at death, the minimum age was 49 and the maximum age was 118. Among a total of 2,176 deaths, proportional mortality for age at death of ≥ 80 years was the highest (1,078, 49.5%), followed by those for 75–79 years (448, 20.6%), 70–74 years (333, 15.3%), 45–64 years (164, 7.5%), and 65–69 years (153, 7.0%). Data of approximately half of the deaths among atomic bomb survivors and distance from the hypocenter were not available (1,101, 50.6%). A distance of 2–3 km from the hypocenter was observed in 648 cases (29.8%), that of 0–1 km was seen in 324 cases (14.9%), and that of ≥ 4 km was seen in 103 cases (4.7%).
Table 1
Baseline characteristics of death among atomic bomb survivors (1992–2019)
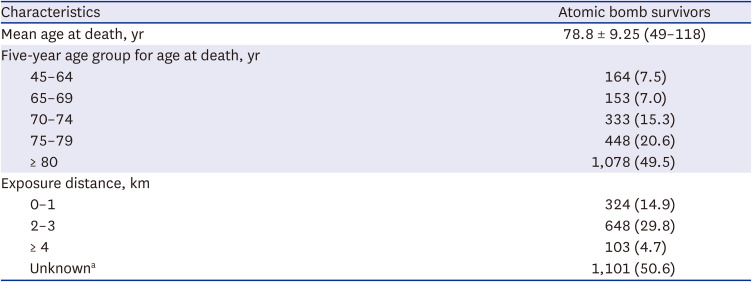
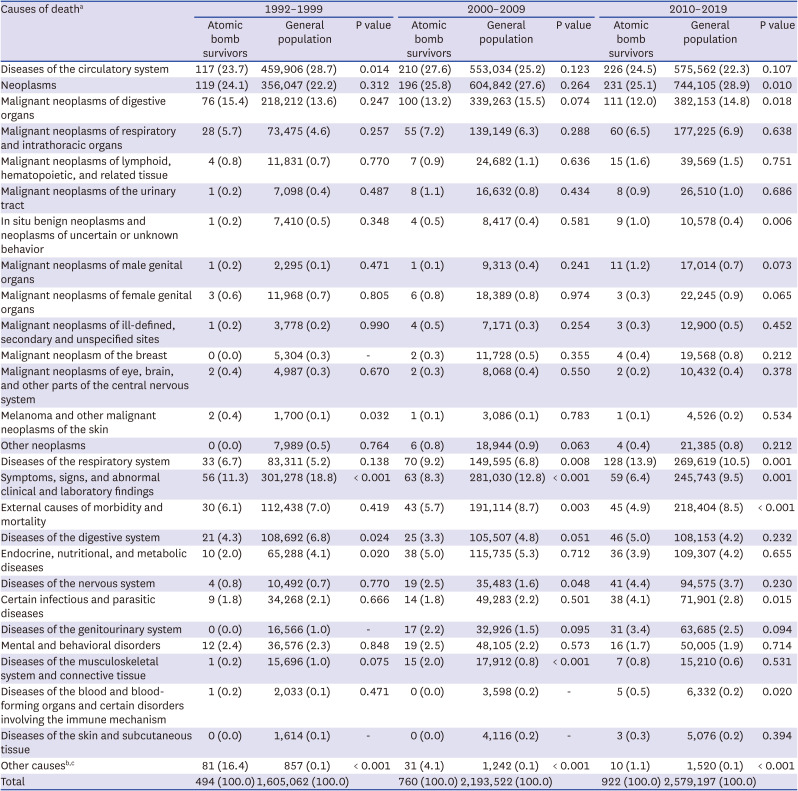
Table 2 shows the proportion of each cause of death among atomic bomb survivors. Diseases of the circulatory system were the most common cause of death (553 cases, 25.4%), followed by neoplasms (546 cases, 25.1%) and diseases of the respiratory system (231 cases, 10.6%). Among neoplasms, malignant neoplasms of the digestive organs were the most common cause of death (287 cases, 13.2%), followed by malignant neoplasms of the respiratory and intrathoracic organs (143 cases, 6.6%). Compared with the general population, proportional mortality was significantly higher for diseases of the respiratory system (10.6%, P < 0.001), diseases of the nervous system (2.9%, P = 0.018), and diseases due to other causes (5.6%, P < 0.001) in atomic bomb survivors. Proportional mortality due to malignant neoplasms of digestive organs (14.7%, P = 0.047); symptoms, signs, and abnormal clinical and laboratory findings (13.0%, P < 0.001); and external causes of morbidity and mortality (8.2%, P < 0.001) were significantly higher in the general population than in atomic bomb survivors. No significant differences were found for other causes of death (Table 2). When proportional mortality was analyzed by dividing by the three time periods (1992–1999, 2000–2009, 2010–2019), deaths due to respiratory system diseases were high in both 2000–2009 and 2010–2019 (Appendix 1).
Table 2
Proportional mortality among atomic bomb survivors and the general population
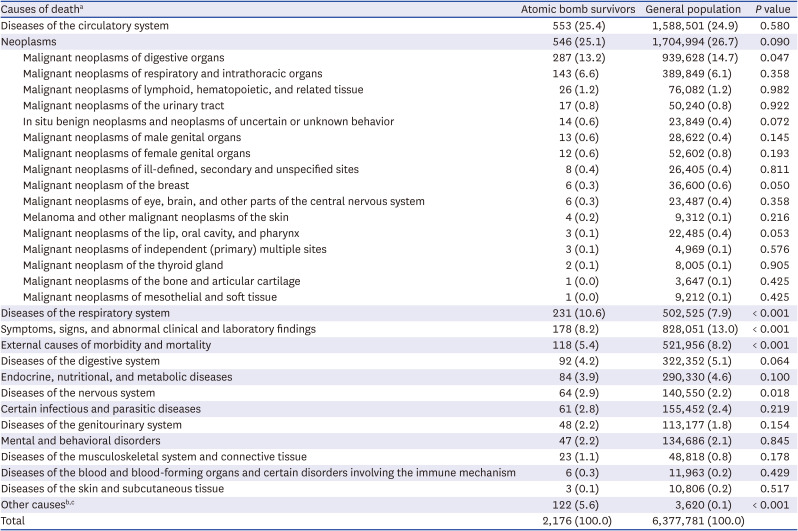
Values are presented as number (%).
aCauses of death were classified according to the Korean Standard Classification of Diseases.
bOther causes refer to people whose cause of death is unknown.
cOther causes of death were classified as “Other causes,” which apply to the general population, but not to death among atomic bomb survivors (congenital malformations, deformations and chromosomal abnormalities [Q00–Q99], diseases of the eye and adnexa [H00–H57], diseases of the ear and mastoid process [H60–H93], pregnancy, childbirth, and puerperium [O00–O99], and certain conditions originating in the perinatal period [P00–P96]).
The proportional mortality in atomic bomb survivors and the general population by age group is shown in Table 3. Among the age categories, the proportional mortality due to neoplasms was highest in atomic bomb survivors until the age of 80 years (45–64 years: 42.7%, 65–69 years: 37.3%, 70–74 years: 33.9%, 75–79 years: 28.8%). In the age group 75–79 years, proportional mortality from diseases of blood and blood-forming organs and certain disorders involving the immune mechanism (0.7% vs. 0.2%, P = 0.026) was significantly higher in atomic bomb survivors than in the general population. In the age group ≥ 80 years, proportional mortality from neoplasms (16.4% vs. 14.1%, P = 0.029), diseases of the digestive system (4.1% vs. 2.9%, P = 0.021), diseases of the nervous system (4.5% vs. 3.2%, P = 0.019), and other causes (5.6% vs. 0.0%, P < 0.001) was significantly higher in atomic bomb survivors than in the general population. In the age group 45–64 years, proportional mortality due to symptoms, signs, and abnormal clinical and laboratory findings was significantly higher in the general population than in atomic bomb survivors (atomic bomb survivors, 0.6% vs. general population, 4.1%, P = 0.024).
Table 3
Proportional mortality among atomic bomb survivors and the general population by age group
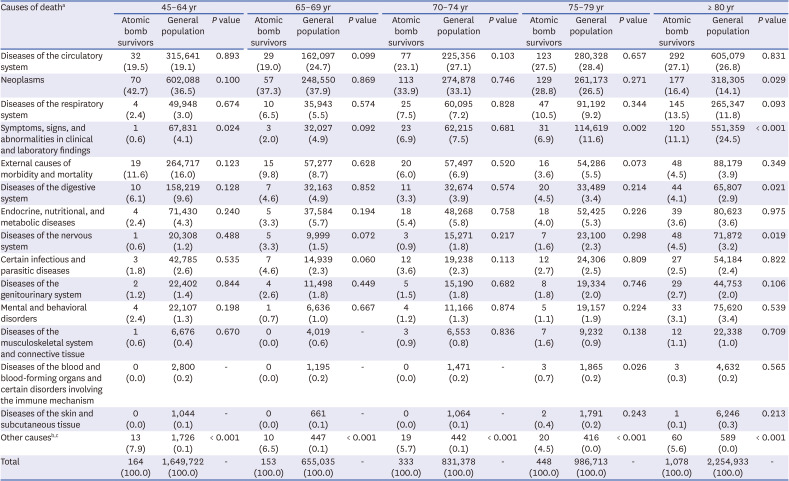
Values are presented as number (%).
aCauses of death were classified according to the Korean Standard Classification of Diseases.
bOther causes of death among atomic bomb survivors include those whose cause of death is unknown.
cOther causes of death were classified as “other causes,” which apply to the general population but not to death among atomic bomb survivors (congenital malformations, deformations, and chromosomal abnormalities [Q00–Q99], diseases of the eye and adnexa [H00–H57], diseases of the ear and mastoid process [H60–H93], pregnancy, childbirth, and puerperium [O00–O99], and certain conditions originating in the perinatal period [P00–P96]).
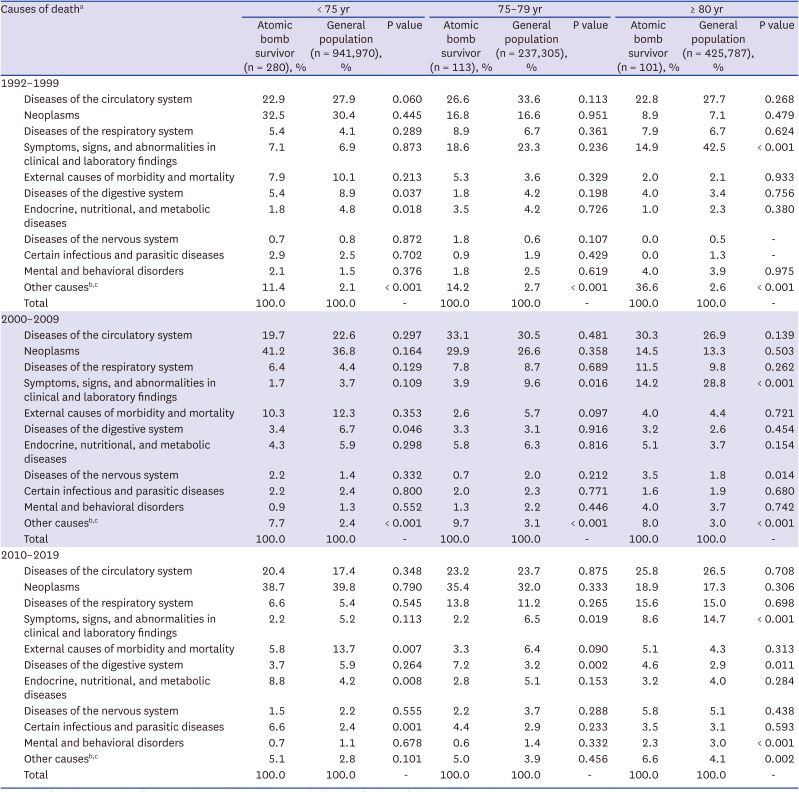
Proportional mortality was compared by age group (< 75, 75–79, ≥ 80 years) at the three different periods (1992–1999, 2000–2009, 2010–2019) (Appendix 2). In 2000–2009, the number of atomic bomb survivors who died from a nervous system disorder was higher than that of the general population (3.5% vs. 1.8% and P = 0.014). In 2010–2019, proportional mortality from digestive system diseases was high in both the 75–79 years and ≥ 80 years age groups (7.2% vs. 3.2%, P = 0.002; 4.6% vs. 2.9%, P = 0.011, respectively). Proportional mortality according to the distance from the hypocenter is shown in Table 4. The mean age at death of each distance group from the hypocenter was 81.4 years for the 0–1 km group, 80.9 years for the 2–3 km group, 84.8 years for the ≥ 4 km group (Table 4), and 76.2 years for the unknown group (data not shown). The post hoc analysis showed that the order of age at death in people within 0–1 km of the hypocenter was equal to that in people within 2–3 km; However, the age at death in people ≥ 4 km away from the hypocenter was greater than both. There was no significant difference in the proportional mortality across the distance groups for other diseases.
Table 4
Proportional mortality to atomic bomb survivors’ radiation exposure distance from the hypocenter (not including the unknown group)
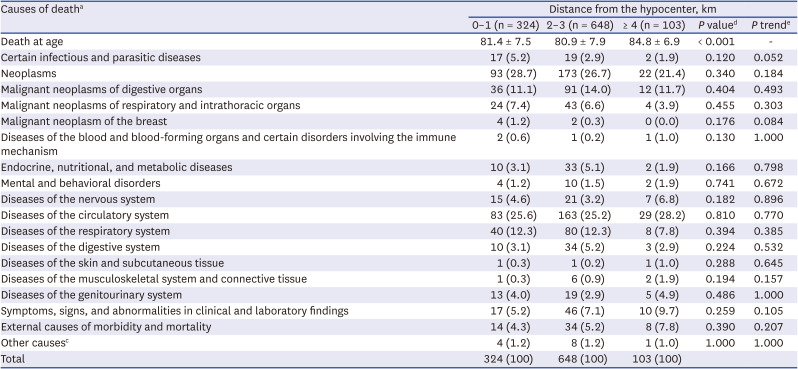
Values are presented as mean ± standard deviation or number (%).
aCauses of death were classified according to the Korean Standard Classification of Diseases.
bAtomic bomb survivors with an unknown exposure distance do not have sufficient information on location for reliable estimation.
cOther causes of death among atomic bomb survivors include people whose cause of death is not known.
dP value was calculated using analysis of variance for continuous variables and using χ2 test for categorical variables.
eP for trend was calculated the Cochran-Armitage trend test for categorical variables.
DISCUSSION
This study compared the proportional mortality between atomic bomb survivors and the general population to determine the main causes of death in atomic bomb survivors and how these causes differed from those in the general population. Among atomic bomb survivors, deaths due to circulatory diseases were the highest, followed by deaths due to cancer and respiratory diseases. In the general population, the causes of death were highest for cancer, circulatory diseases, and symptoms, signs, and abnormal clinical and laboratory findings, demonstrating different orders between atomic bomb survivors and the general population. The proportional mortality rates for cancer, non-cancer diseases, and other diseases in atomic bomb survivors in Korea were 25.1%, 69.3%, and 5.6%, respectively, which were similar to those in atomic bomb survivors in Japan (23.4% for cancer, 71% for non-cancer diseases, and 5% for other causes).8
In previous studies of atomic bomb survivors in Japan, radiation exposure was associated with an increased risk of chronic vascular disease related to hypertension.17 A cohort study of cleanup workers in Baltic Chernobyl showed a higher prevalence of nervous and digestive diseases.18 In a study of atomic bomb survivors in Hapcheon, a city in Korea, the prevalence of hypertension, chronic liver disease, and hypercholesterolemia was significantly higher than that in sex- and age-matched controls from the Korean National Health and Nutrition Survey.14 In this study, the higher proportion of cause of death from neoplasm, digestive diseases, or nervous disease was confirmed only in atomic survivors whose age at death was ≥ 80 years, and not in other age groups. In this study, higher proportional mortality rates for some causes of death were observed in the older age group. Several reasons may explain the differences in proportional mortality rates among the age groups. First, cardiovascular system, cancer, respiratory system, nervous system, and digestive system diseases are the common causes of death in Korean aged ≥ 80 years in general.19 In addition, a study of atomic bomb survivors in Japan found that the risk of cancer begins to increase 10 years after exposure, and the risk of cancer continues to increase with increasing age.20
In Japan, the location and shielding status of atomic bomb survivors were measured in the 1950s, and a dosimetry system was developed in cooperation with the United States. Thus, the exposed radiation dose among atomic bomb survivors was estimated for approximately 92% of the participants in the cohort. Based on the radiation dose estimate with the dosimetry system, it was identified that as the radiation exposure dose increased, the excess relative risk due to diseases related to the circulatory system, respiratory system, and blood significantly increased.8 However, the radiation exposure dose in atomic bomb survivors in Korea has never been estimated. Because atomic bomb survivors in Korea were identified and registered after 1990, many atomic bomb survivors who survived up to 1990 were young in 1945 and had passed more than 45 years since the atomic bomb explosion. Thus, they did not remember the location or shielding status. In this study, data of distances from the hypocenter were not available for more than 50% of the deaths among atomic bomb survivors. Therefore, the differences in the cause of death according to the distance from the hypocenter (surrogate for radiation exposure dose) were limited. In this study, when comparing the proportion of deaths by distance from the hypocenter, statistically significant differences were observed for a few diseases. However, the lower age at death of atomic bomb survivors who were exposed at a close distance from the hypocenter compared with those exposed at a distance would suggest possible health effects of atomic bomb exposure.
Among cancer-related deaths among atomic bomb survivors, the proportion of deaths due to malignant neoplasms of the digestive, respiratory, and intrathoracic organs was the highest. In a cohort study of Japanese atomic bomb survivors, gastric cancer was the most common (29.5%), followed by lung cancer (13.8%). The proportion of cancers in the digestive and respiratory systems was 56.1% and 12.2%, respectively.21 A recent study on the Chernobyl accident found that people living in areas contaminated with radioactive material had a 20% higher incidence of cancer.22 In a study analyzing health insurance claims data of atomic bomb victims in Korea from 2002 to 2017, the prevalence of cancer in most of the atomic bomb survivors was higher than that in the general elderly population.2 Although it is difficult to directly compare the proportional mortality of this study with that of previous studies that focused on disease incidence, it was confirmed that the high burden of digestive and respiratory cancers is commonly observed in atomic bomb survivors exposed to radiation.
The limitations of this study are as follows: first, to analyze the risk of death within the population, it would be more appropriate to compare the mortality rates between the two groups. However, not all atomic bomb survivors in Korea were available, and we could not completely compare the data with those of the general population. The government and the Korean Red Cross have identified atomic bomb survivors since the 1990s, but because of possible social discrimination, some of the atomic bomb survivors in Korea might not have revealed their damage due to atomic bomb exposure and might not have registered as atomic bomb survivors.23 Proportional mortality could be calculated without information on the total population as a denominator, which is affected by the total number of deaths (or mortality rate) of the population, and we could not estimate the risk of death from a specific cause. Second, when calculating proportional mortality, deaths that occurred before 1992 could not be included owing to the lack of data. Because we could not consider the deaths before 1992 and the age of death started from 49 years, there was a discrepancy in the age at death of atomic bomb survivors (age at death was ≥ 49 years) and the general population (age at death is distributed across all ages). Due to this issue, the standardized mortality ratio could not be applied. In addition, selection bias due to the incompleteness of the registry data for Korean atomic bomb survivors could have affected the results. The registered Korean atomic bomb survivors were those who survived for at least ≥ 45 years after the atomic bomb exposure. Thus, atomic bomb survivors who were registered with Korean Red Cross would be those who were less affected by exposure and healthier than overall people who were exposed to the atomic bombs. Considering that 42% of people exposed to the atomic bombs died in that year (300,000 died of 440,000 people in Hiroshima and 271,500 in Nagasaki), this selection bias would exist even in the atomic bomb survivors cohort in Japan which was constructed in the late 1940s.1424 In studies of atomic bomb survivors in Korea, the selection bias may be more pronounced. Despite the selection bias due to the identification of healthy and less affected Korean atomic bomb survivors, previous studies have shown that Korean atomic bomb survivors have more health problems than the general population.21314 Considering that many atomic bomb survivors died immediately after exposure to the atomic bomb,25 the inability to include people who died from the acute effects of the atomic bomb explosion would be a limitation of this study. However, this is a similar limitation to that reported in the atomic bomb cohort study in Japan. Rather, bias with information of the exposure status due to declining memory was a limitation of this study. Third, as described above, the radiation dose exposure among the atomic bomb survivors could not be estimated, and the distance from the hypocenter was available only in < 50% of the subjects; therefore, the dose-response relationship between the exposure dose and causes of death could be accessed only in a limited manner. Fourth, although the risk of cancer from radiation exposure was higher in women than in men,826 and exposure to radiation at an early age is known to cause more susceptibility to disease risk,822 sex, age at the time of exposure, and prenatal exposure were not considered in this study. Fifth, we only considered age and could not consider other important epidemiological risk factors associated with mortality because this was the only available information.
Despite these limitations, this is the first study on atomic bomb survivors in Korea known to identify the proportional mortality of all deaths and compare the data with those of the general population. Most of the studies on atomic bomb survivors have been conducted in Japan, and there have been no studies on the cause of death or long-term health effects of atomic bomb survivors in Korea. More than 90% of atomic bomb survivors are estimated to have died by 2021.4 More studies on the health status of Korean atomic bomb survivors and their offspring are needed.
 XML Download