

 PDF
PDF Citation
 Print
Print


INTRODUCTION
As first described in 1963 by Kare Berg, lipoprotein(a) [Lp(a)] is a low-density lipoprotein (LDL)-like particle that consists of an apolipoprotein B100 molecule covalently linked to a very large glycoprotein known as apolipoprotein(a).1 Epidemiological and Mendelian randomization studies provide support for a causal association between Lp(a) levels and cardiovascular disease.234 Current guidelines recommend the use of Lp(a) to identify patients at high risk of atherosclerotic cardiovascular disease.56 However, the exact mechanisms underlying the increased risk of atherosclerotic cardiovascular disease mediated by Lp(a) remain unclear.7
Patients presenting with acute coronary syndromes (ACSs) are at high risk of recurrent atherosclerotic cardiovascular disease events.8 Lp(a) could be a key component of the residual risk following a prior cardiovascular event that was not treated with statins.910 In the Further Cardiovascular Outcomes Research with PCSK9 Inhibition in Subjects with Elevated Risk (FOURIER) trial, patients with cardiovascular disease (81.1% of whom had a history of myocardial infarction) and Lp(a) levels in the highest quartile were associated with major atherosclerotic cardiovascular events but not with increased cardiovascular mortality.1112 However, the results of recent studies on the predictive value of baseline Lp(a) levels after index ACS events are conflicting.13141516 Furthermore, the associated risk between high Lp(a) levels and acute myocardial infarction (AMI) reportedly varies markedly between ethnic groups.17 Although LDL cholesterol has been proven to be a major causal factor for the development of atherosclerotic cardiovascular disease, the prognostic value of baseline LDL cholesterol after atherosclerotic cardiovascular events is different from what is expected: low baseline LDL cholesterol is associated with worse clinical outcomes.181920 Herein, we aimed to evaluate the prognostic impact of the baseline Lp(a) levels on 3-year cardiovascular outcomes in patients with AMI, using a large, single-center cohort in Korea
METHODS
Study design and population
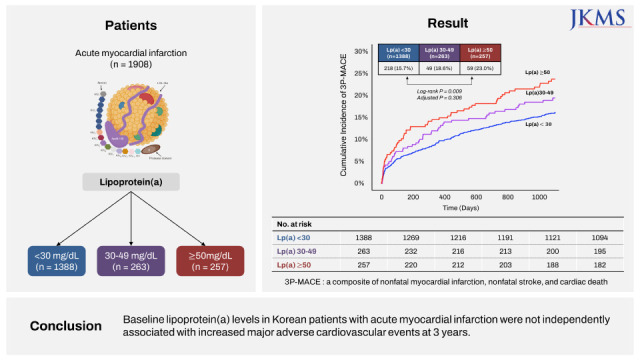
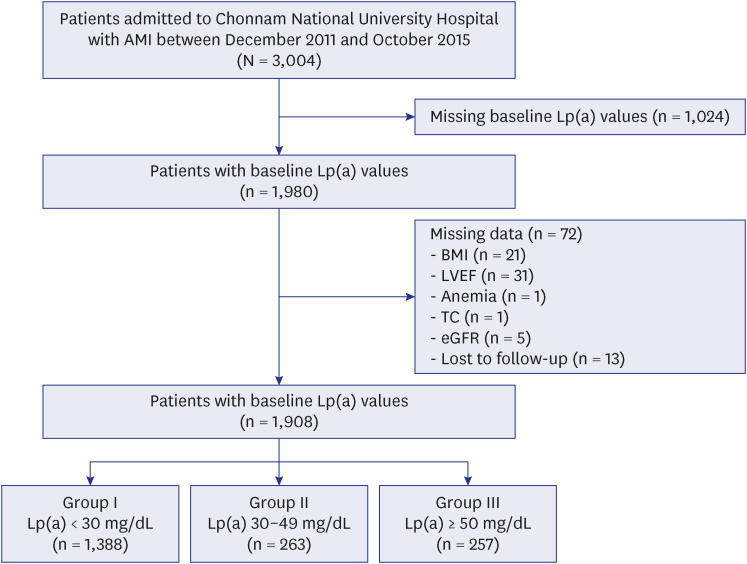
This was a single-center cohort study that involved patients between November 2011 and October 2015 at Chonnam National University Hospital, as a part of prospective, observational Korea Acute Myocardial Infarction Registry.2122 A total of 3,004 adult patients admitted with AMI were enrolled. From this sample, 1,024 whose Lp(a) levels were not measured at baseline, were excluded. In addition, a further 72 were excluded due to loss to follow-up or the absence of any of the following clinical data: body mass index, left ventricular ejection fraction, anemia, total cholesterol, and creatinine clearance. In the final analysis, a total of 1,908 patients (mean 65.2 ± 12.8 years, 70.5% men) were included. They were divided into the following groups according to Lp(a) levels: groups I (Lp(a) < 30 mg/dL, n = 1,388), II (Lp(a) 30–49 mg/dL, n = 263), and III (Lp(a) ≥ 50 mg/dL, n = 257) (Fig. 1).
Fig. 1
Flow chart of the study population. Data of the study population was derived from Chonnam National University Hospital in Korea.
AMI = acute myocardial infarction, Lp(a) = lipoprotein(a), BMI = body mass index, LVEF = left ventricular ejection fraction, TC = total cholesterol, eGFR = estimated glomerular filtration rate.
Outcomes and definition
The primary endpoint was three-point major adverse cardiovascular events (3P-MACEs), which was a composite of nonfatal myocardial infarction, nonfatal stroke, and cardiac death. All patients completed the 3-year follow-up via interview, chart review, or phone call regarding outcomes conducted by trained clinical research coordinators who were blinded to the patient information until the last day of follow-up. ST-segment elevation myocardial infarction (STEMI) was diagnosed based on the presence of a new ST-segment elevation ≥ 0.1 mV in ≥ 2 contiguous leads (≥ 0.2 mV in V2 to V3 leads) or a new left bundle branch block with a concomitant elevated cardiac biomarker. Percutaneous coronary intervention (PCI) was considered successful when residual stenosis of < 30% with ≥ grade II of final Thrombolysis In Myocardial Infarction flow was achieved. Venous blood samples were collected from patients in serum-separating tubes (Becton, Dickinson and Company vacutainer®) and centrifuged within 2 hours (2,465 g, 15 minutes). The relevant tests were performed immediately after collection of this centrifuged serum. Prior to September 1, 2017, plasma Lp(a) levels were determined using nephelometry (Siemens BNTM II system) and presented in mg/dL with an analytic range of 10.0 to 160 mg/dL. After September 1, 2017, Lp(a) levels were measured using immunoturbidimetry (AU5800, BECKMAN COULTER) and presented in an analytic range of 2.0 to 100 mg/dL. Other related biochemical and hematological indicators were measured according to standard tests.
Statistical analysis
Statistical analyses were performed using R version 4.1.1 (R Foundation for Statistical Computing, Vienna, Austria). The baseline characteristics of the study population are presented as mean ± standard deviation for continuous variables and as numbers and percentages for categorical variables. Continuous variables among groups were compared using the one-way analysis of variance and categorical variables were compared using the χ2 test or Fisher exact test, as appropriate. Trend tests were performed to examine trends in the variables across the Lp(a) strata. Cumulative incidence rates for 3P-MACE among groups were compared by log-rank tests. The hazard ratios (HRs) of variables for 3P-MACE were assessed using the Cox proportional hazards model. Variables with a P value < 0.05 in the univariable model were added to the multivariable model; they included the following: age, sex, body mass index, hypertension, diabetes mellitus, smoking, family history of premature coronary artery disease, history of myocardial infarction, heart failure, and cerebrovascular disease, systolic blood pressure < 100 mmHg, left ventricular ejection fraction ≤ 50%, Killip classification ≥ 2 on admission, anemia, total cholesterol ≥ 240 mg/dL, LDL cholesterol, estimated glomerular filtration rate < 60 mL/min/1.73 m2, PCI, and high-intensity statin. Sensitivity analyses were performed in statin-naïve patients, in those who underwent successful PCI, and statin-users. This study was reported in accordance with the STROBE (STrengthening the Reporting of OBservational studies in Epidemiology) guidelines.
Ethics statement
The study protocol was reviewed and approved by the Institutional Review Board of Chonnam National University Hospital (approval Number: BTMP-2022-300). The need for informed consents was waived due to the retrospective nature of the study. This study was conducted according to the principles expressed in the Declaration of Helsinki.
RESULTS
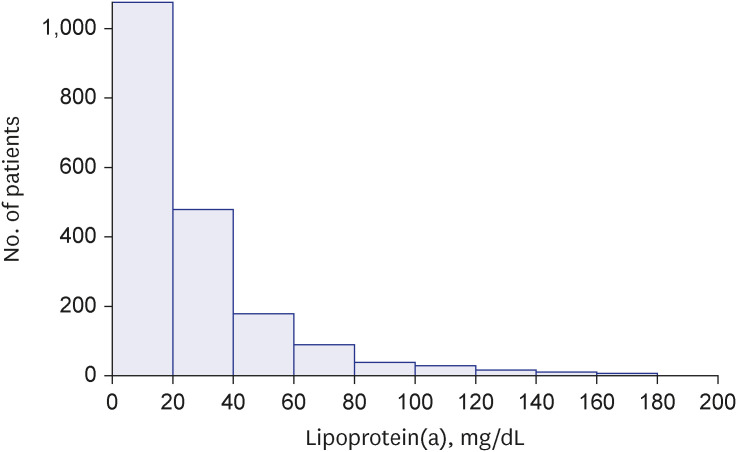
The Lp(a) levels ranged from 8.94 to 178.0 mg/dL, with a median value of 17.0 mg/dL and a mean value of 26.6 mg/dL. Fig. 2 shows the distribution of Lp(a) levels in the studied population.
Fig. 2
Distribution of lipoprotein(a) levels. Bars indicate the number of patients grouped according to lipoprotein(a) levels at 20 mg/dL intervals.
Baseline characteristics and angiographic findings
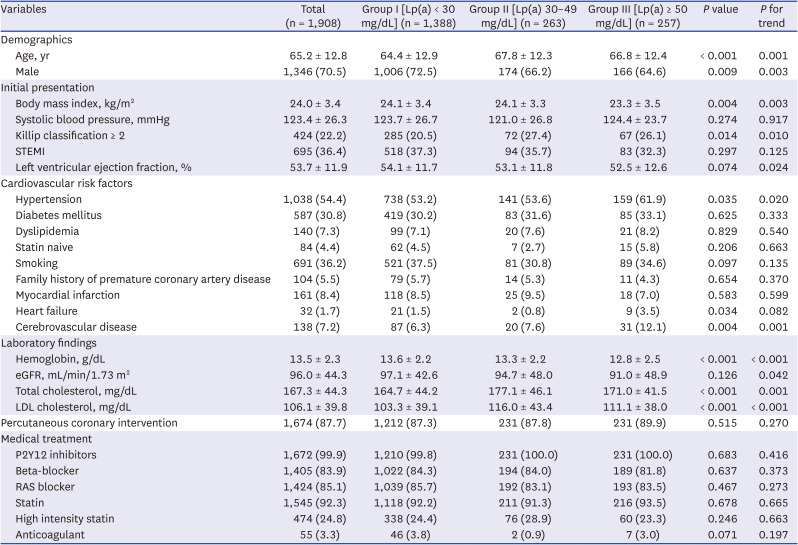
Baseline clinical and laboratory characteristics, and medications of enrolled patients are listed in Table 1. Patients with higher Lp(a) plasma levels (≥ 50 mg/dL) were older, more often female, less often obese, and more likely to have a history of hypertension and cerebrovascular disease compared with those with lower Lp(a) levels (< 30 mg/dL). Additionally, they were more likely to have low left ventricular ejection fractions, high Killip classification scores on admission, low hemoglobin levels, low creatine clearance rates, and high cholesterol levels. Among the 1,908 patients, 695 patients (36.4%) had STEMI, and 1,213 patients (63.6%) had non-ST-segment elevation myocardial infarction (NSTEMI). There were no significant differences in medications at discharge between the two groups.
Table 1
Baseline clinical and laboratory characteristics, and medications at discharge
Coronary angiographic findings of patients with AMI are listed in Supplementary Table 1. A total of 1,897 (99.4%) of 1,908 patients underwent coronary angiography and 1,674 (87.7%) of them underwent PCI. Patients with higher Lp(a) levels (≥ 50 mg/dL) were more likely to have multivessel disease.
Clinical outcomes
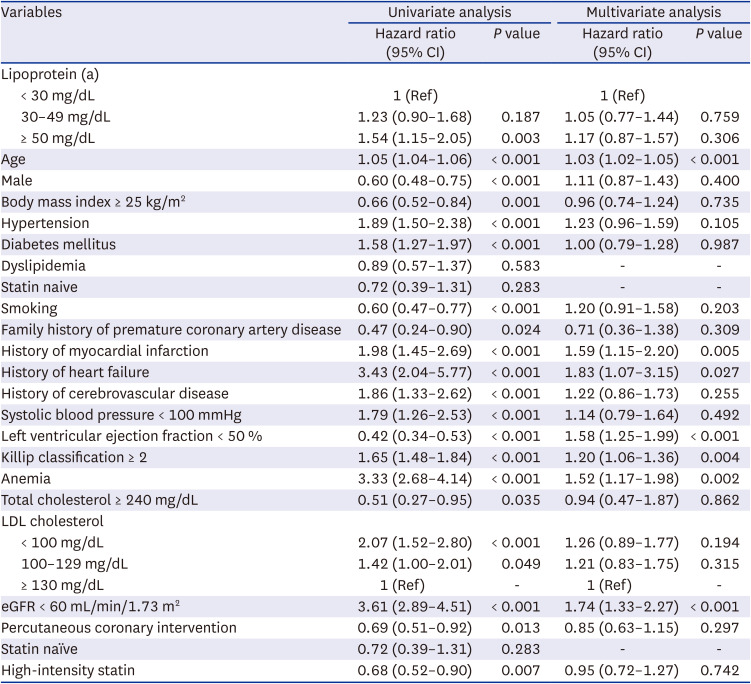
All patients were followed for 1,094.0 (interquartile range, 1,033.8–1,095.0) days, and 3P-MACE occurred in 326 (17.1%) patients during this period. Among the 326 patients with 3P-MACE, 105 (32.2%) had nonfatal myocardial infarction, 60 (18.4%) had nonfatal stroke, and 193 (59.2%) died of cardiac causes. Fig. 3 represents the cumulative incidence curve of 3P-MACE at 3 years for the overall population. The differences among cumulative incidence curves were significant (log-rank P = 0.009), and high Lp(a) plasma levels were associated with an increased incidence of 3P-MACE. Table 2 shows the HR (95% confidence interval [CI]) of variables including the 3 Lp(a) groups, with group I as the reference. Compared with that of group I, the HR of group III for 3P-MACE was 1.54 (95% CI, 1.15–2.05; P = 0.003). However, after performing multivariable adjustments, high Lp(a) plasma levels were not significantly associated with an increased incidence of 3P-MACE. Additional analyses were performed using log-transformed Lp(a) to have a normal distribution. Receiver operator characteristic curves for baseline log-transformed Lp(a) on 3P-MACE were created and revealed an area under the curve of 0.56. However, it is considered inappropriate to find the cut-off value of log-transformed Lp(a) to predict 3P-MACE (Supplementary Fig. 1).
Fig. 3
Cumulative incidence of 3P-MACE for the overall patient population. Kaplan-Meier curves for 3P-MACE (three-point major adverse cardiovascular events) over 3 years among the 3 groups are shown. Adjusted P value are derived from the Cox time-to-event multivariable analysis between patients with Lp(a) < 30 mg/dL and those with Lp(a) ≥ 50 mg/dL.
Lp(a) = lipoprotein(a), 3P-MACE = three-point major adverse cardiovascular events.
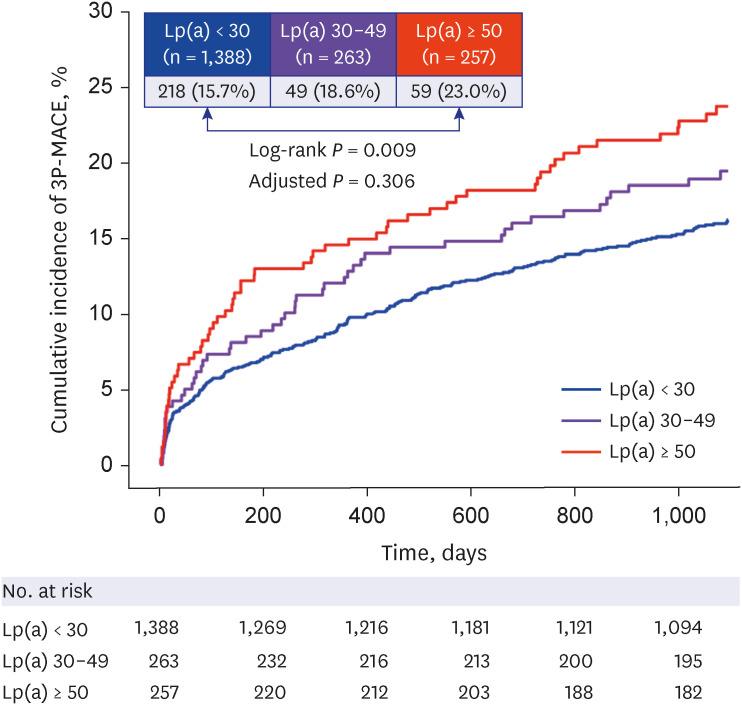
Table 2
Results from univariate and multivariate analyses to assess correlates of 3P-MACE at 3 years
Subgroup and sensitivity analysis
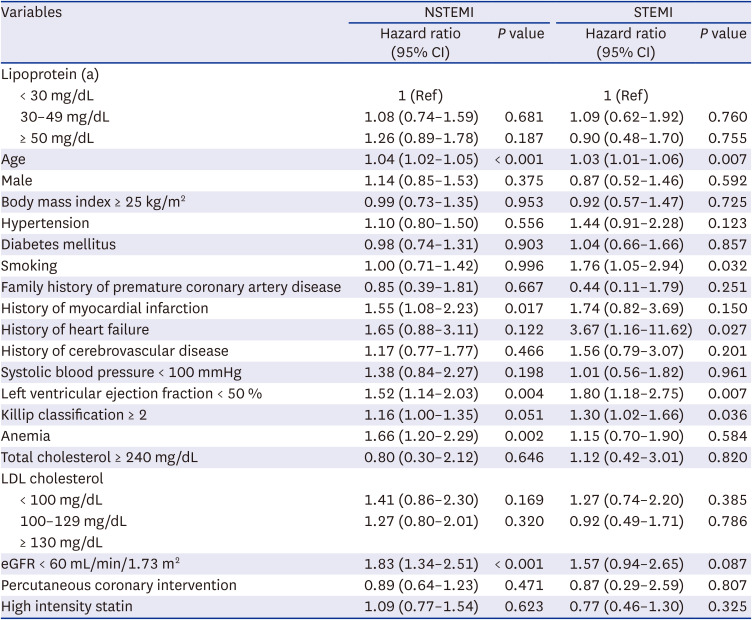
Subgroup analyses were performed for different AMI types. Fig. 4A and 4B show the cumulative incidence curves for 3P-MACE in patients with NSTEMI or STEMI patients, respectively. High Lp(a) plasma levels were associated with an increased incidence of 3P-MACE at 3 years in patients with NSTEMI (log-rank P = 0.006). However, there was no significant association between Lp(a) levels and an incidence of 3P-MACE in patients with STEMI (log-rank P = 0.597). Table 3 represents Cox time-to-event multivariable model for 3P-MACE in patients with NSTEMI or STEMI. Regardless of the type of AMI, plasma Lp(a) levels were not associated with an increased incidence of 3P-MACE.
Fig. 4
Cumulative incidence of 3P-MACE among patients with NSTEMI (A) and STEMI (B). Kaplan-Meier curves for 3P-MACE (three-point major adverse cardiovascular events) over 3 years among the 3 groups are shown.
Lp(a) = lipoprotein(a), NSTEMI = non-ST-segment elevation myocardial infarction, 3P-MACE = three-point major adverse cardiovascular events, STEMI = ST-segment elevation myocardial infarction.
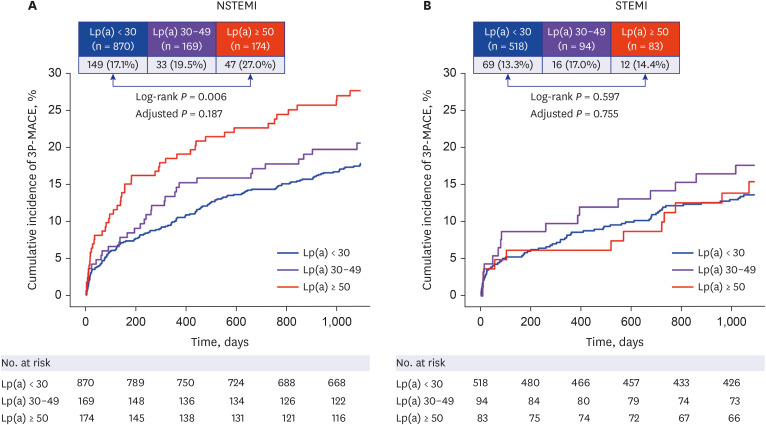
Table 3
Multivariate analysis to assess correlates of 3P-MACE at 3 years according to the type of myocardial infarction
When sensitivity analyses in a multivariable model were performed in statin-naïve patients, in those successfully treated with PCI, and statin-users, plasma Lp(a) levels were not associated with an increased incidence of 3P-MACE (Supplementary Tables 2 and 3).
DISCUSSION
In this single-center cohort of patients with AMI in Korea, those with higher Lp(a) levels were older, more often female, less often obese, and more likely to have hypertension and cerebrovascular disease compared with those with lower Lp(a) levels. They were also more likely to have anemia, low creatine clearance rates, and high cholesterol levels. They had higher rates of 3P-MACE during a median follow-up of 3 years, which was specifically attributable to NSTEMI. However, after adjustments for multiple variables, a high baseline Lp(a) level was not an independent factor for an increased incidence of 3P-MACE at 3 years in patients with AMI, regardless of the type of AMI. Sensitivity analyses in statin-naïve patients, in those who successfully underwent PCI, and statin-users showed similar findings. To our knowledge, this is the first study to demonstrate that baseline Lp(a) levels are not independently associated with long-term cardiovascular outcomes in East-Asian patients diagnosed with AMI.
Among the 1,908 patients, 326 (17.1%) 3P-MACE occurred during the median follow-up of 3 years. In the ODYSSEY Outcomes (Evaluation of Cardiovascular Outcomes After an ACS During Treatment With Alirocumab) trial investigating the effect of alirocumab on cardiovascular outcomes after an ACS, a composite of all-cause death, nonfatal myocardial infarction, and nonfatal stroke occurred in 10.3% (973/9462) of patients in the alirocumab group during the median follow-up duration of 2.8 years.23 Patients presenting with ACS are at high risk of future atherosclerotic cardiovascular disease events.8 An individual patient-data meta-analysis including 29,069 patients demonstrated that the association between baseline Lp(a) and cardiovascular disease risk is approximately linear with increased risk at Lp(a) values of 30 mg/dL or greater, irrespective of LDL cholesterol levels.10 In the FOURIER trial, the higher Lp(a) levels were associated with an increased risk of a composite of cardiac death, nonfatal myocardial infarction, and revascularization independent of LDL cholesterol levels. This trial also demonstrated that evolocumab reduced the risk of cardiovascular events by 23% (HR, 0.77; 95% CI, 0.67–0.88) in patients with a baseline Lp(a) > median, and by 7% (HR, 0.93; 95% CI, 0.80–1.08; P interaction = 0.07) in those with baseline Lp(a) ≤ median. Recently, Schwartz et al.24 performed a post hoc analysis of the ODYSSEY Outcomes trial and demonstrated that proprotein subtilisin/Kexin type 9 inhibition provides incremental clinical benefit only when Lp(a) levels are at least mildly elevated in patients with ACS who have LDL cholesterol levels near 70 mg/dL after optimized statin therapy. This body of evidence supports the association between Lp(a) levels on residual cardiovascular risk in patients with ACS, independent of LDL cholesterol levels.
However, in the present study, although patients with higher Lp(a) levels had higher incidence rates of 3P-MACE during a median follow-up of 3 years, a high baseline Lp(a) level was not an independent factor for an increased incidence of 3P-MACE after AMI. When patients were stratified into subgroups according to the AMI types (STEMI vs. NSTEMI), previous statin treatments, and successful PCI, an independent association between Lp(a) levels and 3P-MACE at 3 years was still not detected. Furthermore, results of previous studies investigating the association between baseline Lp(a) and cardiovascular outcomes after index events in patients with ACS are conflicting. An analysis of the Pravastatin or Atorvastatin Evaluation and Infection Therapy trial was also unable to establish an independent association between Lp(a) levels, which were measured approximately 1 week after the index event and cardiovascular outcomes in patients with ACS.25 Gencer et al.13 analyzed 1,711 patients with ACS from a multicenter Swiss cohort between 2009 and 2012 and found that high Lp(a) levels at the time of angiography were not predictive of cardiovascular outcomes at 1 year. Roth et al.14 analyzed 1,245 patients with ACS from the medical university of Vienna between 2004 and 2012 and found that Lp(a) levels at the time of ACS were not associated with cardiovascular or all-cause mortality during a median follow-up of 5 years. In contrast, a Chinese cohort study involving 1,008 patients with AMI aged ≥ 80 years between 2012 and 2018 found that baseline Lp(a) concentration was independently associated with the increased risk of cardiac death at 3 years.15 Most recently, Takahashi et al.16 analyzed 1,131 Japanese patients with ACS between 2008 and 2017 and found that high Lp(a) levels are independently associated with increased incidence rates of major adverse cardiovascular events at a median follow-up of 2.2 years. However, they did not consider several hemodynamic parameters including systolic blood pressure, Killip classification on presentation, and left ventricular ejection fraction in the multivariable adjustments.
The associated risk between high Lp(a) levels and myocardial infarction varies markedly between ethnic groups.17 Paré et al.17 analyzed 6,085 patients with first-time myocardial infarction and 6,857 controls from 7 ethnic groups. They reported that Lp(a) concentration varied markedly among the ethnic groups, observing an especially high population burden in South Asians and Latin Americans. In addition to the Chinese cohort study,15 a Japanese cohort study involving 190 consecutive patients with STEMI between 2010 and 2012 demonstrated that baseline Lp(a) levels independently predicted major adverse cardiac and cerebrovascular events after index events.26 The median Lp(a) level in the present cohort was 17.1 mg/dL, which is similar to the reported levels in these Asian ACS cohort studies.1526 However, European observational studies on Lp(a) levels in patients with ACS have reported different median Lp(a) levels, including 32 mg/dL in Austrians and 6 mg/dL in Swiss populations. The index event bias contributes to the neutral association between Lp(a) levels and cardiovascular outcomes after ACS events.14 However, in the present cohort, patients with high Lp(a) levels were older and more likely to have a history of hypertension and cerebrovascular disease, low creatinine clearance, and multivessel coronary disease. This is consistent with results of previous studies that showed an increased prevalence of more severe disease in patients with elevated levels of Lp(a).142728
Lp(a) is an emerging risk factor for development of atherosclerotic cardiovascular disease. Additionally, recent guidelines recommend the use of Lp(a) to identify patients at high risk of atherosclerotic cardiovascular disease.56 However, these guidelines do not include Lp(a) as a predictive item for patients with ACS.2930 Although LDL cholesterol has been known to be one of most important risk factors for the development of atherosclerotic cardiovascular disease, the prognostic value of baseline LDL cholesterol in patients with clinical atherosclerotic cardiovascular disease is different from what is expected.181920 A previous study involving 9,571 patients with AMI demonstrated that clinical outcomes after PCI showed worse results as LDL cholesterol levels decreased, however, this cholesterol paradox was related to confounding by baseline characteristics associated with outcomes.18 Similarly, in the present study, high Lp(a) plasma levels were associated with an increased incidence of 3P-MACE in univariable analysis, however, high Lp(a) plasma levels were not independently associated with an increased incidence of 3P-MACE in a Cox time-to-event multivariable model. In other words, a causal factor for development of atherosclerotic cardiovascular disease may not be an independent prognostic factor after clinical atherosclerotic cardiovascular disease events. This may be due to the following: first, the impact of Lp(a) itself on clinical outcomes after clinical atherosclerotic cardiovascular disease may not be same to that on the development of the disease. Independent predictive factors after ACS include the degree of pulmonary edema, blood pressure, and heart rate, which are considered as markers of the body’s response to the stress.29 Second, baseline Lp(a) levels in patients with AMI may be related with other health status. A previous long-term prospective study involving 5,941 Japanese-Americans suggested that a decline in serum total cholesterol levels occurs before the diagnosis of diseases, including malignancy and chronic liver disease.31 Furthermore, several cohort studies have suggested that low cholesterol levels were associated with a decline in functional performance or increased frailty.3233
The present study has several limitations. First, it was performed using a single-center cohort; thus, the results need to be externally validated. However, our center is the largest center dealing with patients with AMI in Korea, and the median value of Lp(a) in our cohort was consistent with those of Japanese and Chinese ACS cohorts, as discussed above. Furthermore, a single-center cohort may have more homogeneity in residual confounders that affect clinical outcomes, such as hospital resources and procedural techniques than a multicenter cohort. Second, follow-up Lp(a) levels were not included in this study as increased serum Lp(a) levels are typically observed during the early phase of AMI.34 Third, the use of a cutoff value of > 50 mg/dL for high Lp(a) levels might have been arbitrary; however, it is the recommended value used in recent guidelines to identify patients at risk of high atherosclerotic cardiovascular disease events.5
In conclusion, baseline Lp(a) levels in Korean patients with AMI were not independently associated with increased major cardiovascular events at 3 years. Further studies are warranted to validate these results.
 XML Download