

 PDF
PDF Citation
 Print
Print


INTRODUCTION
The periodontal ligament (PDL) is an aligned fibrous network anchored firmly to the cementum covering the tooth root on one side and the alveolar bone of the jaw on the other side,1,2 and it can be represented by the root surface area (RSA) below the alveolar bone crest. The area of contact between tooth roots and the surrounding bone plays an important role in orthodontic and periodontal treatment. It has been proposed that the PDL and alveolar bone are functional units that undergo robust remodeling during orthodontic tooth movement.3 Moreover, the PDL area plays an important role in tooth anchorage,4 and morphological changes in the PDL reflect the vertical bone level (VBL).5 Quantification of the PDL area can help assess the severity of periodontal disease and the prognosis of orthodontic treatment.
Measurement of the alveolar bone thickness and VBL in the sagittal plane of cone-beam computed tomography (CBCT) images is a well-established method.6-8 Past studies have focused primarily on measurement of the height and thickness of the alveolar bone on the labial and lingual sides of the incisors in the sagittal plane. Evaluation of two-dimensional (2D) measurements without consideration of the three-dimensional (3D) PDL area may not adequately indicate the severity of periodontal lesions. Moreover, 2D linear measurements describe VBL in a one-dimensional manner without taking changes in the root shape into account, thus underestimating the true amount of periodontal loss.9-11
In other previous studies,9,12 microcomputed tomography (micro-CT) data were used to measure the RSA on reconstructed digital models of extracted teeth. However, the micro-CT technique cannot be used for in situ examination in human patients because of the unacceptably high radiation exposure.13 Unlike micro-CT,13,14 CBCT provides data for accurate and reproducible 3D reconstruction of the tooth volume, which is useful in some clinical applications. Moreover, CBCT combined with 3D reconstruction technology has been proven to be an efficient and reliable imaging technique for noninvasive acquisition of data on tooth surfaces in vivo.14,15 With regard to the assessment of periodontal bone loss, measurements of periodontal defects obtained by CBCT combined with 3D reconstruction have shown very high agreement with measurements obtained during surgery16 or by micro-CT, regardless of the voxel size.17
Researchers have also used CBCT to reconstruct the root surface to detect apical root resorption cavities14 and measure the RSA as an important marker for determination of the periodontal treatment plan and prognosis. However, RSA measurements do not take alveolar bone conditions into account; in recent years, the PDL surface area, or the RSA below the alveolar bone crest, has been studied as a marker of periodontal health, and researchers have artificially simulated the PDL area using digital models of teeth.5,9,10,12,17 Nevertheless, to our knowledge, this is the first study to obtain in vivo 3D PDL area measurements in the region of the alveolar bone crest in humans.
In the present study, instead of artificially simulating the alveolar bone crest in vitro, we measured the PDL area in vivo using 3D CBCT reconstruction. The aims of the study were (1) to utilize the 3D CBCT reconstruction technique to generate 3D virtual models of the teeth, PDL, and alveolar bone; (2) to evaluate the accuracy of the virtual models by comparing digital measurements with direct intraoperative measurements; and (3) to investigate the reproducibility of the method.
MATERIALS AND METHODS
Sample selection
Forty-eight anterior teeth from four patients (two female and two male) with skeletal Class III malocclusion requiring surgical orthodontic treatment and augmented corticotomy (AC) were evaluated in this study at Peking University School and Hospital of Stomatology from May 2021 to October 2021. All patients signed informed consent forms. The study was approved by the Biomedical Ethics Committee of the Peking University School and Hospital of Stomatology (approval number: PKUSSIRB-201839156) and registered on the Clinical Trials Register as ChiCTR1900021778 (Chinese Clinical Trials Registry Platform of the World Health Organization).
The inclusion criteria were as follows: 1) age > 18 years for male patients and > 16 years for female patients;18,19 2) A point–nasion–B point (ANB) angle of < 0° and overjet of < 0 mm; 3) no more than two sites with a probing depth of ≥ 5 mm in the entire oral cavity, bleeding on probing score of ≤ 20%, and plaque score of ≤ 30%; and 4) labial alveolar bone thickness of < 1 mm around the maxillary and mandibular central incisors, as measured by CBCT. The mean alveolar bone thickness at the root apex of the maxillary and mandibular central incisors was 0.81 ± 0.17 mm and 0.4 ± 0.15 mm, respectively. Patients with poor oral hygiene or uncontrolled periodontal disease were excluded.
All orthodontic treatments were performed by a single orthodontist using a straight-wire fixed appliance (0.022" slot size, MBT prescription). For the maxillary anterior teeth, the arch-wire sequence involved 0.014-, 0.016-, 0.018-, and 0.018 × 0.025-inch nickel-titanium wires before periodontal surgery. For the mandibular anterior teeth, periodontal surgery was performed after bracket bonding without any arch wire in place. Two weeks after periodontal surgery, aligning and leveling were initiated with 0.014-inch nickel-titanium wires.
Image acquisition
Prior to periodontal surgery, CBCT images were acquired with the NewTom VG device (Aperio Services, Verona, Italy) in the regular scan mode (field of view [FOV], 10 × 10 cm; voltage, 110 kV; current, 3.00 mA; and exposure, 1.8 seconds). The CBCT images were reconstructed using different voxel sizes (0.20, 0.25, and 0.30 mm). To reduce scatter at the occlusal plane, patients were instructed to bite on cotton rolls. Within 24 hours of CBCT image acquisition, the patients underwent intraoral scanning.
Generation of digital models
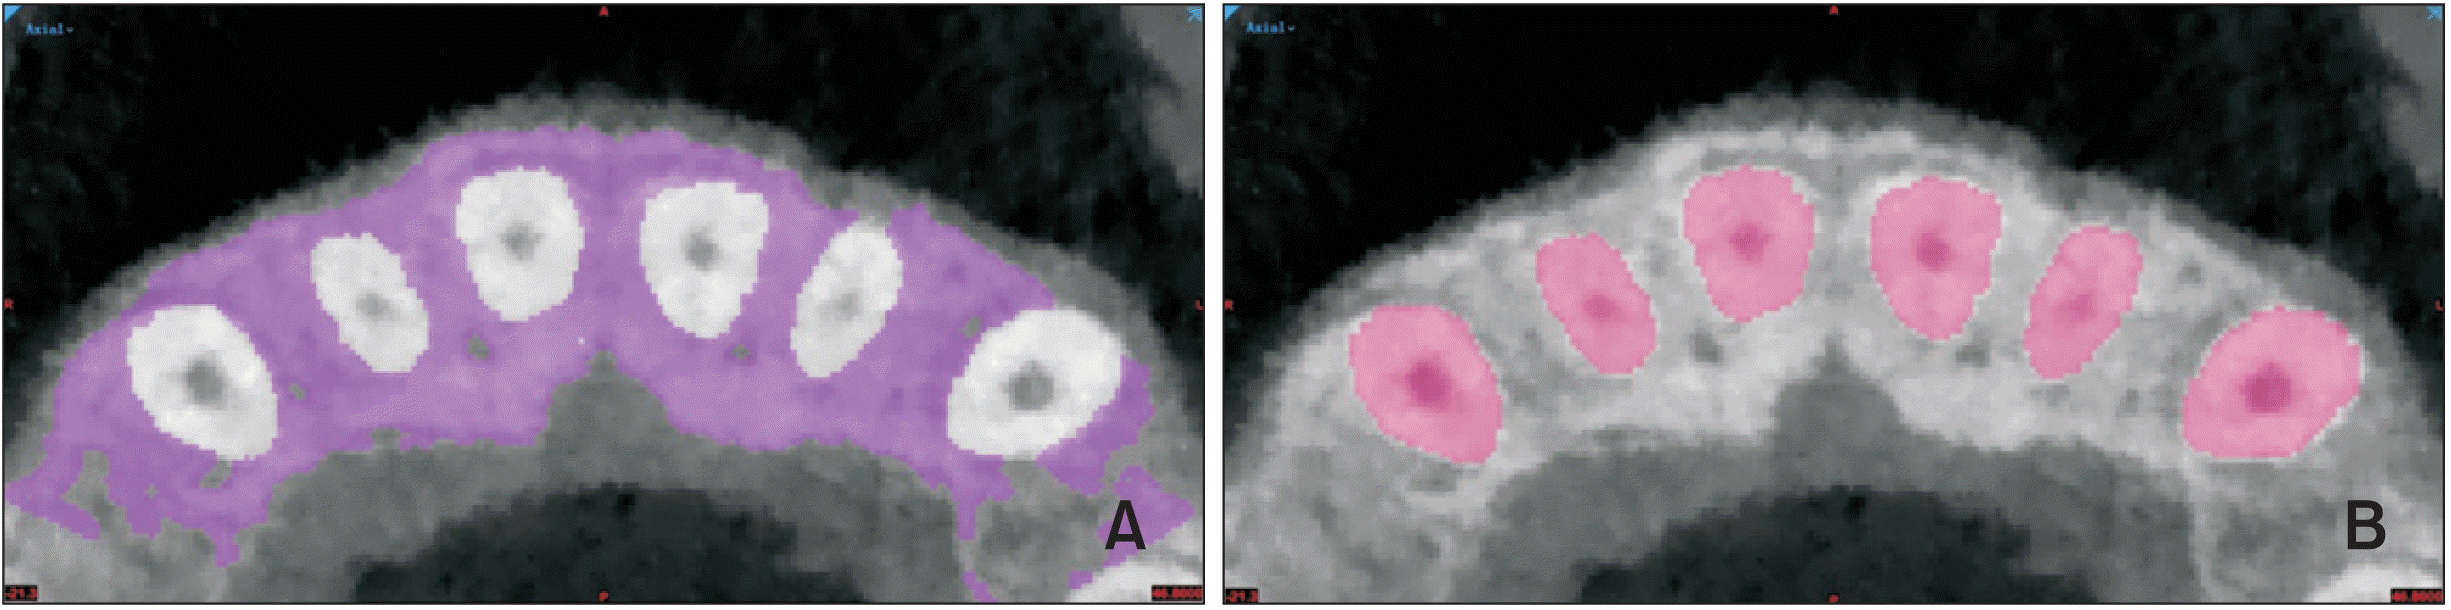
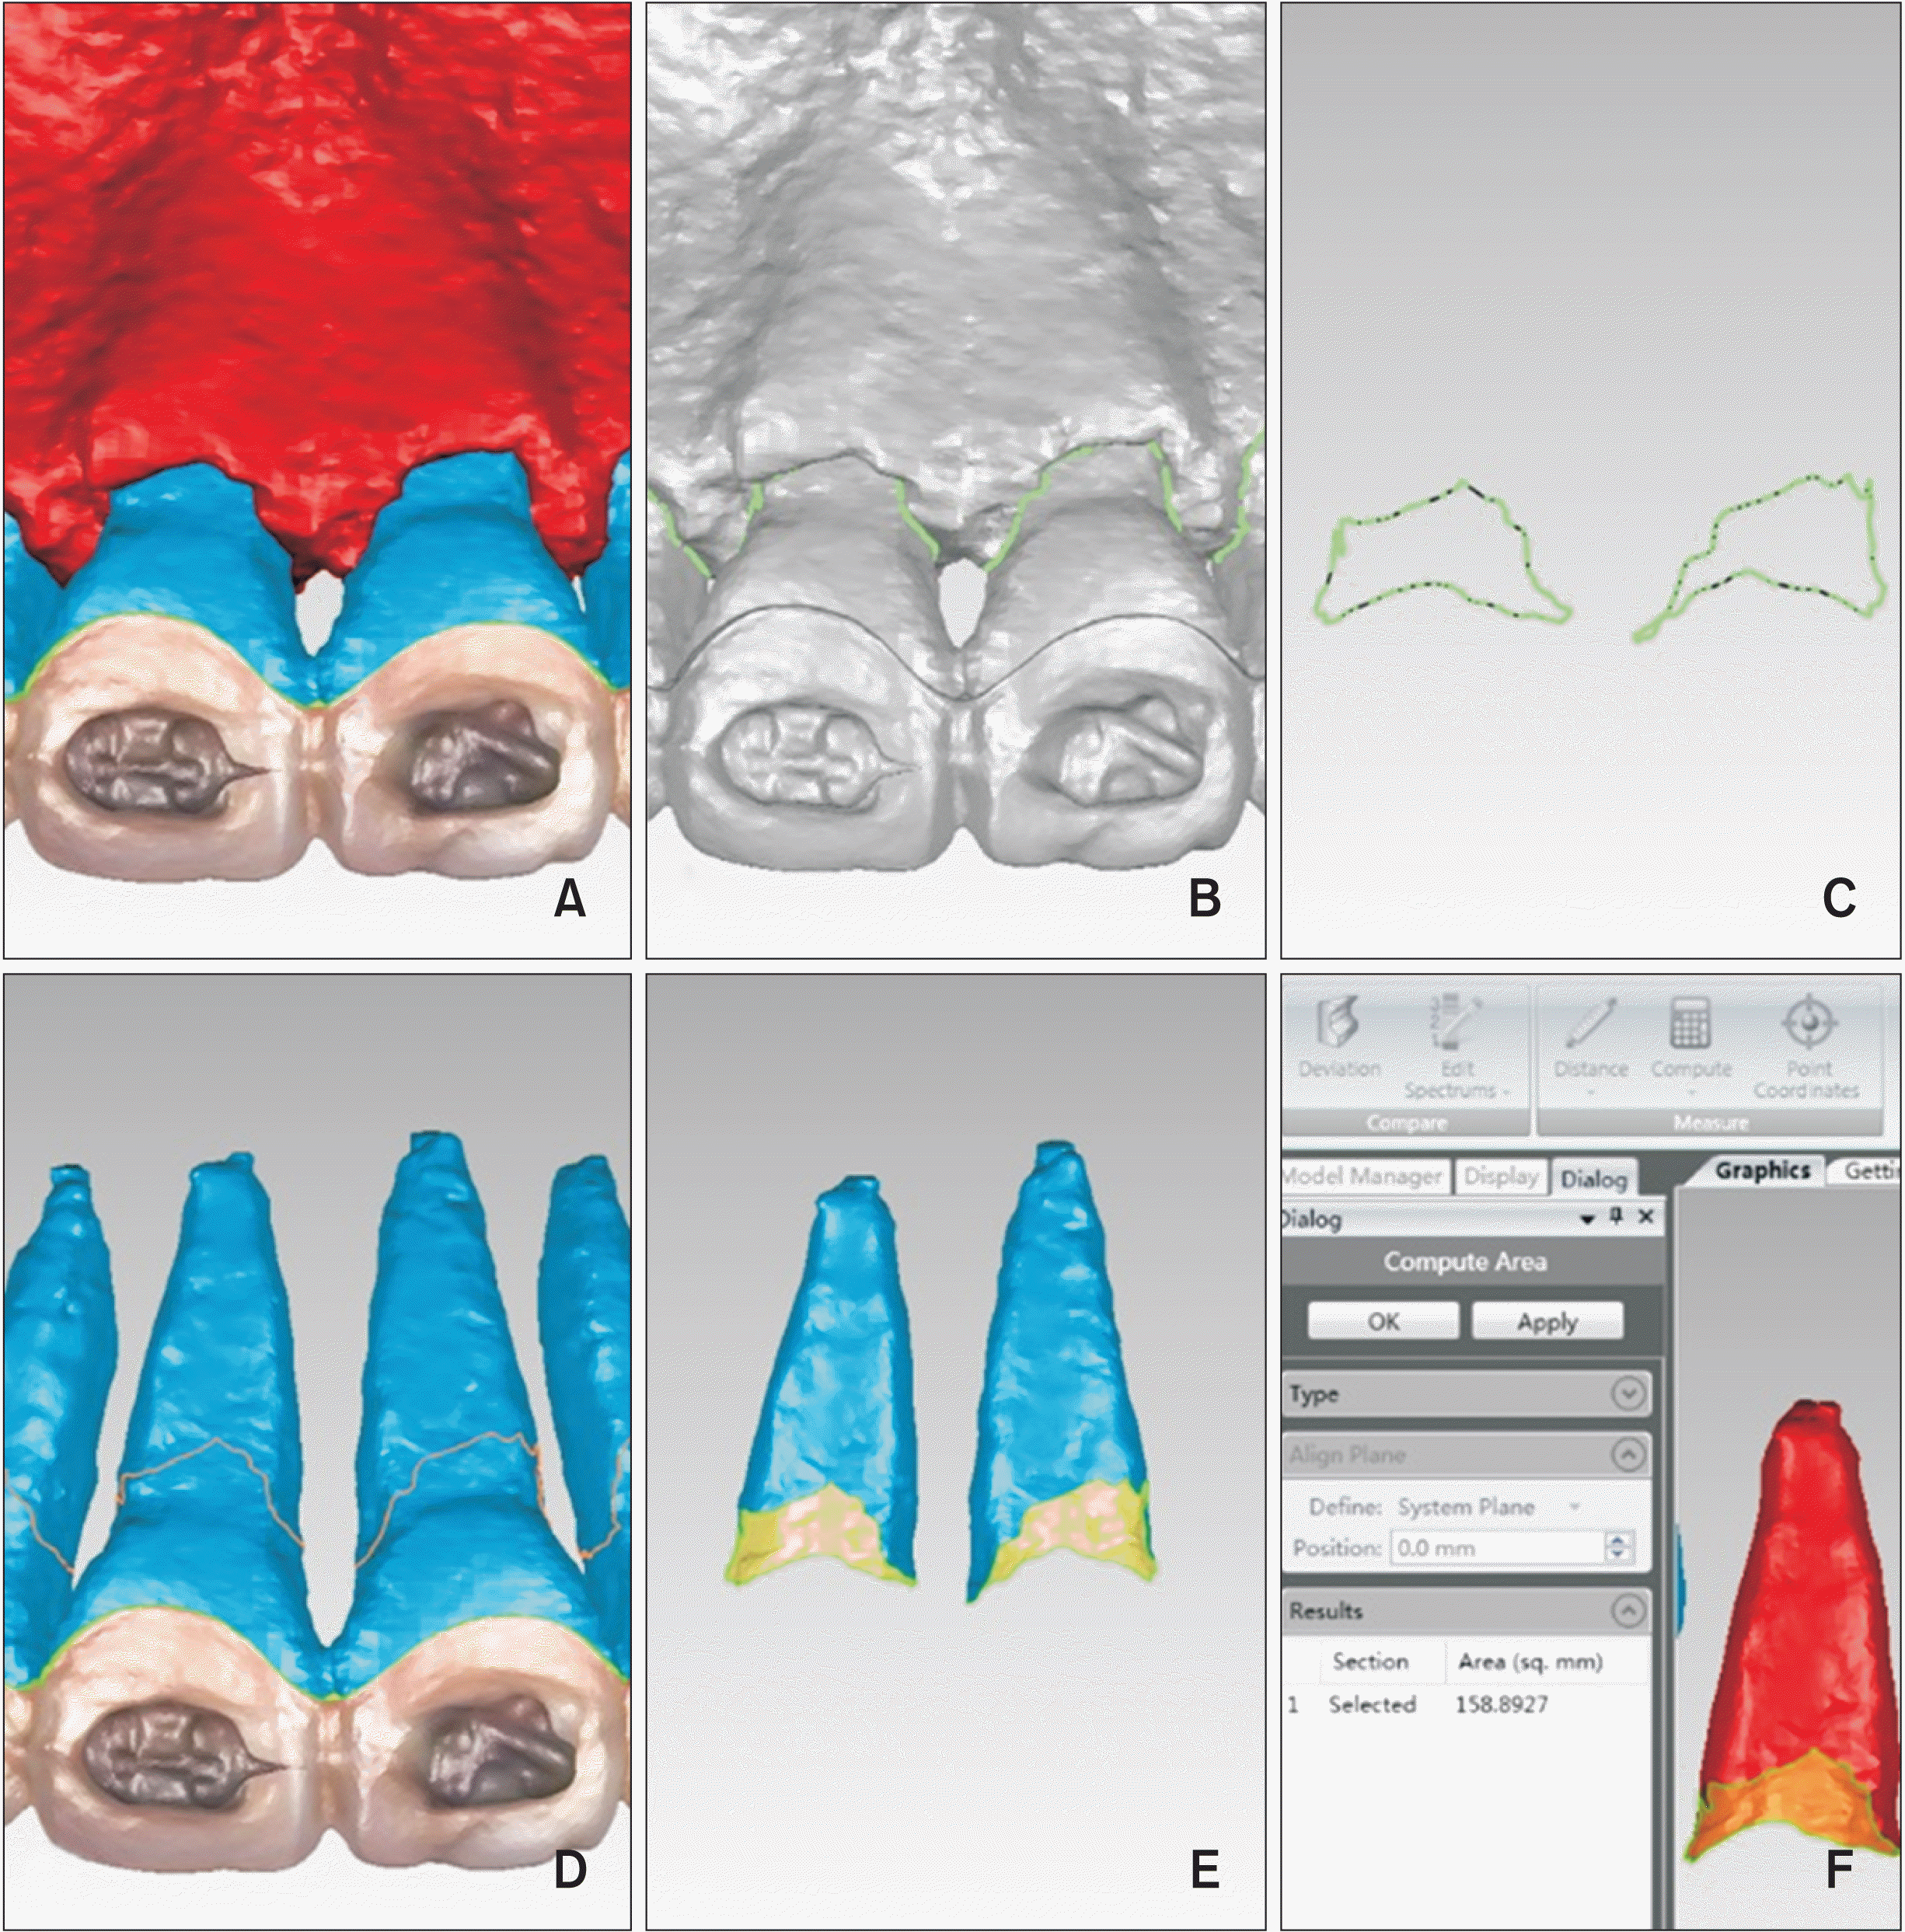
Digital Imaging and Communication in Medicine (DICOM) files were imported into Mimics 19.0 software (Materialise, Leuven, Belgium). In Mimics, 3D digital models of the anterior teeth and bone in vivo were reconstructed. In Mimics, the CBCT images had predefined thresholds that were set to correspond to the tooth or bone density as follows: tooth, 1,200–3,071 segments and bone, 226–3,071 segments. The threshold level was set to most clearly show the tooth anatomy with minimal interference from the surrounding bone and adjacent structures. On each CBCT slice, manual refinement was performed through a 2D slice-by-slice procedure to enhance accuracy by correcting for over- and under-contoured voxels in the tooth volume20 (Figure 1).
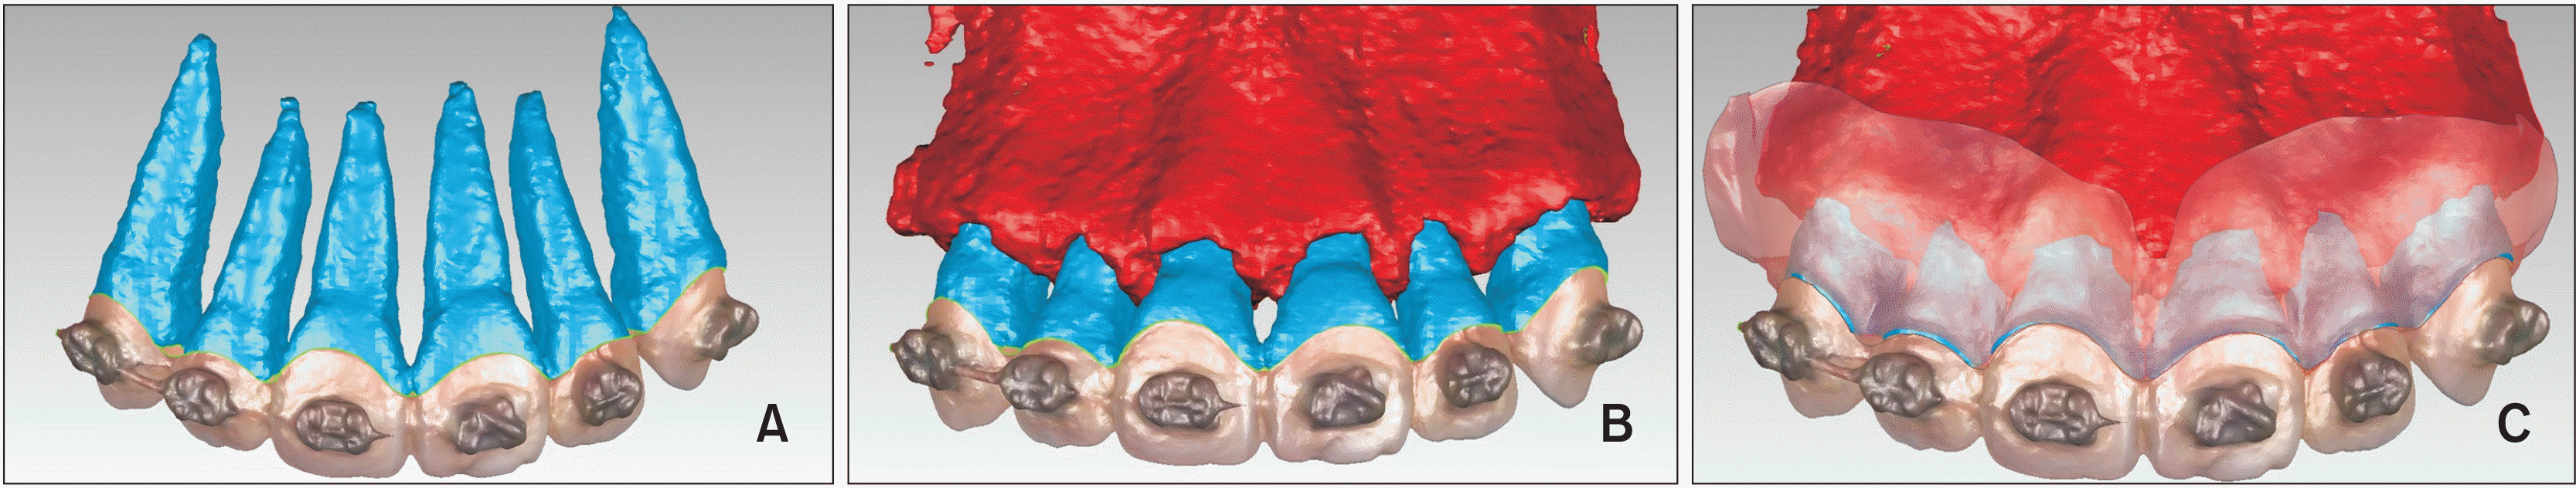
The digital models were exported in stereolithographic (STL) format and imported into Geomagic software (Geomagic, Cary, NC, USA). For more realistic digitalization of the metal brackets bonded to the teeth, a digital model derived from the intraoral scan was superimposed over the 3D model generated from the CBCT datasets (Figure 2).
Linear measurements of the alveolar bone crest on CBCT-derived digital models
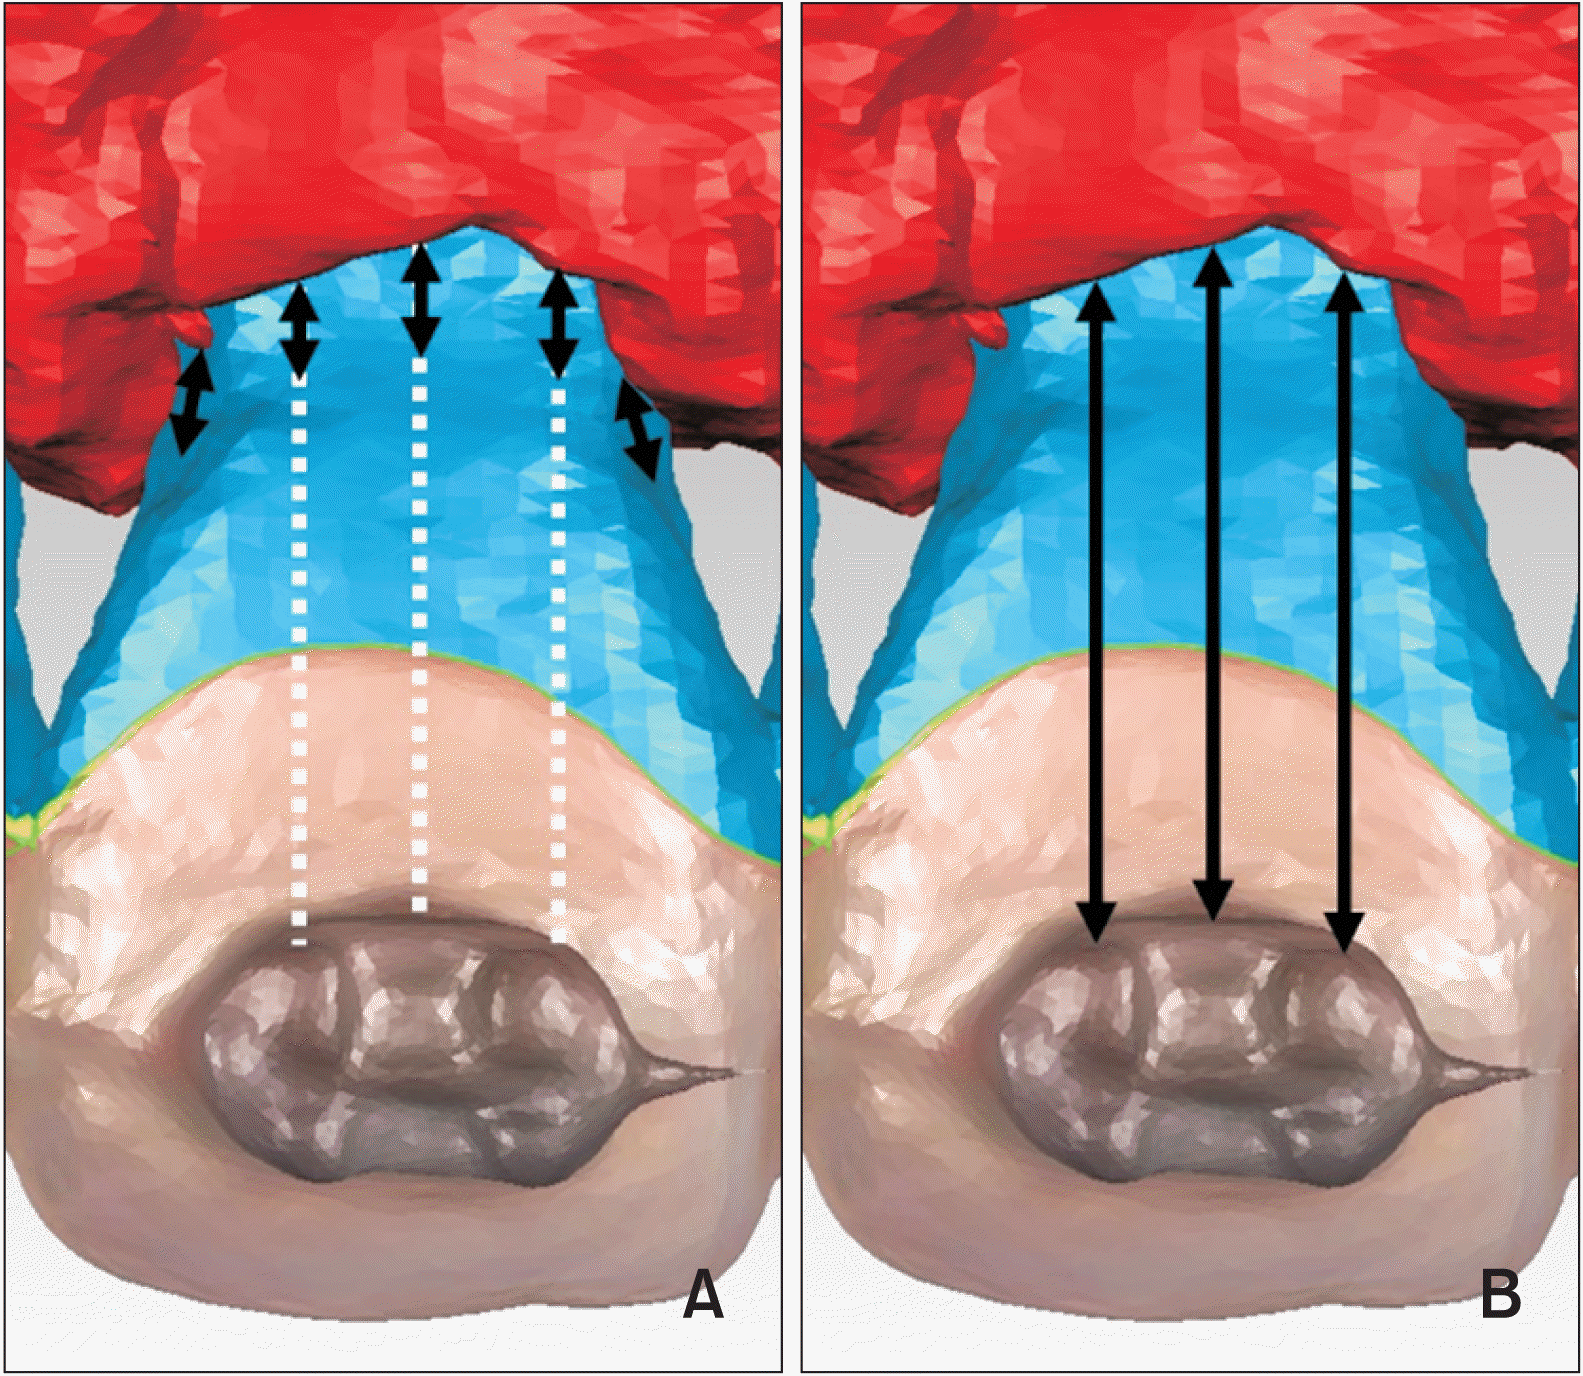
In Geomagic software, the vertical distance between the CEJ and alveolar bone crest parallel to the long axis of the anatomic crown was defined as the VBL. The long axis of the anatomic crown was determined by connecting the lowest point of the labial CEJ curve and the midpoint of the mesial and distal incisal angles. The five selected measurement sites on the digital models were the mesiolabial (VBL_MLa), mesiobracket (VBL_MB), midlabial (VBL_La), distobracket (VBL_DB), and distolabial (VBL_DLa) sites. The La point was chosen at the midlabial site on the surface. Proximal points on the surface, i.e., the MLa and DLa points, were located at the corner of each tooth. The vertical distance between the marginal bone crest and the gingival boundary of the metal bracket was defined as the bone-bracket distance (BBD). The three selected measurement points were the mesiobracket (BBD_MB), midlabial (BBD_La), and distobracket (BBD_DB) points. Detailed information about the measurement procedure is shown in Figure 3. Measurements were made to the nearest 0.01 mm using a linear measurement tool in a quiet and dark room.
Linear measurements of the alveolar bone crest during periodontal surgery
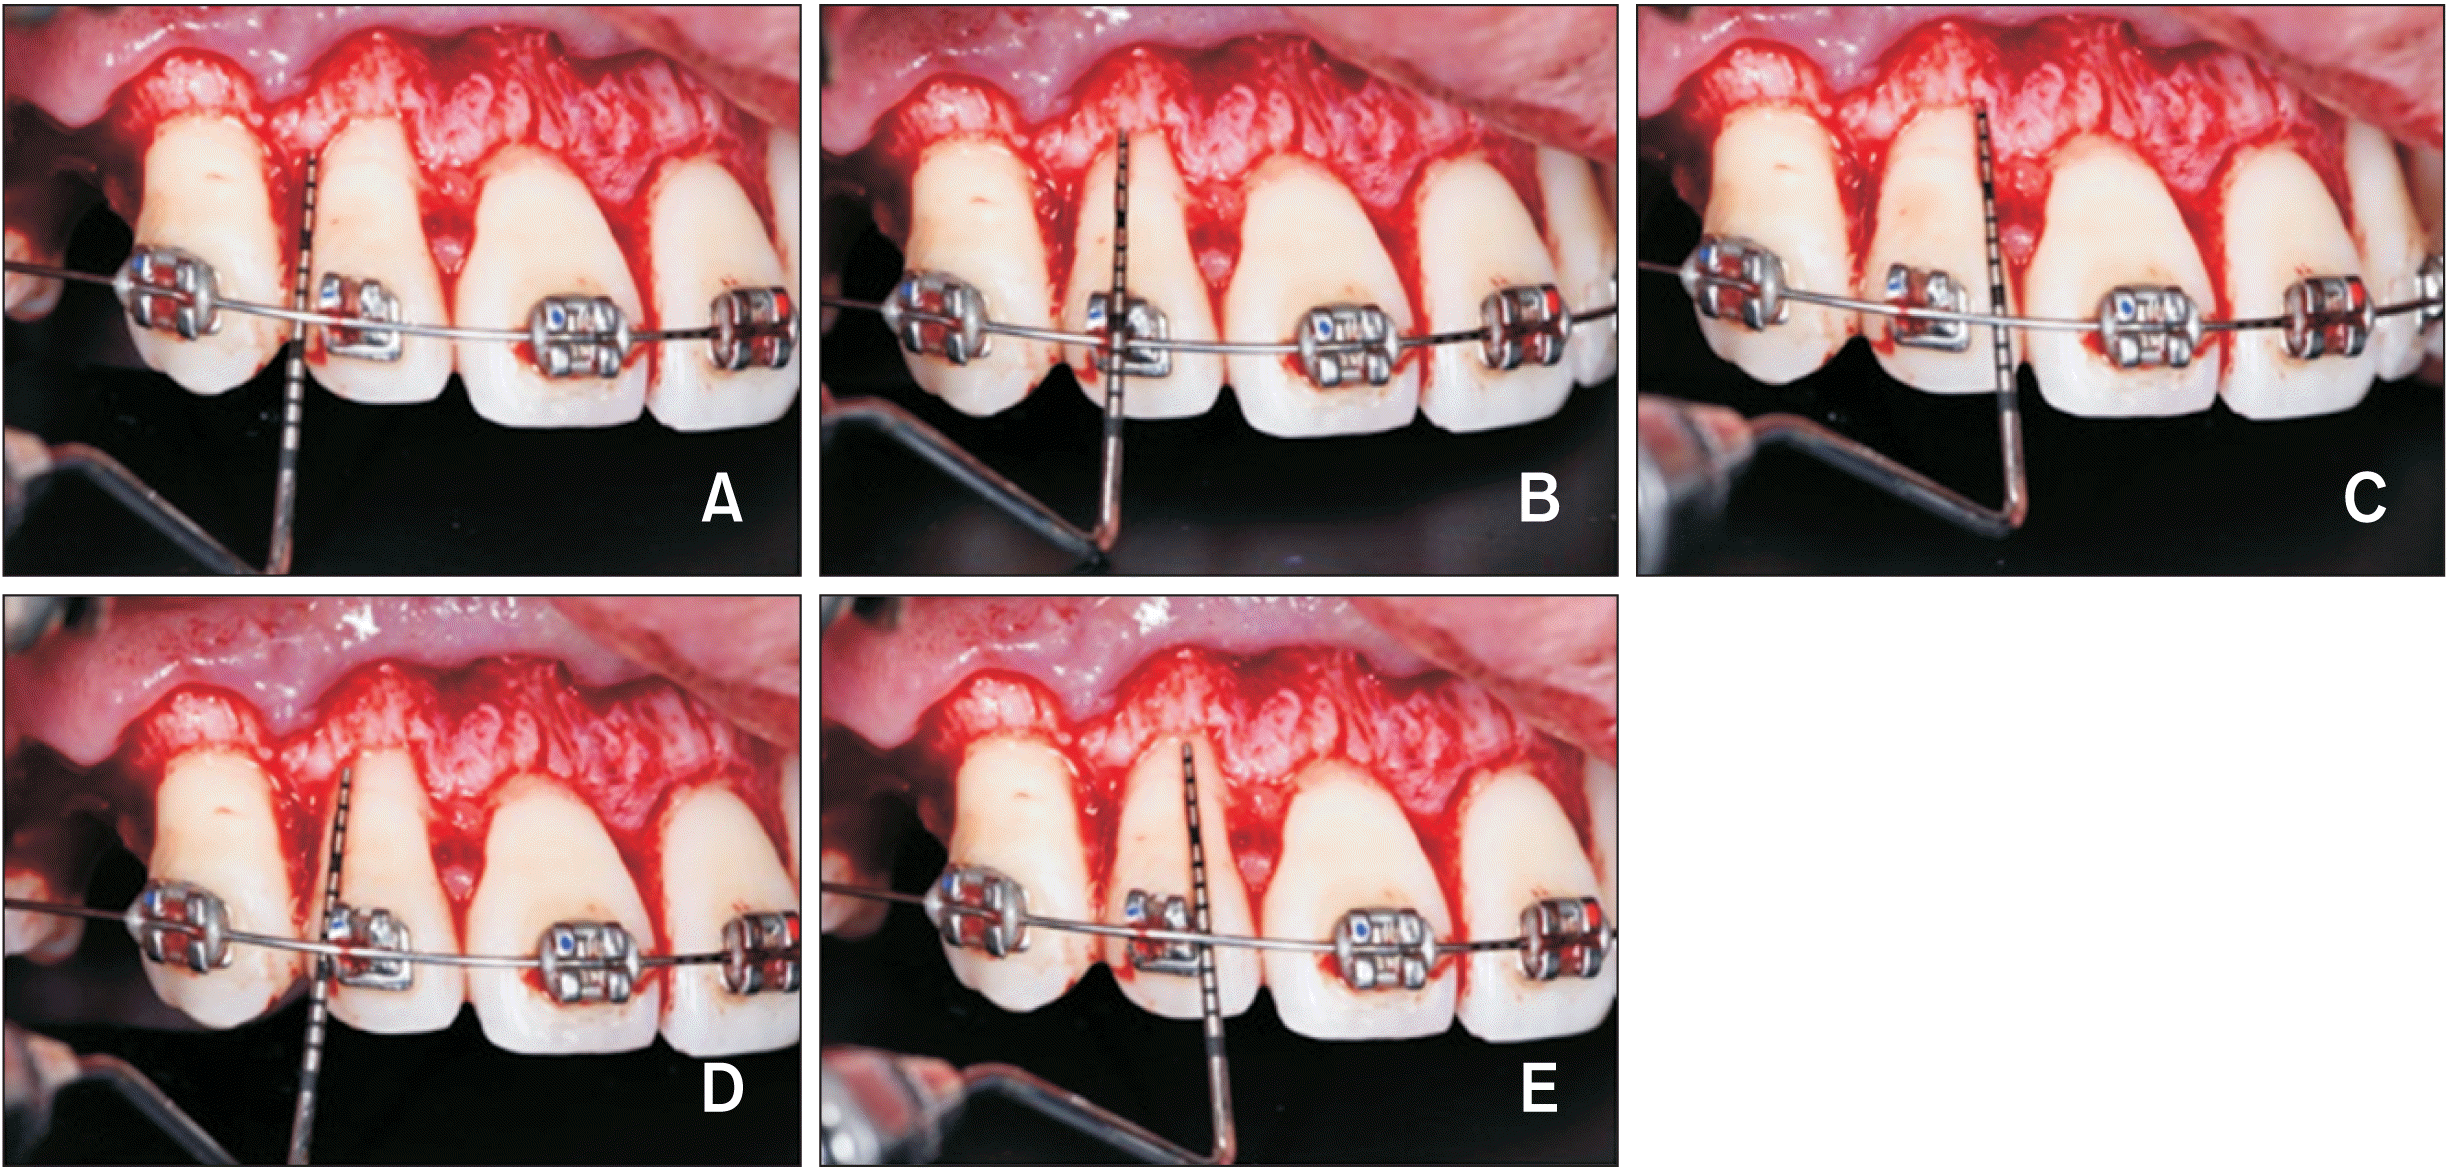
All AC procedures were performed by a single periodontist using surgical loupes. The AC procedure was performed as follows.21 A crevicular incision was made from the canine on one side to the canine on the other side, and a full thickness flap on the labial side was elevated. The distance parallel to the long axis of the anatomic crown between the CEJ and alveolar bone crest was measured at five sites, in addition to the distance between the alveolar bone crest and gingival boundary at the mesial and distal metal bracket sites (Figure 4). All measurements were made to the nearest 1 mm by the same experienced periodontist who performed the AC procedure using a manual periodontal probe (UNC-15, graded in millimetres; HU-Friedy, Chicago, IL, USA) placed parallel to the long axis of the tooth. The intraoperative measurements were considered the “reference standard.”
Segmentation of the digital PDL
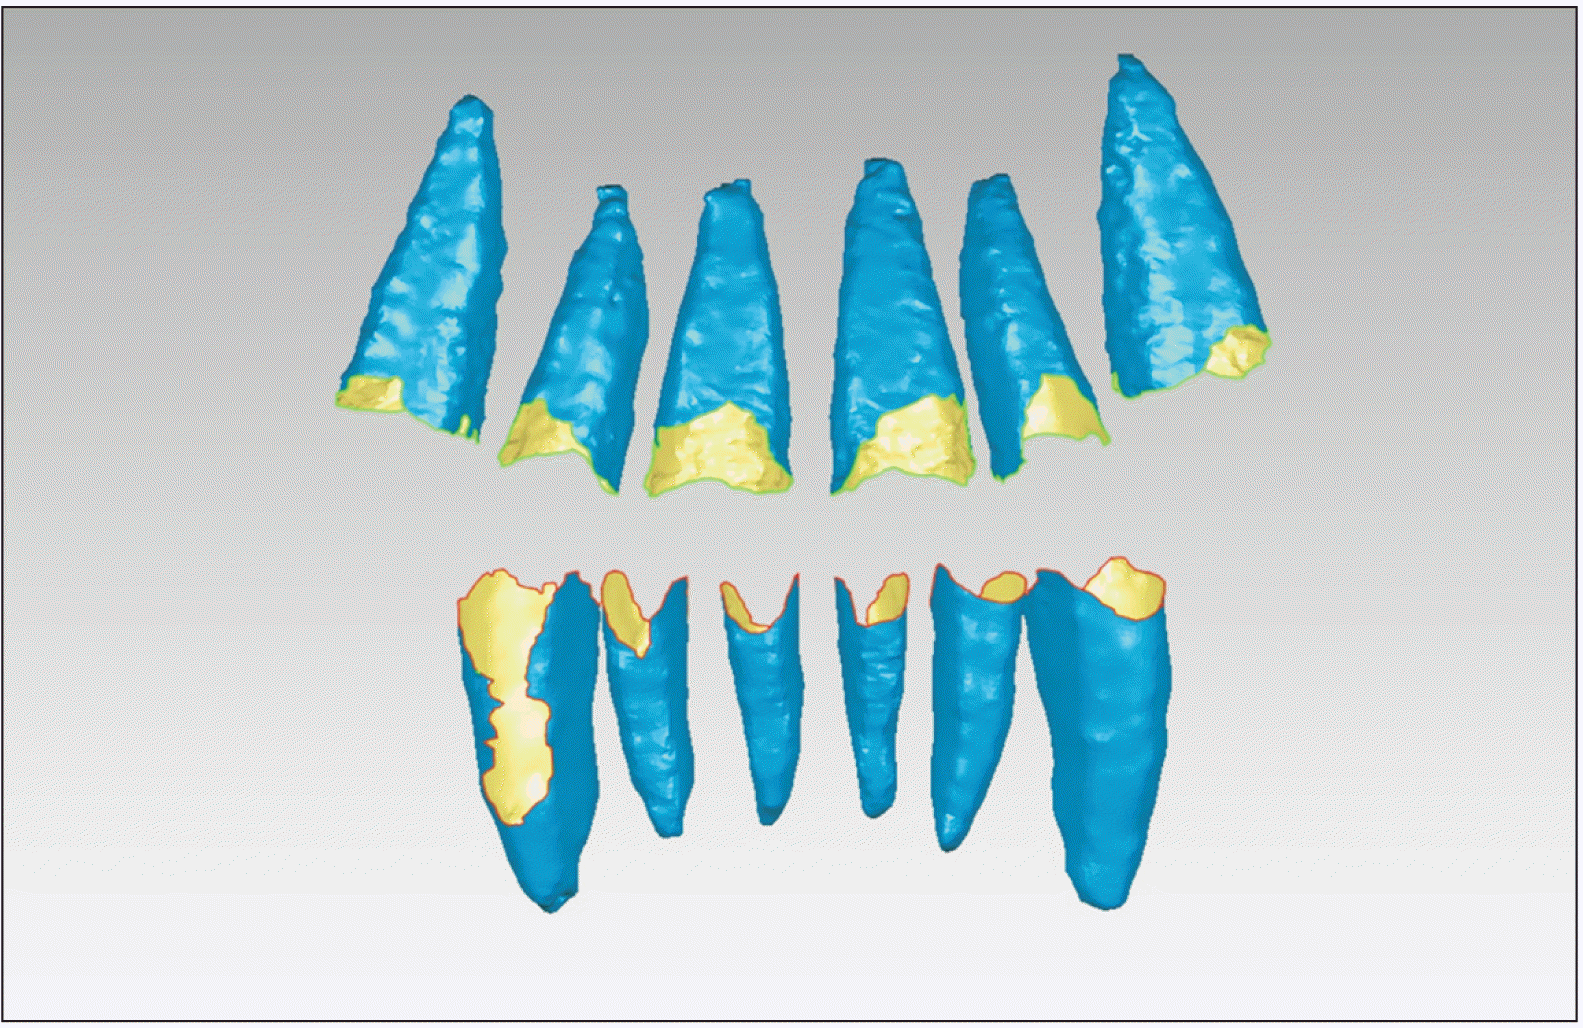
To segment the PDL in the digital model, we identified the alveolar bone crest in the digital model and drew points on the teeth in the model (Figure 5A and 5B). A curve was generated by connecting the points marked on the model surface using the creation method in Geomagic (Figure 5B). The created boundary curve represented the alveolar bone crest (Figure 5C). The teeth were then separated along the curve into two parts (Figure 5D), with preservation of the PDL (Figure 5E), and the PDL area in the digital model was calculated (Figure 5F).
Statistical analysis
Statistical analyses were performed using SPSS 20.0 (IBM Corp., Armonk, NY, USA). All linear measurements for the digital models were obtained twice at an interval of 2 weeks by the same investigator, and the average of these two measurements was used for statistical analysis. The systematic intraexaminer error was determined using a paired t-test, and the intraclass correlation coefficient (ICC) was calculated. One-way ANOVA with Duncan’s multiple comparison test was performed to compare linear measurements obtained during surgery and by CBCT at different sites and with different voxel sizes, and the ICC was calculated. Moreover, the Bland–Altman method was applied, and the limits of agreement were identified.
Descriptive statistics for differences between the intraoperative and digital measurements were separately computed. In addition, the 95% confidence interval (CI) was calculated, and diagnostic coincidence rates were calculated using an introduced variable measurement difference to evaluate the accuracy of site-based image assessment relative to the clinical measurement.
If the measurement difference ranged from −1 to +1 mm (including −1 and +1 mm), the measurement obtained from the 3D digital image was considered consistent with the intraoperative measurement; otherwise, the measurements were considered inconsistent. Thereafter, the corresponding diagnostic coincidence rates were calculated. To examine the agreement between the digital models obtained by different examiners, 24 randomly chosen teeth were assessed in a blinded manner by two authors with 4–8 years of experience in dental and periodontal imaging. The error was evaluated by measuring the surface area of the PDL in the models. The systematic interexaminer agreement was calculated using the ICC, and the Bland–Altman method was applied to identify the limits of agreement.
RESULTS
Validation of 3D digital model accuracy and consistency according to voxel size
For both the maxillary and mandibular anterior teeth, there were no significant differences in digital measurements at different sites among different voxel sizes (p > 0.05 for both); moreover, there were no significant differences between the digital and intraoperative BBD measurements (p > 0.05 for both; Table 1).
The maxillary anterior teeth showed no significant differences between the digital and intraoperative VBL measurements (p > 0.05; Table 1). However, for the mandibular anterior teeth, except for VBL_La, the digital VBL measurements were smaller than the intraoperative VBL measurements (p < 0.01; Table 1).
A statistically significant ICC was found for the correlation between all digital and intraoperative measurements (p < 0.01; Table 2), with ICC values ranging from 0.646 to 0.793 for the VBL and from 0.839 to 0.908 for the BBD.
Agreement and reliability of 3D virtual model measurements
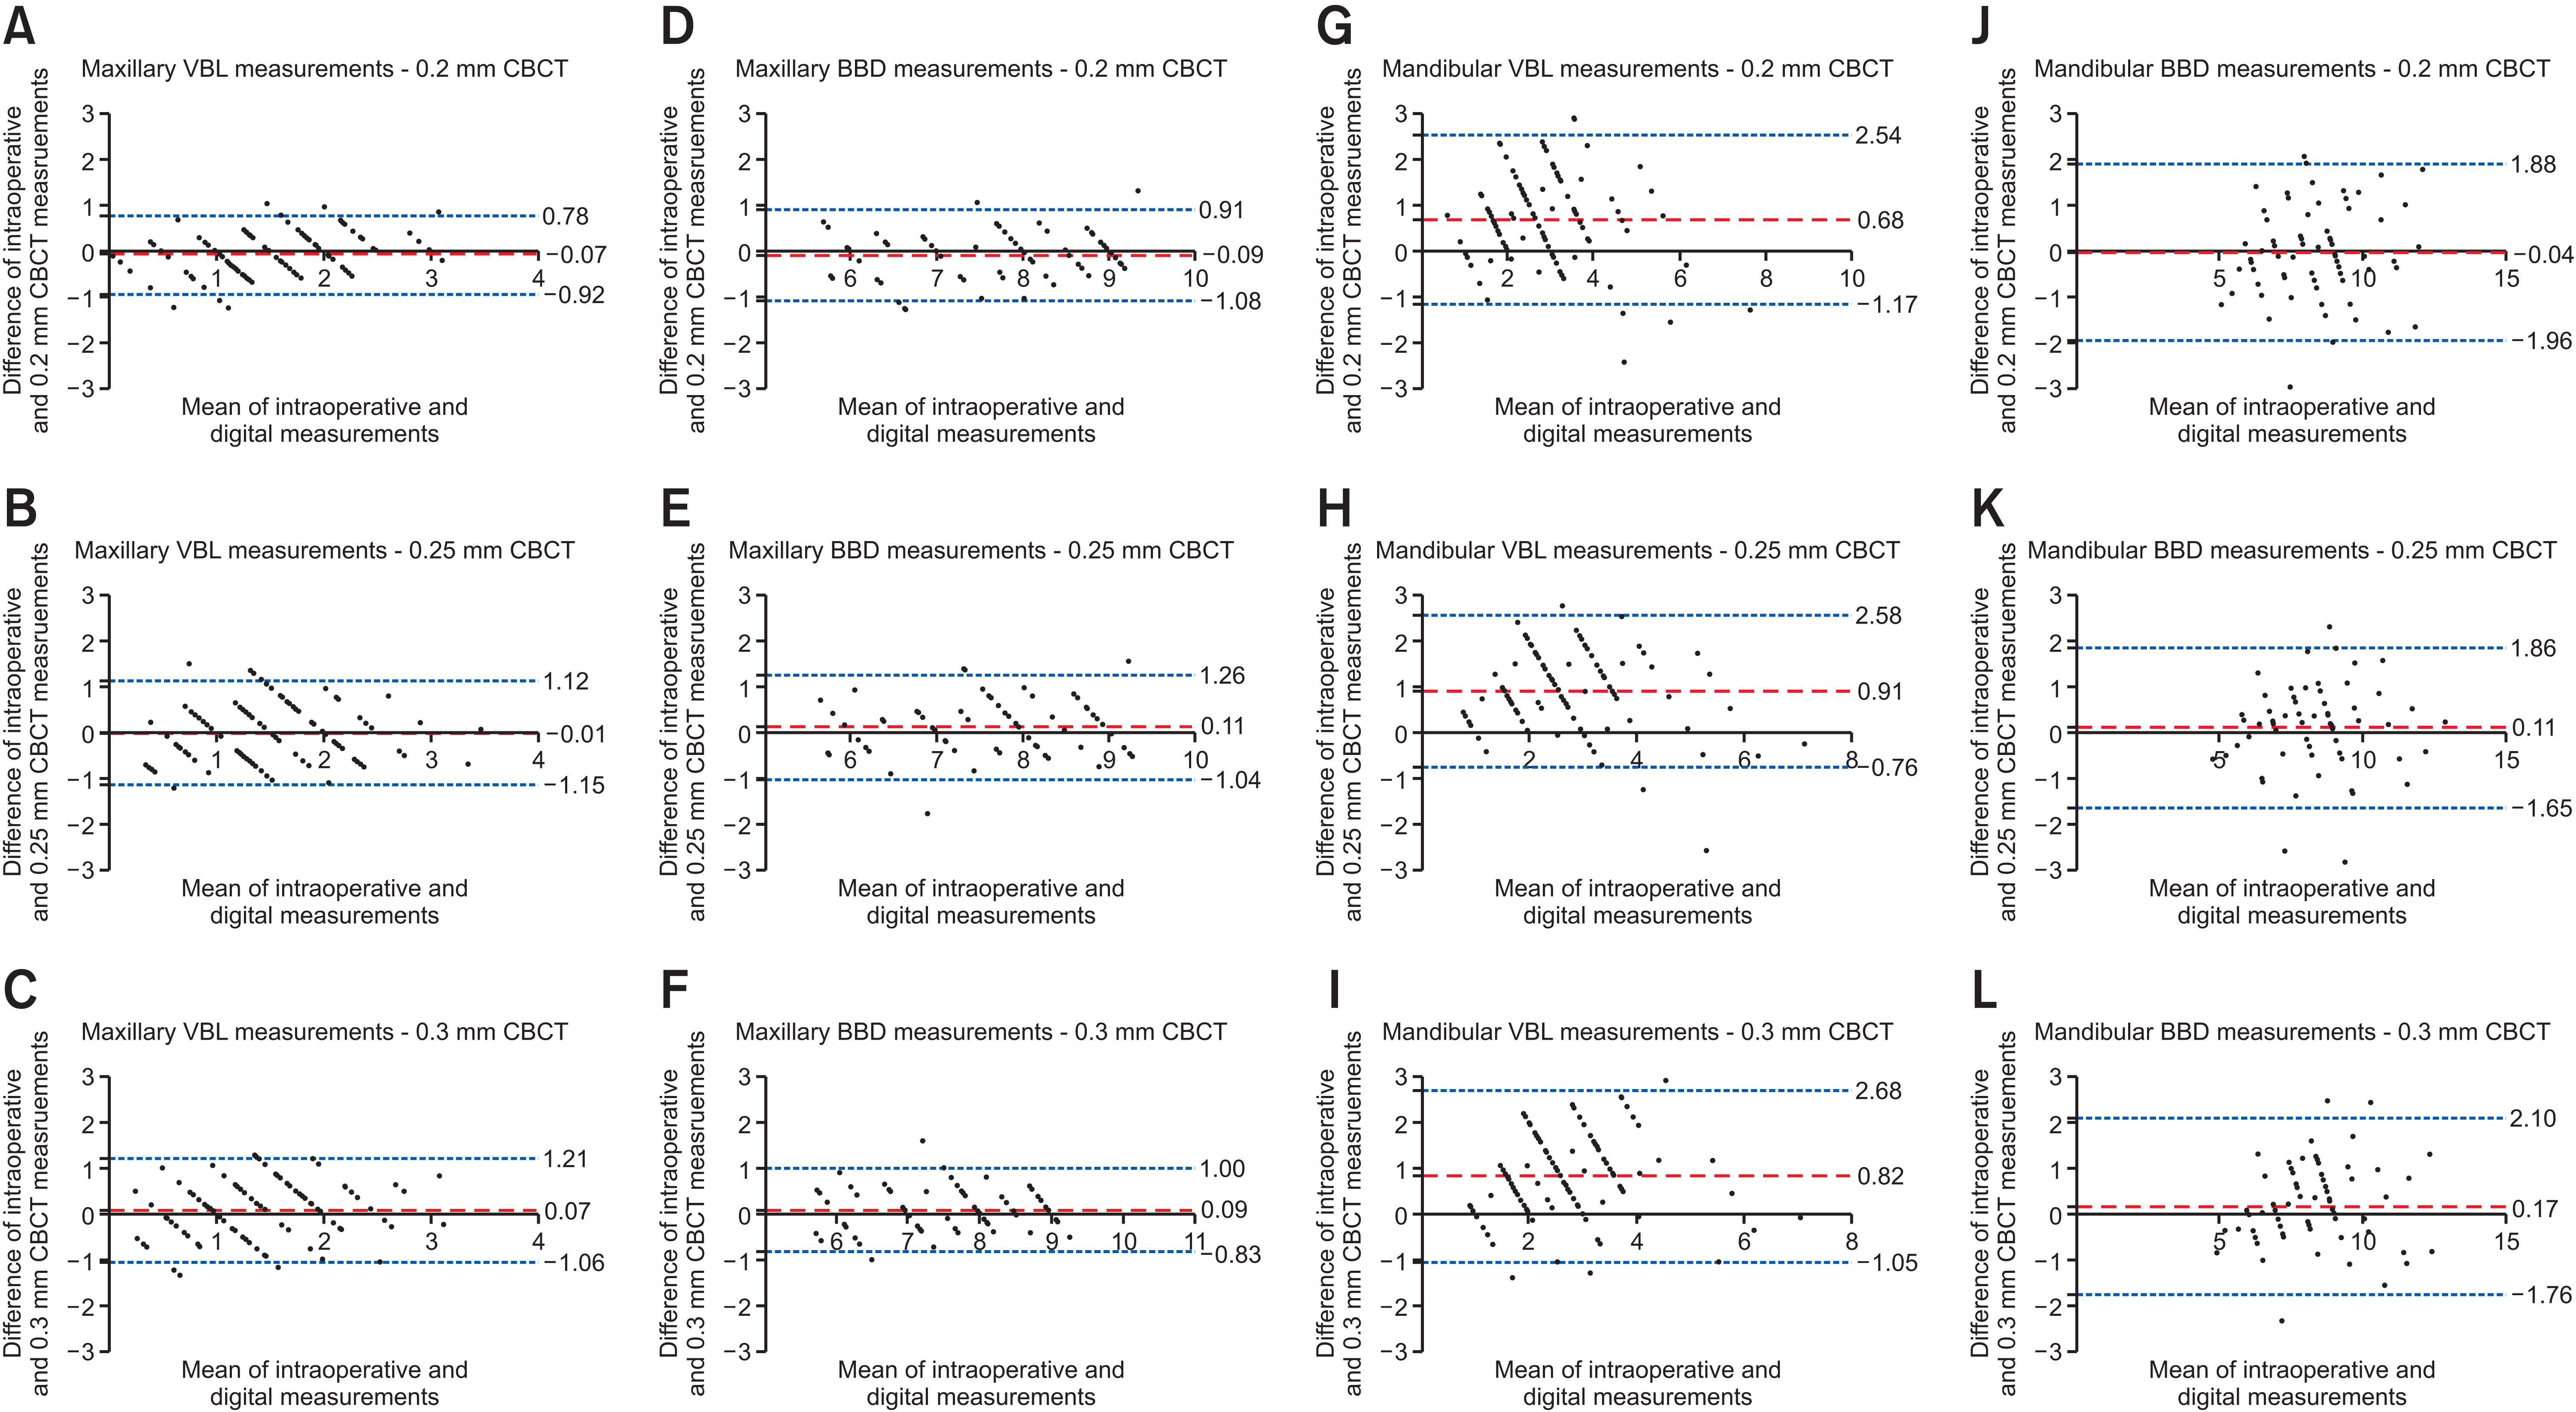
The mean differences and descriptive statistics for the measurements are shown in Tables 3 and 4. The mean differences (and 95% CIs) between the digital and intraoperative measurements for the maxillary anterior teeth were approximately 0; this confirmed no significant differences. Statistically significant mean differences were found in the VBL measurements for the mandibular anterior teeth, regardless of the voxel size (p < 0.01), while the mean differences (and 95% CIs) in the BBD measurements were approximately 0.
The diagnostic coincidence rates for the VBL and BBD values for the maxillary anterior teeth were ≥ 90%. For the mandibular anterior teeth, the diagnostic coincidence rates ranged from 56.66% to 63.33% for the VBL and from 66.67% to 77.78% for the BBD (Tables 3 and 4).
For validation of the different measurements, the differences between the digital and intraoperative measurements were plotted against the average, as recommended in Bland–Altman analysis. The limits of agreement were defined as ± 1.96 × standard deviation and are shown in Figure 6. The limits of agreement for the maxillary anterior teeth showed discrepancies of approximately 2 mm in the measurements. However, high variability was observed in the mandibular measurements, as indicated by the large 95% limits of agreement range of approximately 3.5 mm.
Intraexaminer agreement of linear measurements and PDL area measurements
High intraexaminer agreement was observed for the linear measurements of the digital model. The results showed no significant systematic intraexaminer error (p > 0.05), with high intraexaminer reliability (ICC, 0.985; 95% CI, 0.973–0.991).
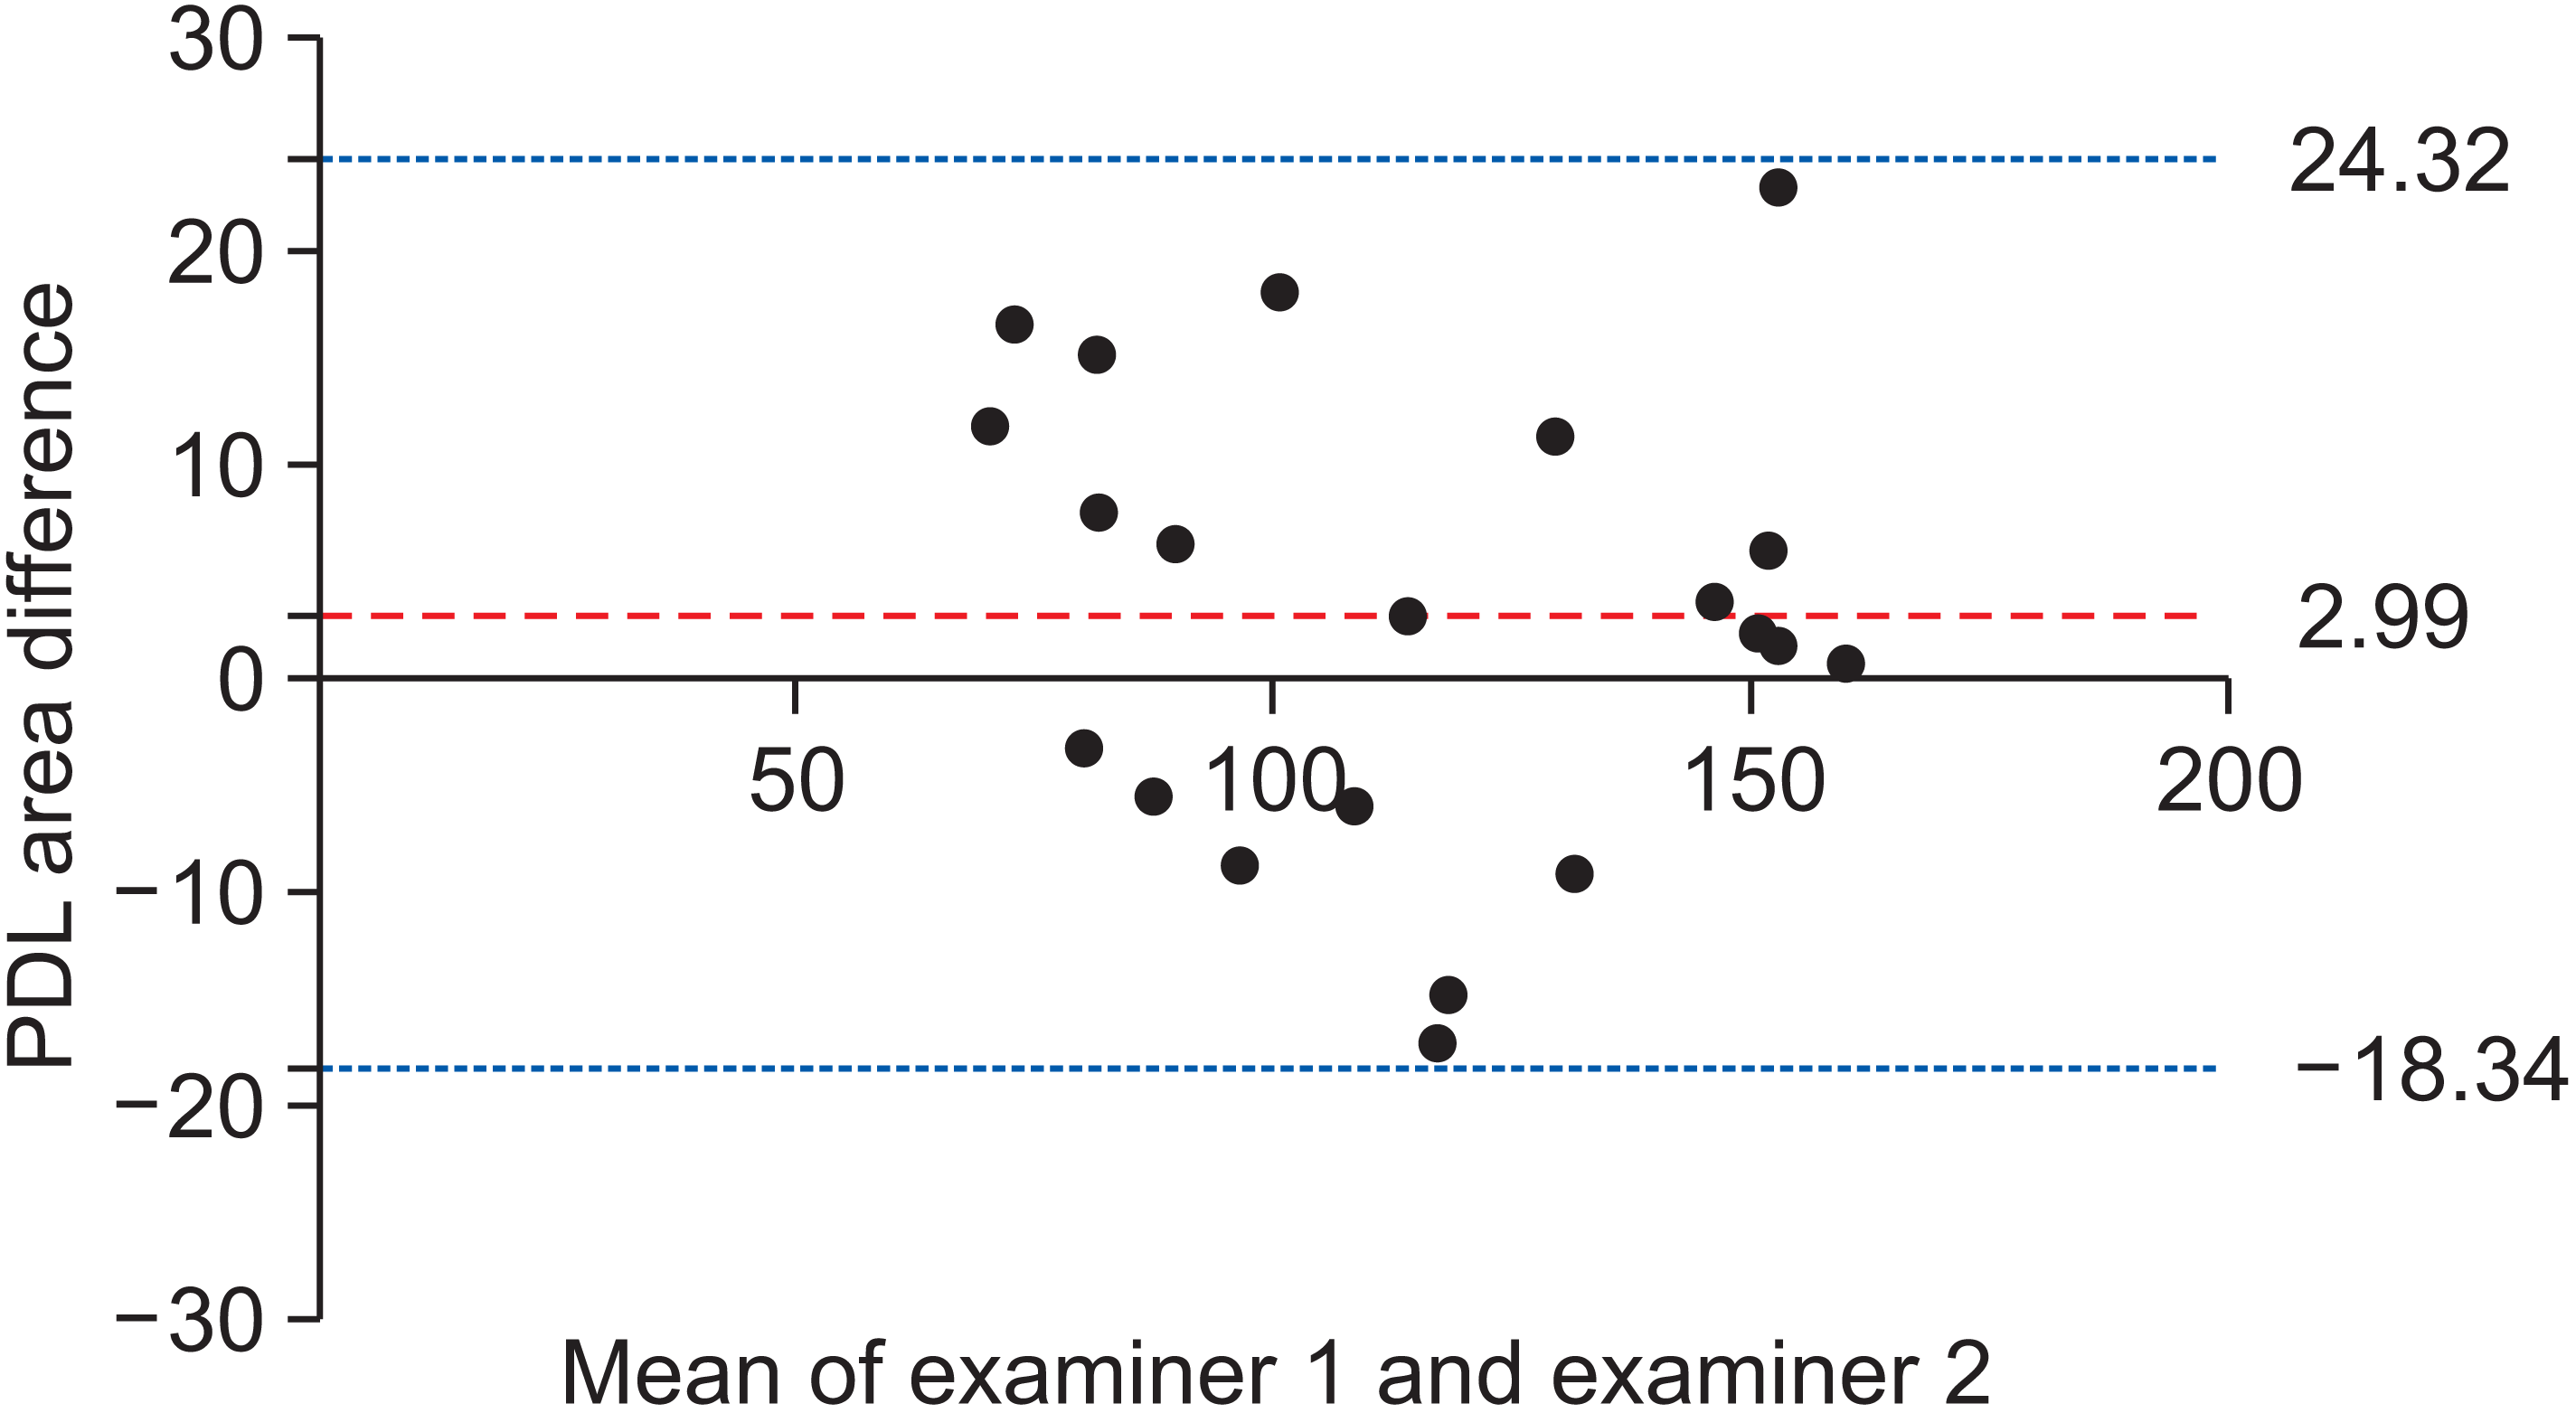
Differences in PDL area measurements between examiners were also analyzed, and the results showed high interexaminer agreement (ICC, 0.947; 95% CI, 0.871–0.979). Moreover, the Bland–Altman analysis showed good consistency between the two examiners in the process of PDL segmentation in the model. The mean bias for the PDL area (mm2) was 2.57, with limits of agreement ranging from −17.89 to 23.03 (Figure 7), indicating good consistency between the two examiners in the process of PDL segmentation.
Establishment of PDL models
Digital models of the PDL of the maxillary and mandibular anterior teeth of the four patients were successfully established. A representative case is shown in Figure 8.
DISCUSSION
Detection and monitoring of alveolar bone loss are important because they provide a hard-tissue index for the presence of periodontal disease and the effects of preventative and corrective therapies for periodontal disease.22,23 In the present study, we introduced an accurate and reproducible method to obtain alveolar bone crest-based digital PDL models using 3D CBCT reconstruction.
The present study suggests that 3D CBCT reconstruction provides relatively accurate information regarding the alveolar bone around the anterior teeth. There were no significant differences among measurements obtained using CBCT voxel resolutions of 0.20, 0.25, and 0.30 mm; this indicates that the method is highly valuable for clinical application. Previous studies have shown that discernment of the PDL space requires CBCT data with a resolution capable of detecting structures less than 0.2 mm in size.22,24 However, data with higher resolution may require higher levels of radiation, which would increase the radiation exposure of patients.25 The present study shows that CBCT with a voxel size of 0.30 mm and relatively little radiation is sufficient to represent the morphology of the alveolar crest, relative to the gold standard. Furthermore, the position of the alveolar crest can be determined, which helps in identification of the coronal margin of the PDL.
Many previous studies have focused on factors influencing the accuracy of CBCT datasets for 3D reconstruction-based measurements26-28 or linear measurements of the alveolar bone, such as the alveolar bone level in the sagittal plane.25,29-31 Some studies have shown that a smaller voxel size is associated with better spatial resolution,26,27 while others have concluded that there is no significant difference between high-resolution and low-resolution CBCT protocols.28,29 A lower resolution also results in higher levels of image noise and influences the accuracy of alveolar bone measurements.30,32 This may explain the divergence in conclusions to some extent. Moreover, various exposure parameters in CBCT may influence the image quality, such as the FOV and presence of metallic restorations.33,34 In the present study, the FOV, voltage, and other conditions were controlled to investigate the effects of the voxel size. In addition, all patients had metal brackets because CBCT was performed during orthodontic treatment, which is a common clinical situation. Although CBCT can provide an accurate 3D view of the tooth roots and alveolar bone, dense intraoral metal brackets can severely compromise the image quality of crowns.35 Therefore, in this study, intraoral optical scans were used to obtain profiles of anterior tooth crowns and surrounding soft tissue in the STL format, thus eliminating the impact of metal artefacts on the crown morphology.
Previous studies have reported that accurate 3D models of entire dentition could be generated with an intraoral scan superimposed over the CBCT images during orthodontic treatment with brackets.36-38 In the present study, the orthodontic brackets were chosen as reference marks for evaluation of the alveolar bone crest. Our results showed that the digital VBL measurements for the mandibular anterior teeth were significantly smaller than the intraoperative VBL measurements, while there were no significant differences in the BBD at any site between the two methods. This indicates that the main source of deviation in the VBL measurements was selection of the CEJ point. The position of the CEJ around the mandibular anterior teeth on the 3D model tends to be gingivally oriented. Previously, Wang et al.39 found that reconstruction of the crown and root still showed a clear CEJ boundary and a smooth area on the surface. The present study, however, indicated that the CEJ may not be an accurate or reproducible anatomical landmark for mandibular anterior teeth using a 3D model. This finding agrees with Kuralt et al.,40 who found that CEJ point selection was the main source of variability in measurements obtained from an intraoral optical scan-derived model. The inaccurate positioning of the CEJ and the difficulty in its identification in the present study may be attributed to the flatter morphology of the mandibular anterior teeth on the labial side and wear of the CEJ.41 Furthermore, in the reconstruction of mandibular anterior tooth models using CBCT datasets, the maximum inaccuracy was mainly found at the cervical margins.42 Therefore, when the CEJ is used as an anatomical landmark for examining the periodontal health status of the mandibular anterior teeth using a 3D model, the possibility of underestimation of the alveolar bone loss severity should be considered.
Because the gold standard in this study was periodontal probe measurements, precision to ±1 mm with a manual periodontal probe was acceptable. The results showed a high diagnostic coincidence rate (> 90%) for the maxilla and a relatively low for the mandible. The Bland–Altman method showed that the limits of agreement were −1 mm to +1 mm for the maxillary anterior teeth; this finding was generally consistent with the results of a previous study.29 However, the broader limits of agreement and the wider span of differences in digital measurements for the mandibular anterior teeth indicate that the mandibular models are less reliable. This could be attributed to the thinner anterior alveolar bone and more vertical bone loss in skeletal Class III patients than in those with Class I patients with normal occlusion,7 as well as the difficulty in obtaining accurate measurements of the boundary of thin alveolar bone using CBCT, even with a 0.125-mm-voxel protocol.29
The present study presents a feasible and noninvasive method for obtaining in vivo PDL measurements from a digital model. Previous studies5,9,10,12,43 have simulated VBL recession in vitro and assumed equal alveolar bone height loss at different sites around teeth, which does not truly reflect clinical periodontal conditions. Some researchers have used dry skulls; however, the lack of soft tissue would likely facilitate the detection of bone surfaces, which has been acknowledged as a serious limitation.30 Researchers have also used intact cadaver heads with soft tissue for their studies; the lack of noise in radiological data, which is normally created by patient movement, probably contributed to the improved results in their studies.29,31,44 Although direct clinical measurements and access have a great advantage, the intraoperative measurements routinely used for research purposes in our facility are not optimal in terms of patient safety during surgery and the duration of the examinations, which should be kept as short as possible; these limitations should not be ignored.
Despite the limitations described above, the present study introduced an accurate and consistent method for obtaining PDL measurements from a reconstructed 3D model, which has important implications for clinical treatment. The 3D morphology of the PDL is a significant prognostic indicator in patients with periodontal disease or those undergoing orthodontic therapy, particularly those with previous periodontal bone loss.
CONCLUSIONS
The present study introduced a method for obtaining PDL measurements from 3D reconstructions of in vivo CBCT scans. The results showed that CBCT with a voxel size of 0.30 mm reliably provided accurate data regarding the alveolar crest morphology around the maxillary anterior teeth. Thus, measurements obtained with this method may facilitate more thorough and comprehensive evaluations of periodontal conditions.
 XML Download