MATERIALS AND METHODS
Patient selection and tissue samples
Tissue microarray construction and immunohistochemistry
Quantitative digital image analysis and manual scoring
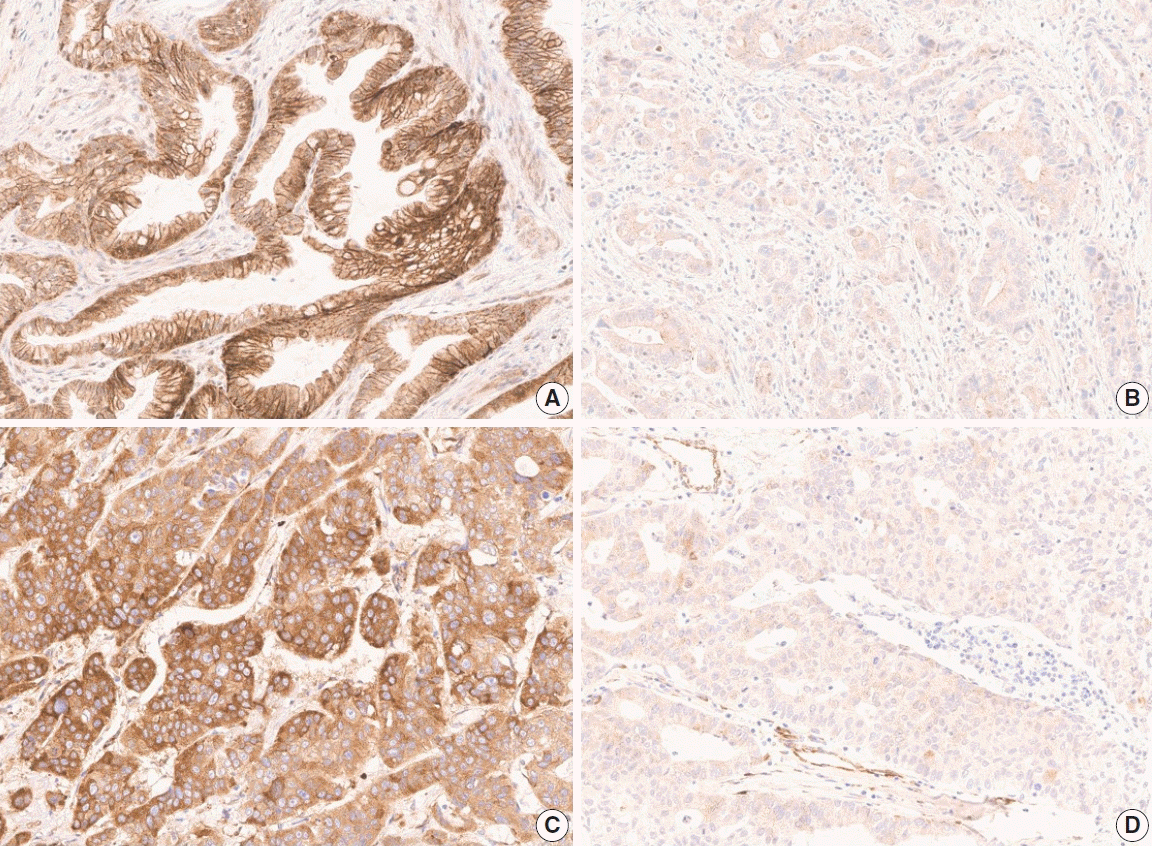
 | Fig. 1.Representative images of expression of anti-DLL4 and anti-VEGF antibodies in gallbladder cancer of each group, according to the Hscore calculated via Aperio ImageScope software. (A) High membranous expression of anti-DLL4 antibody (H-score 208.43). (B) Low membranous expression of anti-DLL4 antibody (H-score 40.28). (C) High cytoplasmic expression of anti-VEGF antibody (H-score 214.01). (D) Low cytoplasmic expression of anti-VEGF antibody (H-score 34.36). DLL4, delta-like ligand 4; VEGF, vascular endothelial growth factor. |
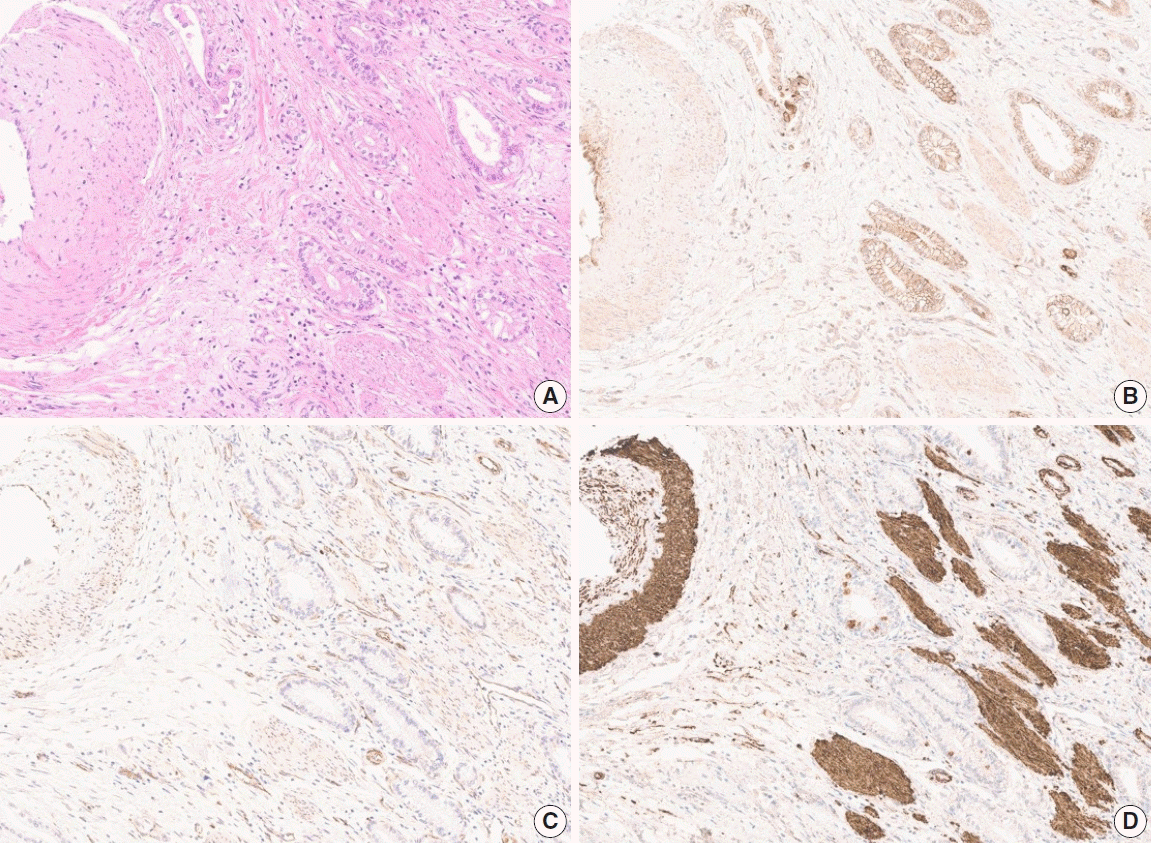
 | Fig. 2.Images of hematoxylin and eosin stain (A) and expression of anti-DLL4 (B), anti-VEGF (C), and anti-HIF2α (D) antibodies in the corresponding area, showing tumor and surrounding soft tissue, including vessel, muscle, and nerve. Expression of anti-HIF2α antibody shows extensive background stain compared to other markers, which led to manual scoring of H-score. Digital image analysis would mistake the background staining and overestimate the H-score of such cases. DLL4, delta-like ligand 4; VEGF, vascular endothelial growth factor; HIF2α, hypoxia-inducible factor-2α. |
Statistical analysis
RESULTS
Clinicopathologic features of the GBC patients
Table 1.
| Total (n=99) |
DLL4 expression |
VEGF expression |
HIF2α expression |
||||||||
|---|---|---|---|---|---|---|---|---|---|---|---|
| Low (n=65, 65.7%) | High (n=34, 34.3%) | p-value | Low (n=56, 56.6%) | High (n=43, 43.4%) | p-value | Low (n=65, 65.7%) | High (n=34, 34.3%) | p-value | |||
| Age (yr) | .654 | .410 | .648 | ||||||||
| ≥ 60 | 67 (67.7) | 43 (64.2) | 24 (35.8) | 36 (53.7) | 31 (46.3) | 45 (67.2) | 22 (32.8) | ||||
| < 60 | 32 (32.3) | 22 (68.8) | 10 (31.3) | 20 (62.5) | 12 (37.5) | 20 (62.5) | 12 (37.5) | ||||
| Sex | .159 | .796 | .023 | ||||||||
| Female | 59 (59.6) | 42 (71.2) | 17 (28.8) | 34 (57.6) | 25 (42.4) | 44 (74.6) | 15 (25.4) | ||||
| Male | 40 (40.4) | 23 (57.5) | 17 (42.5) | 22 (55.0) | 18 (45.0) | 21 (52.5) | 19 (47.5) | ||||
| Diagnosis | NA | NA | NA | ||||||||
| Adenocarcinoma | 81 (81.8) | 48 (59.3) | 33 (40.7) | 51 (63.0) | 30 (37.0) | 52 (64.2) | 29 (35.8) | ||||
| Adenosquamous carcinoma | 8 (8.1) | 7 (87.5) | 1 (12.5) | 2 (25.0) | 6 (75.0) | 6 (75.0) | 2 (25.0) | ||||
| NEC | 5 (5.1) | 5 (100) | 0 | 1 (20.0) | 4 (80.0) | 4 (80.0) | 1 (20.0) | ||||
| Mixed NEC and adenocarcinoma | 1 (1.0) | 1 (100) | 0 | 0 | 1 (100) | 1 (100) | 0 | ||||
| Hepatoid adenocarcinoma | 1 (1.0) | 1 (100) | 0 | 1 (100) | 0 | 1 (100) | 0 | ||||
| Undifferentiated carcinoma | 3 (3.0) | 3 (100) | 0 | 1 (33.3) | 2 (66.7) | 1 (33.3) | 2 (66.7) | ||||
| Differentiationa | .068 | .028 | .006 | ||||||||
| WD, MD | 56 (56.6) | 33 (58.9) | 23 (41.1) | 37 (66.1) | 19 (33.9) | 43 (76.8) | 13 (23.2) | ||||
| PD | 40 (40.4) | 29 (72.5) | 11 (27.5) | 18 (45.0) | 22 (55.0) | 21 (52.5) | 19 (47.5) | ||||
| UD | 3 (3.0) | 3 (100) | 0 | 1 (33.3) | 2 (66.7) | 1 (33.3) | 2 (66.7) | ||||
| T categorya | .827 | .792 | .827 | ||||||||
| 1b, 2a, 2b | 5 (5.1) | 1 (20.0) | 4 (80.0) | 3 (60.0) | 2 (40.0) | 4 (80.0) | 1 (20.0) | ||||
| 3 | 88 (88.9) | 62 (70.5) | 26 (29.5) | 49 (55.7) | 39 (44.3) | 56 (63.6) | 32 (36.4) | ||||
| 4 | 6 (6.1) | 2 (33.3) | 4 (66.7) | 4 (66.7) | 2 (33.3) | 5 (83.3) | 1 (16.7) | ||||
| N category | .047 | .047 | .872 | ||||||||
| N0 | 31 (31.3) | 16 (51.6) | 15 (48.4) | 13 (41.9) | 18 (58.1) | 20 (64.5) | 11 (35.5) | ||||
| N1, N2 | 68 (68.7) | 49 (72.1) | 19 (27.9) | 43 (63.2) | 25 (36.8) | 45 (66.2) | 23 (33.8) | ||||
| M category | .410 | .616 | .410 | ||||||||
| M0 | 88 (88.9) | 59 (67.0) | 29 (33.0) | 49 (55.7) | 39 (44.3) | 59 (67.0) | 29 (33.0) | ||||
| M1 | 11 (11.1) | 6 (54.5) | 5 (45.5) | 7 (63.6) | 4 (36.4) | 6 (54.5) | 5 (45.5) | ||||
| AJCC stage | .112 | .155 | .772 | ||||||||
| I–III | 71 (71.7) | 50 (70.4) | 21 (29.6) | 37 (52.1) | 34 (47.9) | 46 (64.8) | 25 (35.2) | ||||
| IV | 28 (28.3) | 15(53.6) | 13 (46.4) | 19 (67.9) | 9 (32.1) | 19 (67.9) | 9 (32.1) | ||||
| Recurrence | .610 | .690 | .174 | ||||||||
| Yes | 46 (46.5) | 29 (63.0) | 17 (37.0) | 27 (58.7) | 19 (41.3) | 27 (58.7) | 19 (41.3) | ||||
| No | 53 (53.5) | 36 (67.9) | 17 (32.1) | 29 (54.7) | 24 (45.3) | 38 (71.7) | 15 (28.3) | ||||
| Death | .873 | .789 | .549 | ||||||||
| Yes | 63 (63.6) | 41 (65.1) | 22 (34.9) | 35 (55.6) | 28 (44.4) | 40 (63.5) | 23 (36.5) | ||||
| No | 36 (36.4) | 24 (66.7) | 12 (33.3) | 21 (58.3) | 15 (41.7) | 25 (69.4) | 11 (30.6) | ||||
| DLL4 expression | .340 | .054 | |||||||||
| Low | 65 (65.7) | 39 (60.0) | 26 (40.0) | 47 (72.3) | 18 (27.7) | ||||||
| High | 34 (34.3) | 17 (50.0) | 17 (50.0) | 18 (52.9) | 16 (47.1) | ||||||
| VEGF expression | .340 | <.001 | |||||||||
| Low | 56 (56.6) | 39 (69.6) | 17 (30.4) | 49 (87.5) | 7 (12.5) | ||||||
| High | 43 (43.4) | 26 (60.5) | 17 (39.5) | 16 (37.2) | 27 (62.8) | ||||||
| HIF2α expression | .054 | < .001 | |||||||||
| Low | 34 (34.3) | 47 (72.3) | 18 (27.7) | 49 (75.4) | 16 (24.6) | ||||||
| High | 65 (65.7) | 18 (52.9) | 16 (47.1) | 7 (20.6) | 27 (79.4) | ||||||
Values are presented as number (%).
DLL4, delta-like ligand 4; VEGF, vascular endothelial growth factor; HIF2α, hypoxia-inducible factor-2α; NEC, neuroendocrine carcinoma; WD, well differentiated; MD, moderately differentiated; PD, poorly differentiated; UD, undifferentiated; AJCC, American Joint Committee on Cancer.
Expression of DLL4, VEGF, and HIF2α
 | Fig. 4.The correlation matrix visualizing the correlation between the expression levels of DLL4, VEGF, and HIF2α (A). The Spearman correlation coefficients are recorded in the center of each box. The scatter plot showing the positive correlation between VEGF and HIF2α (B). DLL4, delta-like ligand 4; VEGF, vascular endothelial growth factor; HIF2α, hypoxia-inducible factor-2α. |


 PDF
PDF Citation
 Print
Print


 XML Download