INTRODUCTION
METHODS
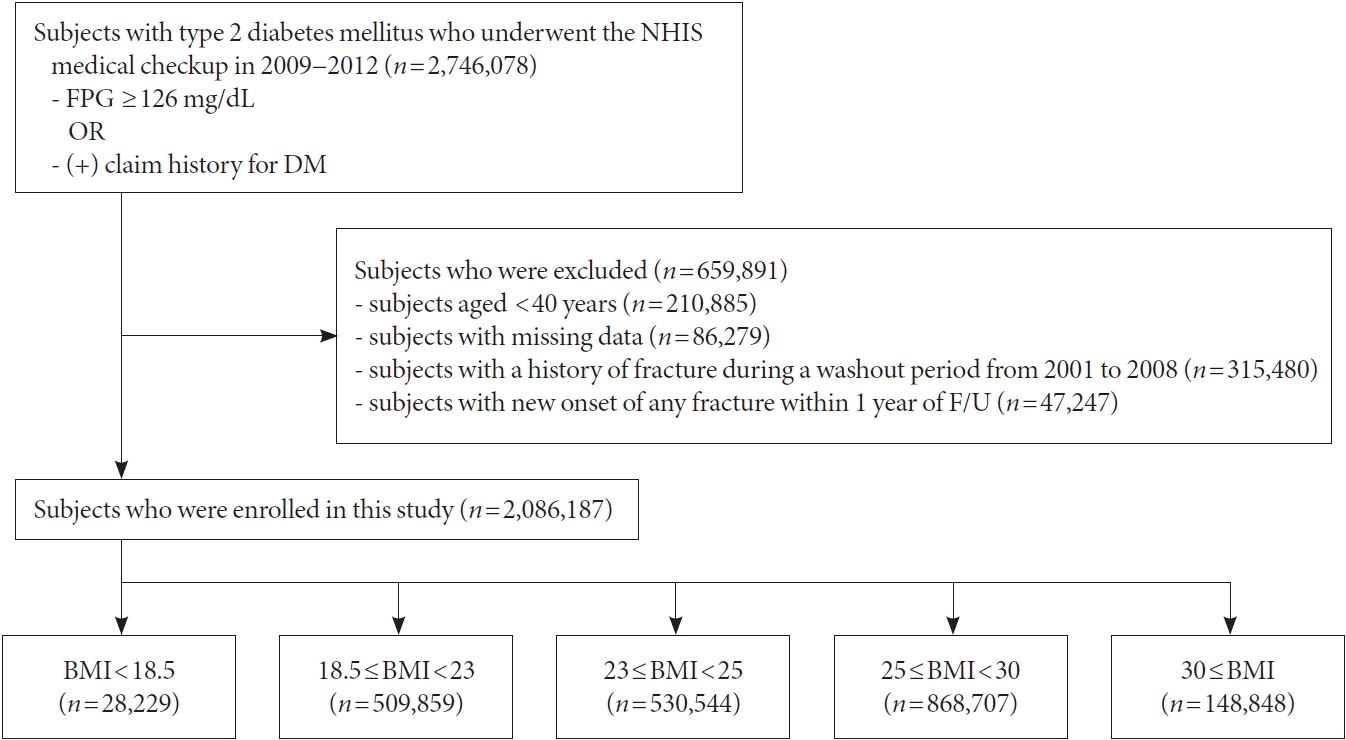
Data source and study population
Data collection
Fracture identification depending on the skeletal lesions
Statistical analysis
RESULTS
Characteristics of each group related to the prevalence of obesity and T2DM
Table 1.
| Characteristic | BMI <18.5 kg/m2 | 18.5≤ BMI <23 kg/m2 | 23≤ BMI <25 kg/m2 | 25≤ BMI <30 kg/m2 | 30 kg/m2 ≤BMI | P value |
|---|---|---|---|---|---|---|
| Number | 28,229 | 509,859 | 530,544 | 868,707 | 148,848 | |
| Age, yr | 62.09±12.3 | 59.67±10.78 | 59.01±10.23 | 58.03±10.2 | 55.96±10.37 | <0.0001 |
| 40–64 | 16,058 (56.88) | 338,673 (66.42) | 368,290 (69.42) | 629,148 (72.42) | 115,704 (77.73) | <0.0001 |
| ≥65 | 12,171 (43.12) | 171,186 (33.58) | 162,254 (30.58) | 239,559 (27.58) | 33,144 (22.27) | |
| Male sex | 17,210 (60.97) | 304,295 (59.68) | 334,282 (63.01) | 531,476 (61.18) | 67,657 (45.45) | <0.0001 |
| BMI, kg/m² | 17.45±0.93 | 21.43±1.13 | 23.97±0.57 | 26.89±1.33 | 32.17±6.09 | <0.0001 |
| Height, cm | 161.23±8.99 | 161.9±8.68 | 162.55±8.78 | 162.51±9.05 | 160.73±9.67 | <0.0001 |
| Body weight, kg | 45.51±5.67 | 56.34±6.79 | 63.54±7.01 | 71.21±8.55 | 83.28±11.07 | <0.0001 |
| Waist circumference, cm | 70.19±7.61 | 78.15±6.27 | 83.54±5.98 | 89.2±6.24 | 98.45±7.83 | <0.0001 |
| Low income | 7,639 (27.06) | 122,502 (24.03) | 121,345 (22.87) | 197,752 (22.76) | 36,280 (24.37) | <0.0001 |
| Current smoker | 9,820 (34.79) | 139,604 (27.38) | 130,901 (24.67) | 197,042 (22.68) | 28,173 (18.93) | <0.0001 |
| Heavy drinker | 2,600 (9.21) | 45,316 (8.89) | 49,937 (9.41) | 89,985 (10.36) | 13,616 (9.15) | <0.0001 |
| Physical activity | 4,639 (16.43) | 112,193 (22) | 121,503 (22.9) | 186,105 (21.42) | 25,595 (17.2) | <0.0001 |
| Hypertension | 11,423 (40.47) | 244,545 (47.96) | 295,440 (55.69) | 556,031 (64.01) | 111,842 (75.14) | <0.0001 |
| Dyslipidemia | 6,688 (23.69) | 182,595 (35.81) | 224,006 (42.22) | 405,561 (46.69) | 77,205 (51.87) | <0.0001 |
| Cancer | 1,194 (4.23) | 14,623 (2.87) | 12,135 (2.29) | 17,799 (2.05) | 2,871 (1.93) | <0.0001 |
| Chronic kidney disease | 3,445 (12.2) | 57,084 (11.2) | 60,285 (11.36) | 101,953 (11.74) | 18,230 (12.25) | <0.0001 |
| Cardiovascular disease | 2,728 (9.66) | 53,985 (10.59) | 62,772 (11.83) | 111,034 (12.78) | 20,882 (14.03) | <0.0001 |
| Insulin use | 4,421 (15.66) | 56,338 (11.05) | 47,772 (9) | 70,239 (8.09) | 12,141 (8.16) | <0.0001 |
| Use of three or more oral hypoglycemic agents | 4,700 (16.65) | 84,861 (16.64) | 80,695 (15.21) | 123,495 (14.22) | 22,173 (14.9) | <0.0001 |
| Duration of DM ≥5 years | 9,205 (32.61) | 183,415 (35.97) | 176,795 (33.32) | 252,666 (29.09) | 38,126 (25.61) | <0.0001 |
| Systolic BP, mm Hg | 122.99±17.6 | 126.35±16.19 | 128.63±15.59 | 130.7±15.42 | 133.61±15.92 | <0.0001 |
| Diastolic BP, mm Hg | 75.62±10.95 | 77.08±10.19 | 78.58±10.01 | 80.19±10.1 | 82.36±10.54 | <0.0001 |
| Fasting glucose, mg/dL | 153.75±67.6 | 146.7±51.7 | 144.2±45.82 | 142.98±42.78 | 143.4±42.73 | <0.0001 |
| Total cholesterol | 184.72±45.72 | 192.44±44.79 | 196.34±46.67 | 198.8±46.32 | 201.05±45.57 | <0.0001 |
| HDL-cholesterol, mg/dL | 59.06±30.67 | 54.6±30.55 | 51.9±26.64 | 50.8±29.38 | 50.8±27.76 | <0.0001 |
| LDL-cholesterol, mg/dL | 103.47±76.46 | 110.79±76.82 | 112.93±75.88 | 113.55±79.32 | 114.96±78.4 | <0.0001 |
| Triglyceride, mg/dLa | 103.04 (102.38–103.71) | 124.31 (124.11–124.5) | 144.28 (144.07–144.5) | 158.7 (158.52–158.89) | 164.75 (164.31–165.19) | <0.0001 |
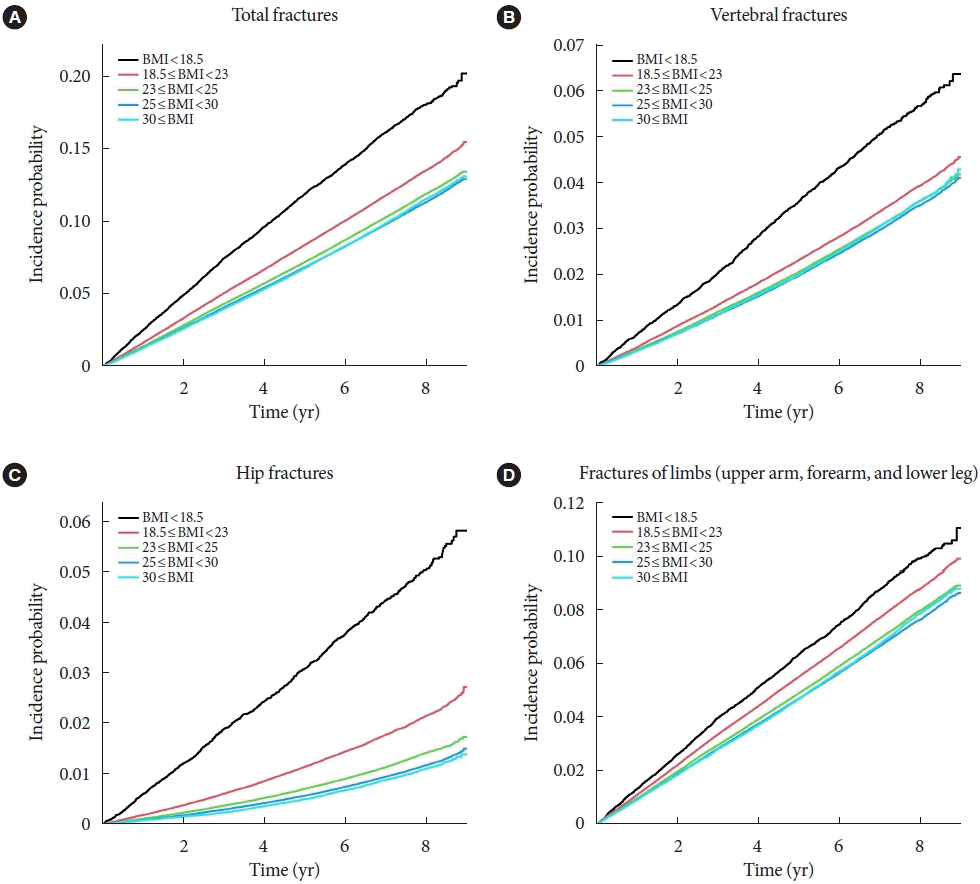
Associations of BMI with fracture risk
Fig. 2.

Table 2.
Model 1: unadjusted; Model 2: adjusted for age, sex, smoke, drink, regular exercise; Model 3, adjusted for model 2 plus hypertension, dyslipidemia, chronic kidney disease, insulin use, duration of diabetes mellitus ≥5 years, use of three or more oral hypoglycemic agents, fasting glucose level, and height.
BMI, body mass index; IR, incidence rate; HR, hazard ratio; CI, confidence interval.
Subgroup analyses and the fracture risk according to BMI by age and sex
Table 3.
Adjusted for age, sex, smoke, drink, regular exercise, hypertension, dyslipidemia, chronic kidney disease, insulin use, duration of diabetes mellitus ≥5 years, combinations ≥3 classes of oral antidiabetic agent, fasting glucose level, and height.
BMI, body mass index; IR, incidence rate; HR, hazard ratio.


 PDF
PDF Citation
 Print
Print


 XML Download