INTRODUCTION
METHODS
Adenovirus overexpression
Animal model
Detection of blood glucose level
Cell culture and transfection
RNA stability assay
MTT assay
Enzyme-linked immunosorbent assay
Oxidative stress detections
Apoptosis analysis
Immunohistochemistry
Immunofluorescence staining
TUNEL assay
Hematoxylin and eosin (H&E) staining
RT-qPCR
Table 1.
Western blot
RNA immunoprecipitation
RNA pull-down assay
Statistical analysis
RESULTS
METTL3 and TUG1 were downregulated in diabetic mice
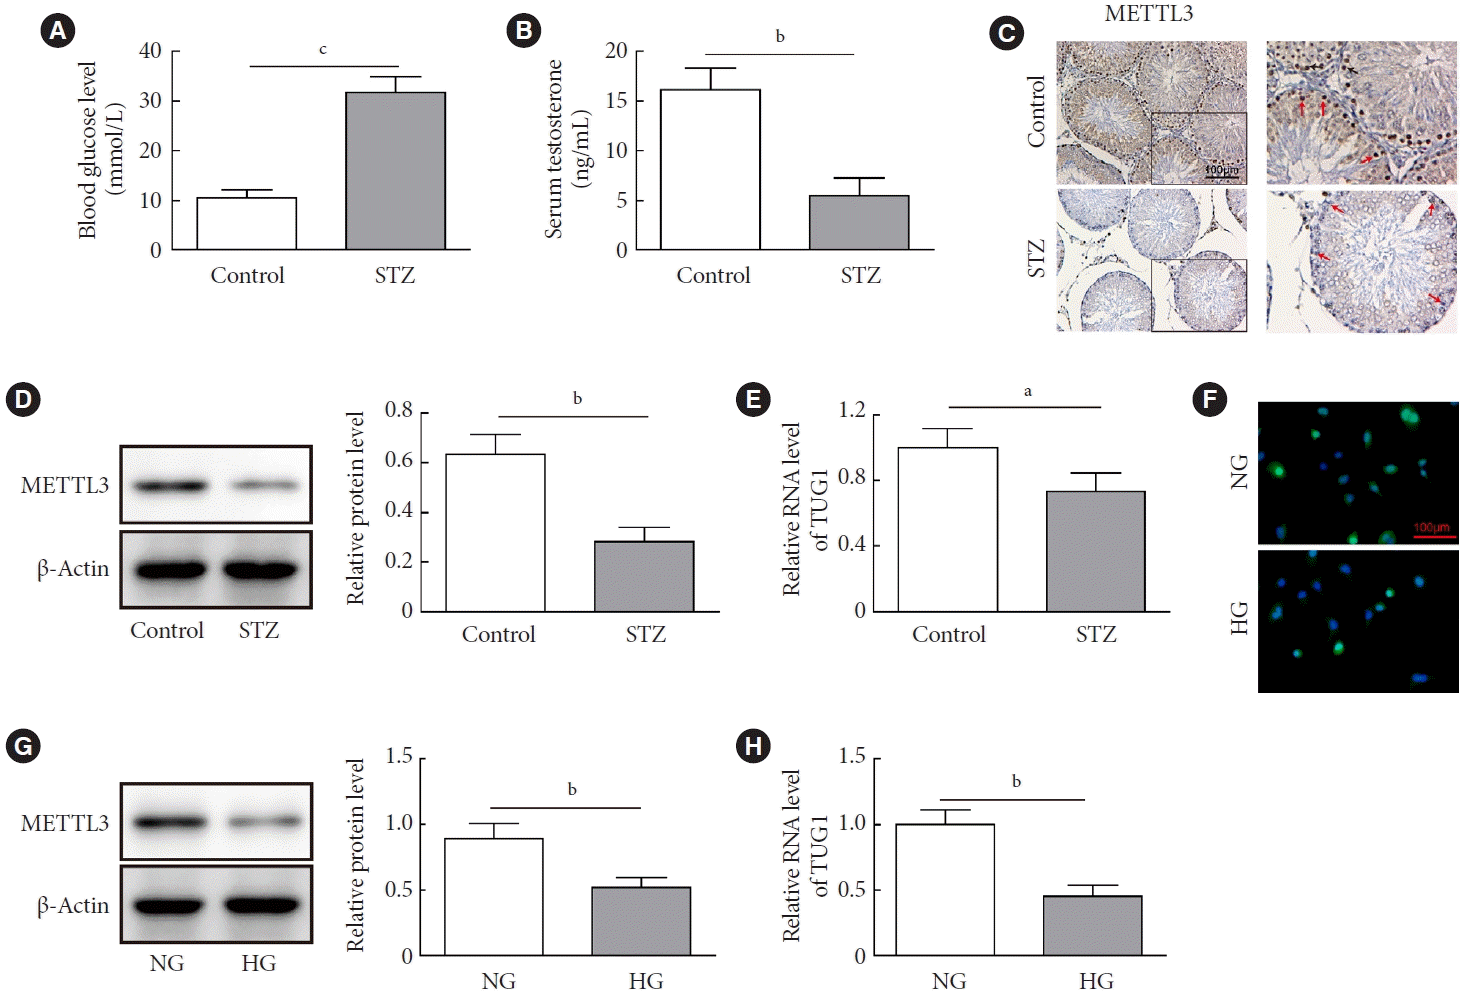 | Fig. 1.Expressions of methyltransferase like-3 (METTL3) and taurine up-regulated 1 (TUG1) in diabetic mice. (A-D) C57BL/6 mice (n=10 per group) were injected with streptozocin (STZ) at a dosage of 45 mg/kg body weight for 5 days (the STZ group) or normal saline (the control group). (A) The blood glucose levels of STZ-treated mice and control mice were measured using a glucometer. (B) The serum level of testosterone was determined by enzyme-linked immunosorbent assay (ELISA). The testicular expression of METTL3 in mice was measured by (C) immunohistochemistry staining and (D) Western blot. (E) The expression of TUG1 was determined by real-time quantitative polymerase chain reaction (RT-qPCR). (F-H) Mouse spermatogenic GC-1 spg cells were cultured in Dulbecco’s Modified Eagle Medium (DMEM) supplemented with 30 mmol/L of glucose for 24 hours. The expression of METTL3 was determined by (F) immunofluorescence staining and (G) Western blot. (H) The expression of TUG1 was determined by RT-qPCR. NG, normal glucose; HG, high glucose. aP<0.05, bP<0.01, cP<0.001. |
METTL3 overexpression increased viability but reduced apoptosis of HG-treated GC-1 spg cells
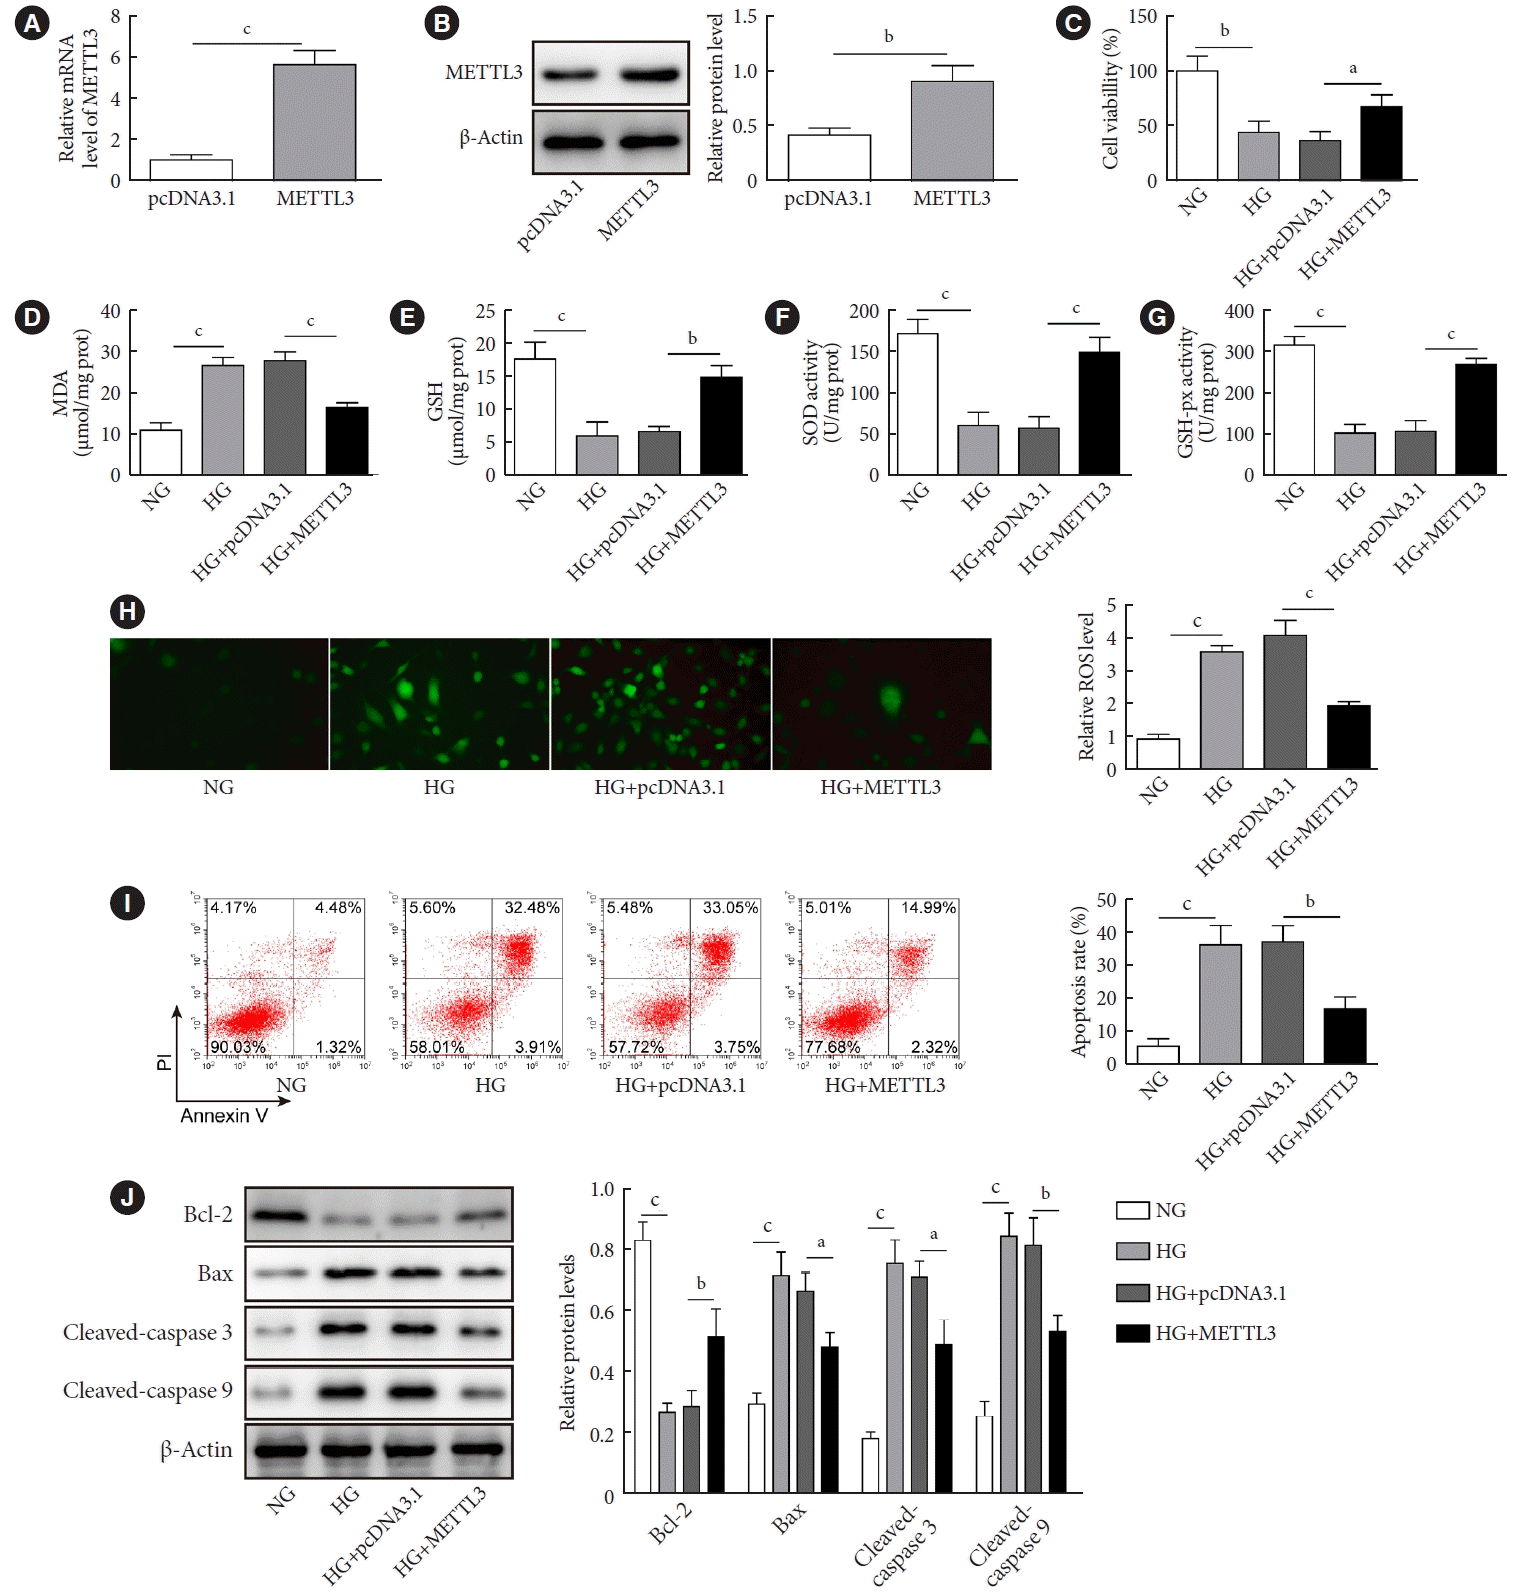 | Fig. 2.Effects of methyltransferase like-3 (METTL3) overexpression on the viability and apoptosis of GC-1 spg cells induced by high glucose. Mouse GC-1 spg cells were transfected with or without vectors overexpressing METTL3 or empty control vectors (pcDNA3.1), then cells were cultured in high glucose (HG) medium (30 mmol/L) for 24 hours. The expression of METTL3 in GC-1 spg cells was measured by (A) real-time quantitative polymerase chain reaction and (B) Western blot. (C) Cell viability was evaluated by the MTT assay. (D-H) The levels of malondialdehyde (MDA) and glutathione (GSH) and the activities of superoxide dismutase (SOD) and glutathione peroxidase (GSH-Px) in GC-1 spg cells treated with or without HG were measured by commercial kits. (H) The level of reactive oxygen species (ROS) was detected using the 2ʹ,7ʹ-dichlorodihydro-fluorescin diacetate (DCFH-AD) probe. (I) Cell apoptosis was determined by flow cytometry. (J) The expressions of Bcl-2, Bax, cleaved caspase-3, and cleaved caspase-9 were quantified by Western blot. NG, normal glucose. aP<0.05, bP<0.01, cP<0.001. |
METTL3-mediated m6A modification increased the stability of TUG1
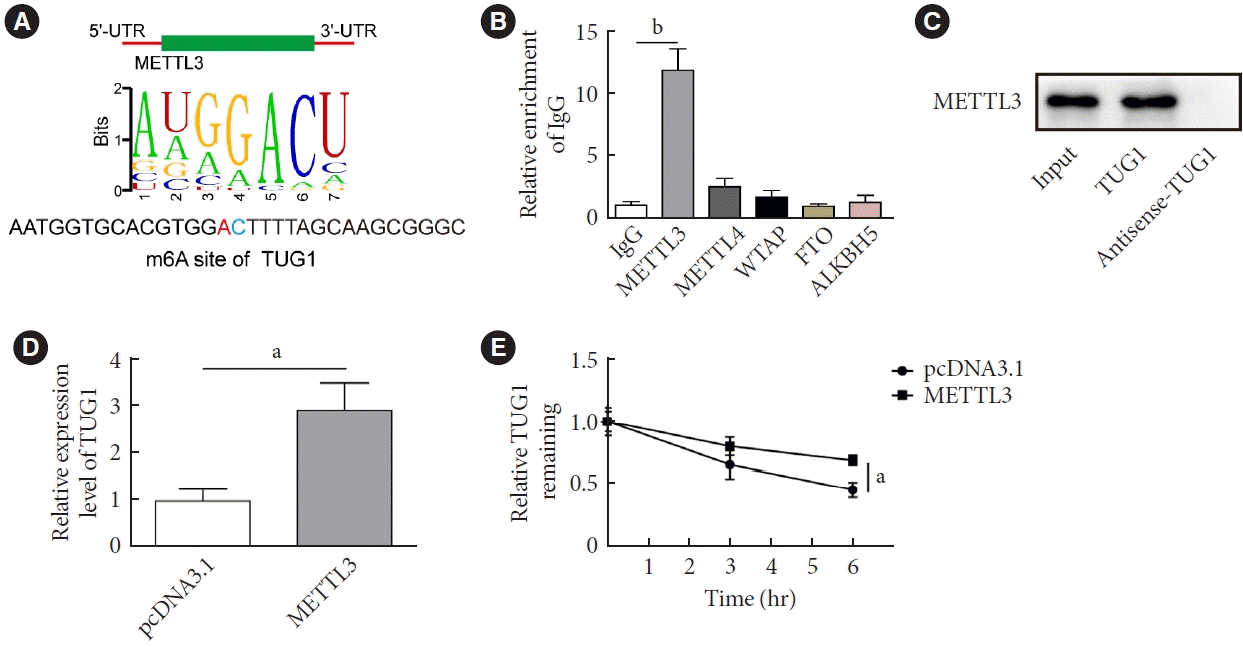 | Fig. 3.Methyltransferase like-3 (METTL3)-mediated N6-methyladenosine (m6A) modification increased the stability of taurine up-regulated 1 (TUG1) in high glucose (HG)-induced GC-1 spg cells. (A) The m6A site in TUG1 was predicted by RMVar (http://rmvar.renlab.org/). (B) RNA immunoprecipitation (RIP) was performed to verify the enrichment of TUG1 by METTL3. (C) RNA pull-down was used to validate the binding between METTL3 and TUG1. (D, E) GC-1 spg cells were transfected with vectors overexpressing METTL3 or control vectors. (D) The expression of TUG1 was measured by real-time quantitative polymerase chain reaction. (E) The half-life of TUG1 was determined by RNA stability assay. UTR, untranslated region; IgG, immunoglobulin G; WTAP, wilms tumor 1-associated protein; FTO, fat mass and obesity-associated protein; ALKBH5, alkB homolog 5. aP<0.01, bP<0.001. |
TUG1 increased the stability of clusterin mRNA by interacting with SRSF1
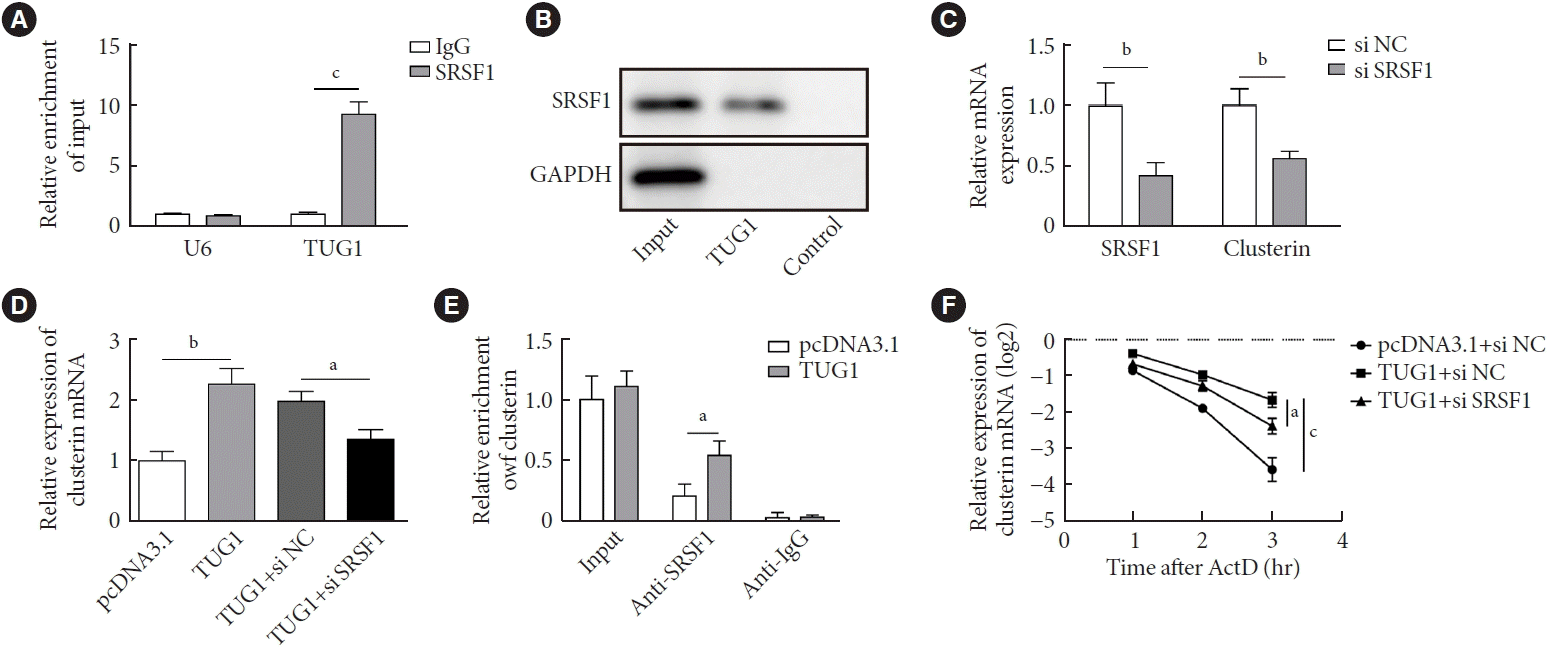 | Fig. 4.Taurine up-regulated 1 (TUG1) increased the stability of clusterin mRNA by interacting with serine and arginine rich splicing factor 1 (SRSF1). (A) RNA immunoprecipitation (RIP) was performed to verify the enrichment of TUG1 by SRSF1. (B) RNA pull-down assay was used to validate the binding between SRSF1 and TUG1. (C) GC-1 spg cells were transfected with small interfering RNA (siRNA) targeting SRSF1 or scrambled control sequence (si NC). The expression of SRSF1 and clusterin were measured by real-time quantitative polymerase chain reaction (RT-qPCR). (D) GC-1 spg cells were transfected with vectors overexpressing TUG1 and siRNA targeting SRSF1 (or si NC). The expression of clusterin was measured by RT-qPCR. (E) GC-1 spg cells were transfected with vectors overexpressing TUG1 or control vectors. RIP was performed to verify the enrichment of clusterin by SRSF1. (F) The half-life of clusterin was determined by RNA stability assay. IgG, immunoglobulin G; GAPDH, glyceraldehyde-3-phosphate dehydrogenase; ActD, actinomycin D. aP<0.05, bP<0.01, cP<0.001. |
TUG1/clusterin axis was involved in the regulation of HG-stimulated GC-1 spg cells by METTL3
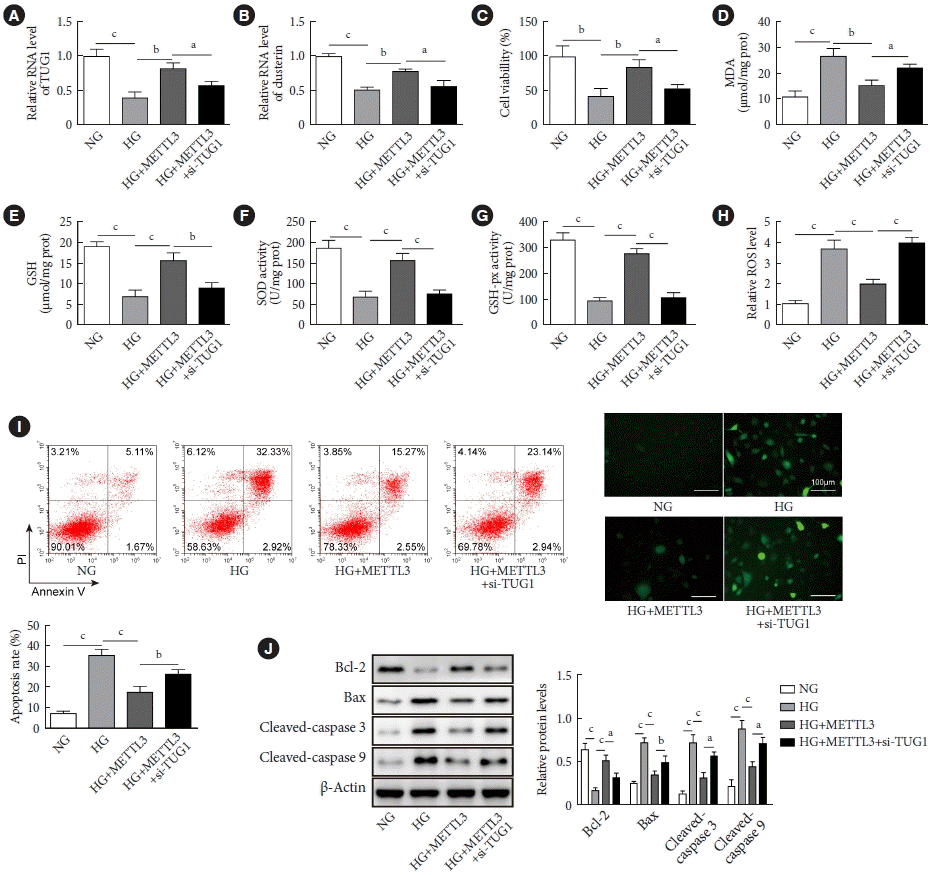 | Fig. 5.Methyltransferase like-3 (METTL3) regulated the viability and apoptosis of high glucose (HG)-induced GC-1 spg cells via taurine up-regulated 1 (TUG1). GC-1 spg cells were co-transfected with pcDNA3.1-METTL3 vector and si TUG1 for 48 hours. Then, cells were exposed to HG conditions for 24 hours. (A, B) The RNA expressions of TUG1 and clustern were verified by real-time quantitative polymerase chain reaction. (C) Cell viability was evaluated by the MTT assay. (D, E, F, G) The levels of malondialdehyde (MDA) and glutathione (GSH) and the activities of superoxide dismutase (SOD) and glutathione peroxidase (GSH-Px) in GC-1 spg cells treated with or without HG were measured by commercial kits. (H) The level of reactive oxygen species (ROS) was detected using the 2ʹ,7ʹ-dichlorodihydro-fluorescin diacetate (DCFH-AD) probe. (I) Cell apoptosis was assessed by flow cytometry. (J) The expressions of Bcl-2, Bax, cleaved caspase-3, and cleaved caspase-9 were quantified by Western blot. NG, normal glucose. aP<0.05, bP<0.01, cP<0.001. |
METTL3 alleviated DITD in vivo
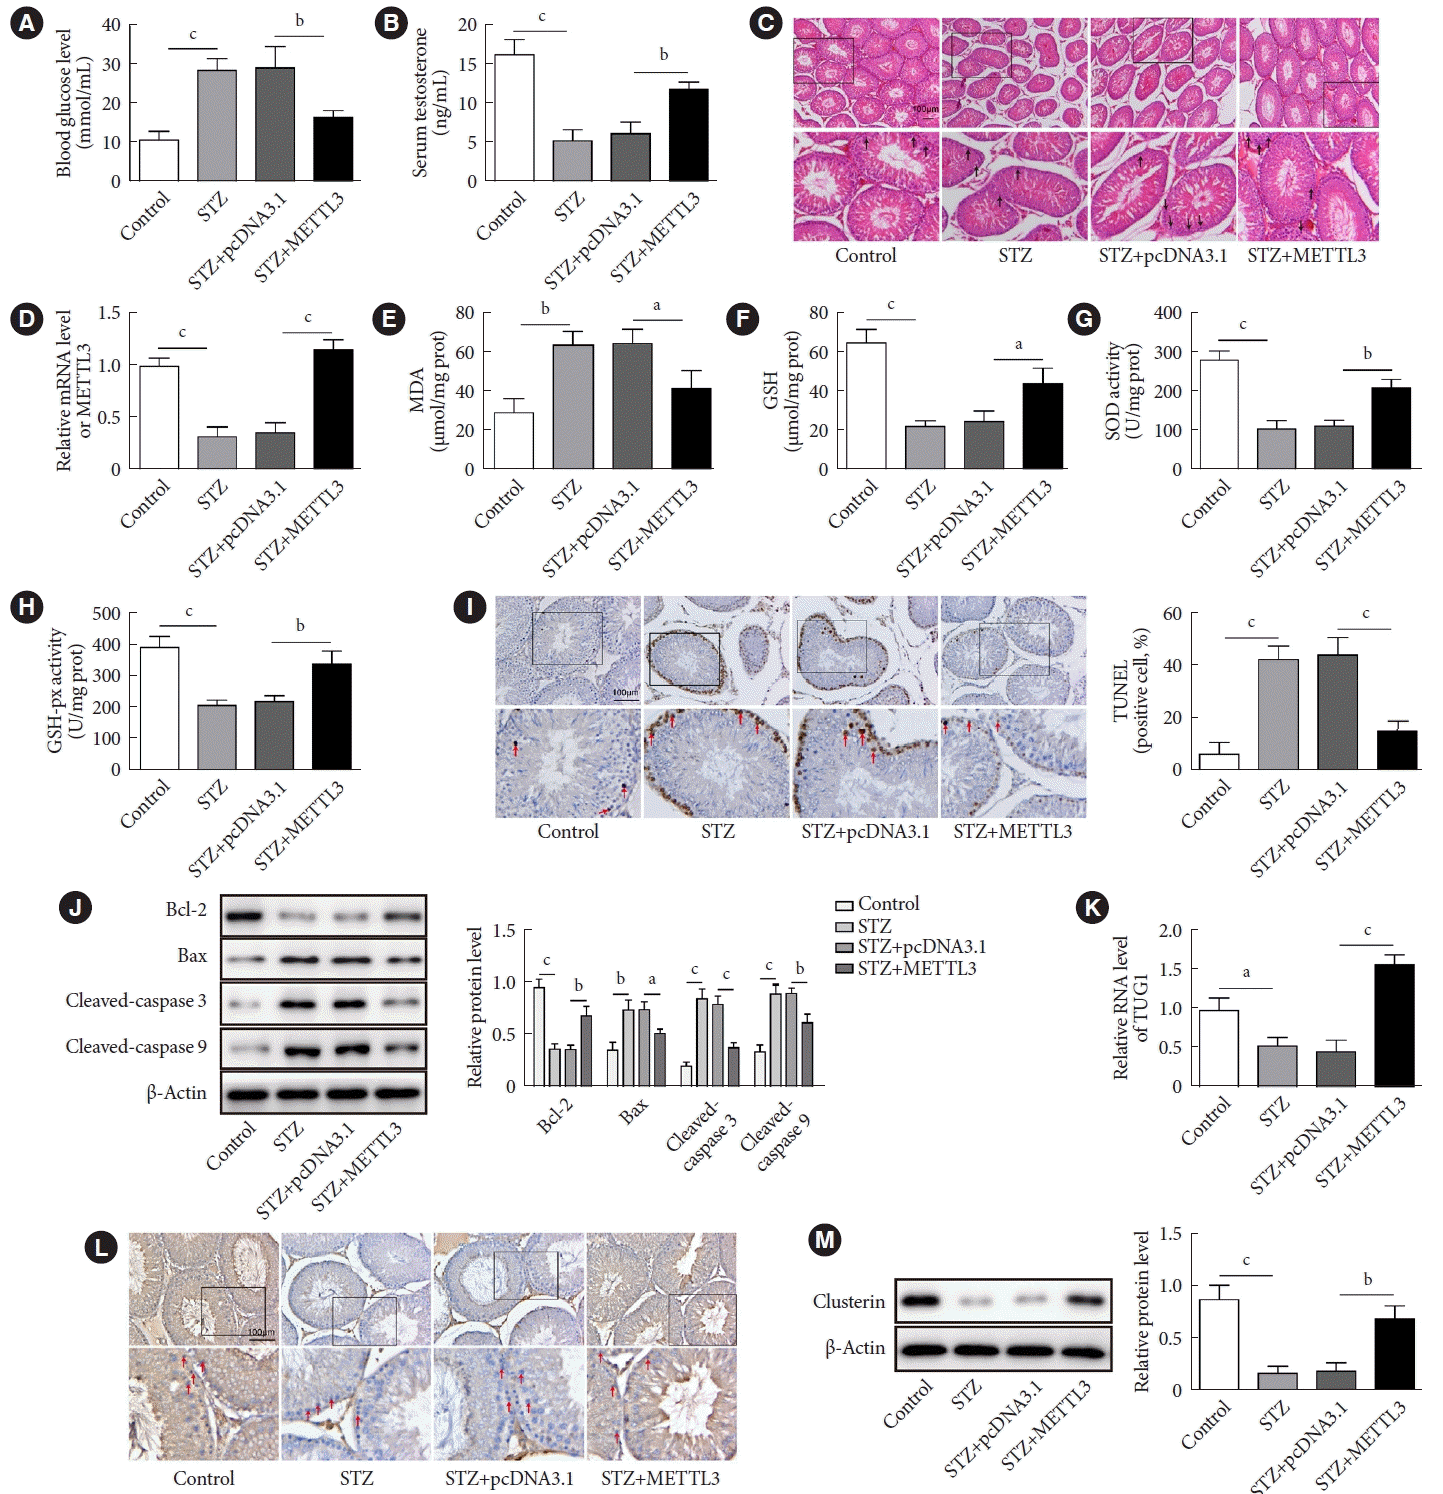 | Fig. 6.Methyltransferase like-3 (METTL3) alleviated diabetes-induced testicular damage in vivo. The diabetic mice were then divided into three groups (n=10 per group): streptozocin (STZ), STZ+pcDNA3.1, and STZ+METTL3. After treatment, the testicular tissues and blood samples were collected for further detection. (A) The blood glucose level of STZ-treated mice and control mice was measured using a glucometer. (B) The serum level of testosterone was determined by enzyme-linked immunosorbent assay (ELISA). (C) H&E staining was performed to show pathophysiological changes in the testicles. (D) The expression of METTL3 was detected by real-time quantitative polymerase chain reaction (RT-qPCR). (D, E, F, G, H) The levels of malondialdehyde (MDA) and glutathione (GSH) and the activities of superoxide dismutase (SOD) and glutathione peroxidase (GSH-Px) in mouse testicular tissues were measured by commercial kits. (I) Terminal deoxynucleotidyl transferase dUTP nick end labeling (TUNEL) assay was performed to determine the apoptosis of cells in testicular tissues. (J) The expressions of Bcl-2, Bax, cleaved caspase-3, and cleaved caspase-9 were quantified by Western blot. (K) The RNA expression of taurine up-regulated 1 (TUG1) was assessed by RT-qPCR. (L, M) The protein expression of clusterin was measured by immunohistochemistry (IHC) and Western blot. aP<0.05, bP<0.01, cP<0.001. |


 PDF
PDF Citation
 Print
Print


 XML Download