Introduction
Materials and methods
1. Cell culture
2. FA treatment and growth rate
3. Cell cycle analysis
4. Annexin V staining
5. Statistical analyses
Results
1. Growth rates of breast, thyroid, cervical cancer cells after FA treatment
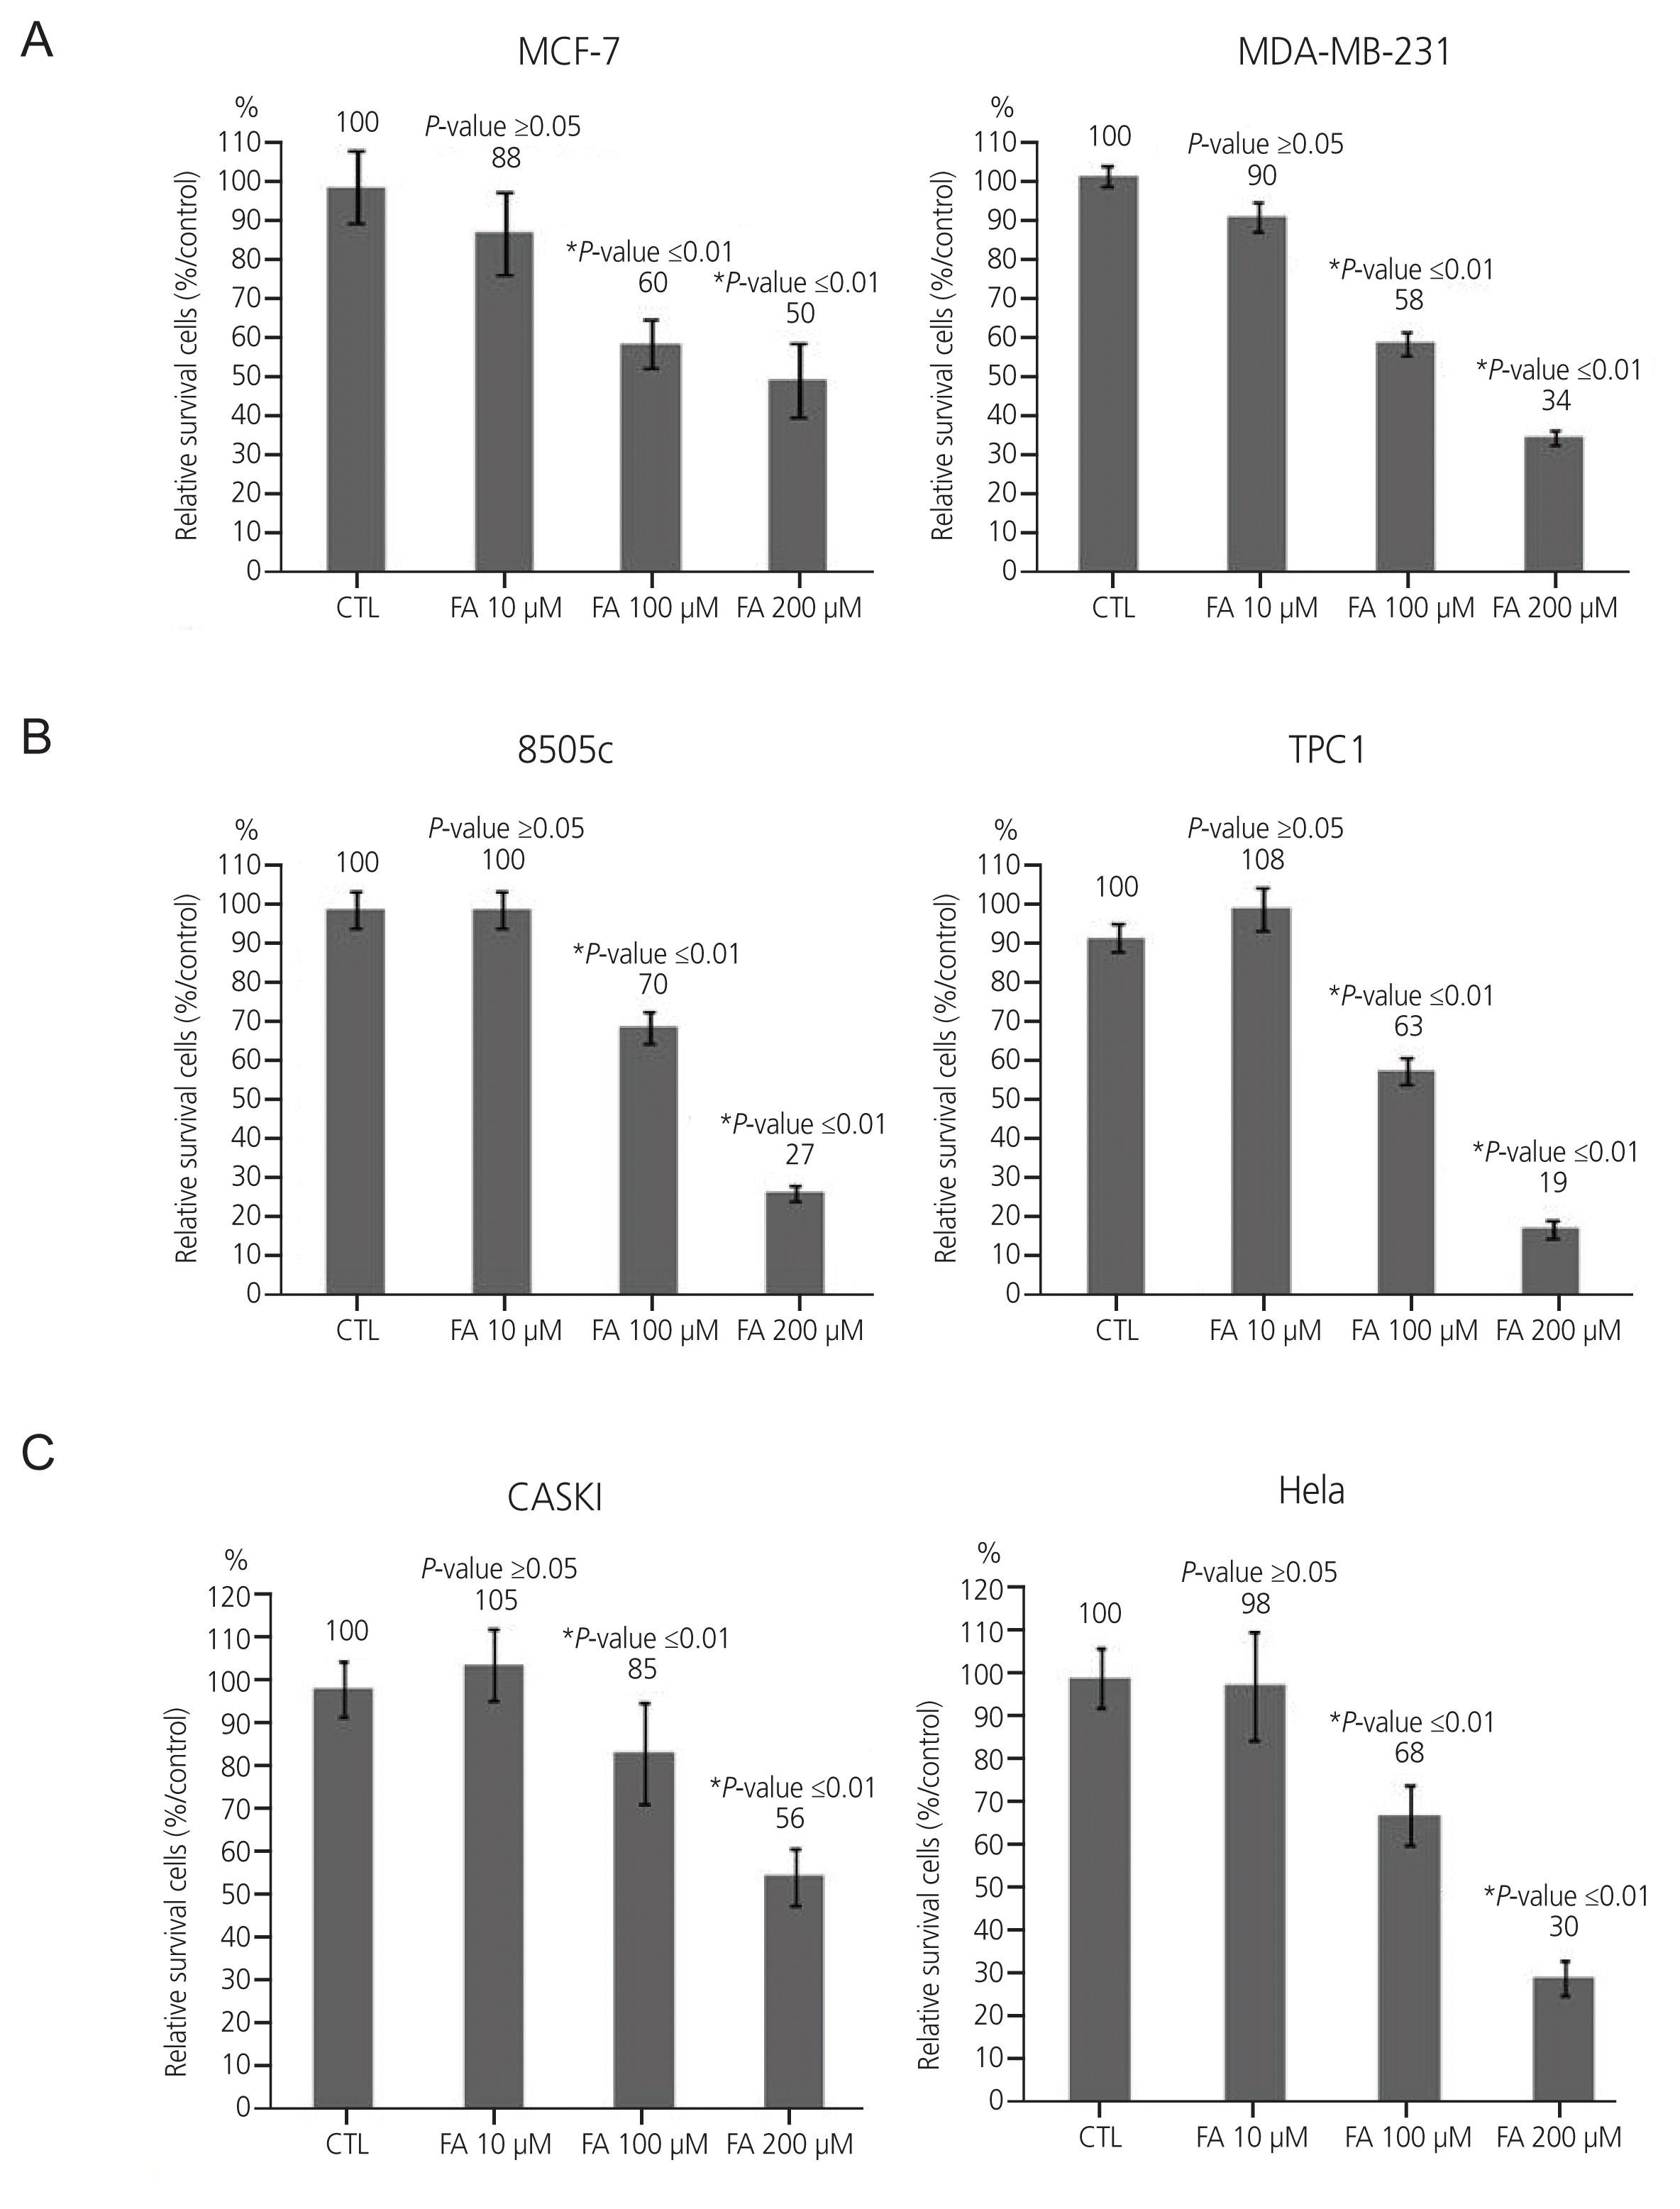
 | Fig. 1Effect of FA on six cancer cell lines (breast cancer cell lines: MCF-7, MDA-MB-231; thyroid cancer: 8505C, TPC1; cervical cancer: Caski, HeLa) were treated with FA at 10 μM, 100 μM, and 200 μM. CTL, control; FA, fusidic acid. *A significant inhibitory effect was shown at the concentraion of 100 μM and 200 μM in breast cancer cancer cell lines, 100 μM and 200 μM in thyroid cancer cell lines, and 200 μM in cervical cancer cell lines respectively. |
2. Death of breast, thyroid, and cervical cancer cells after FA treatment
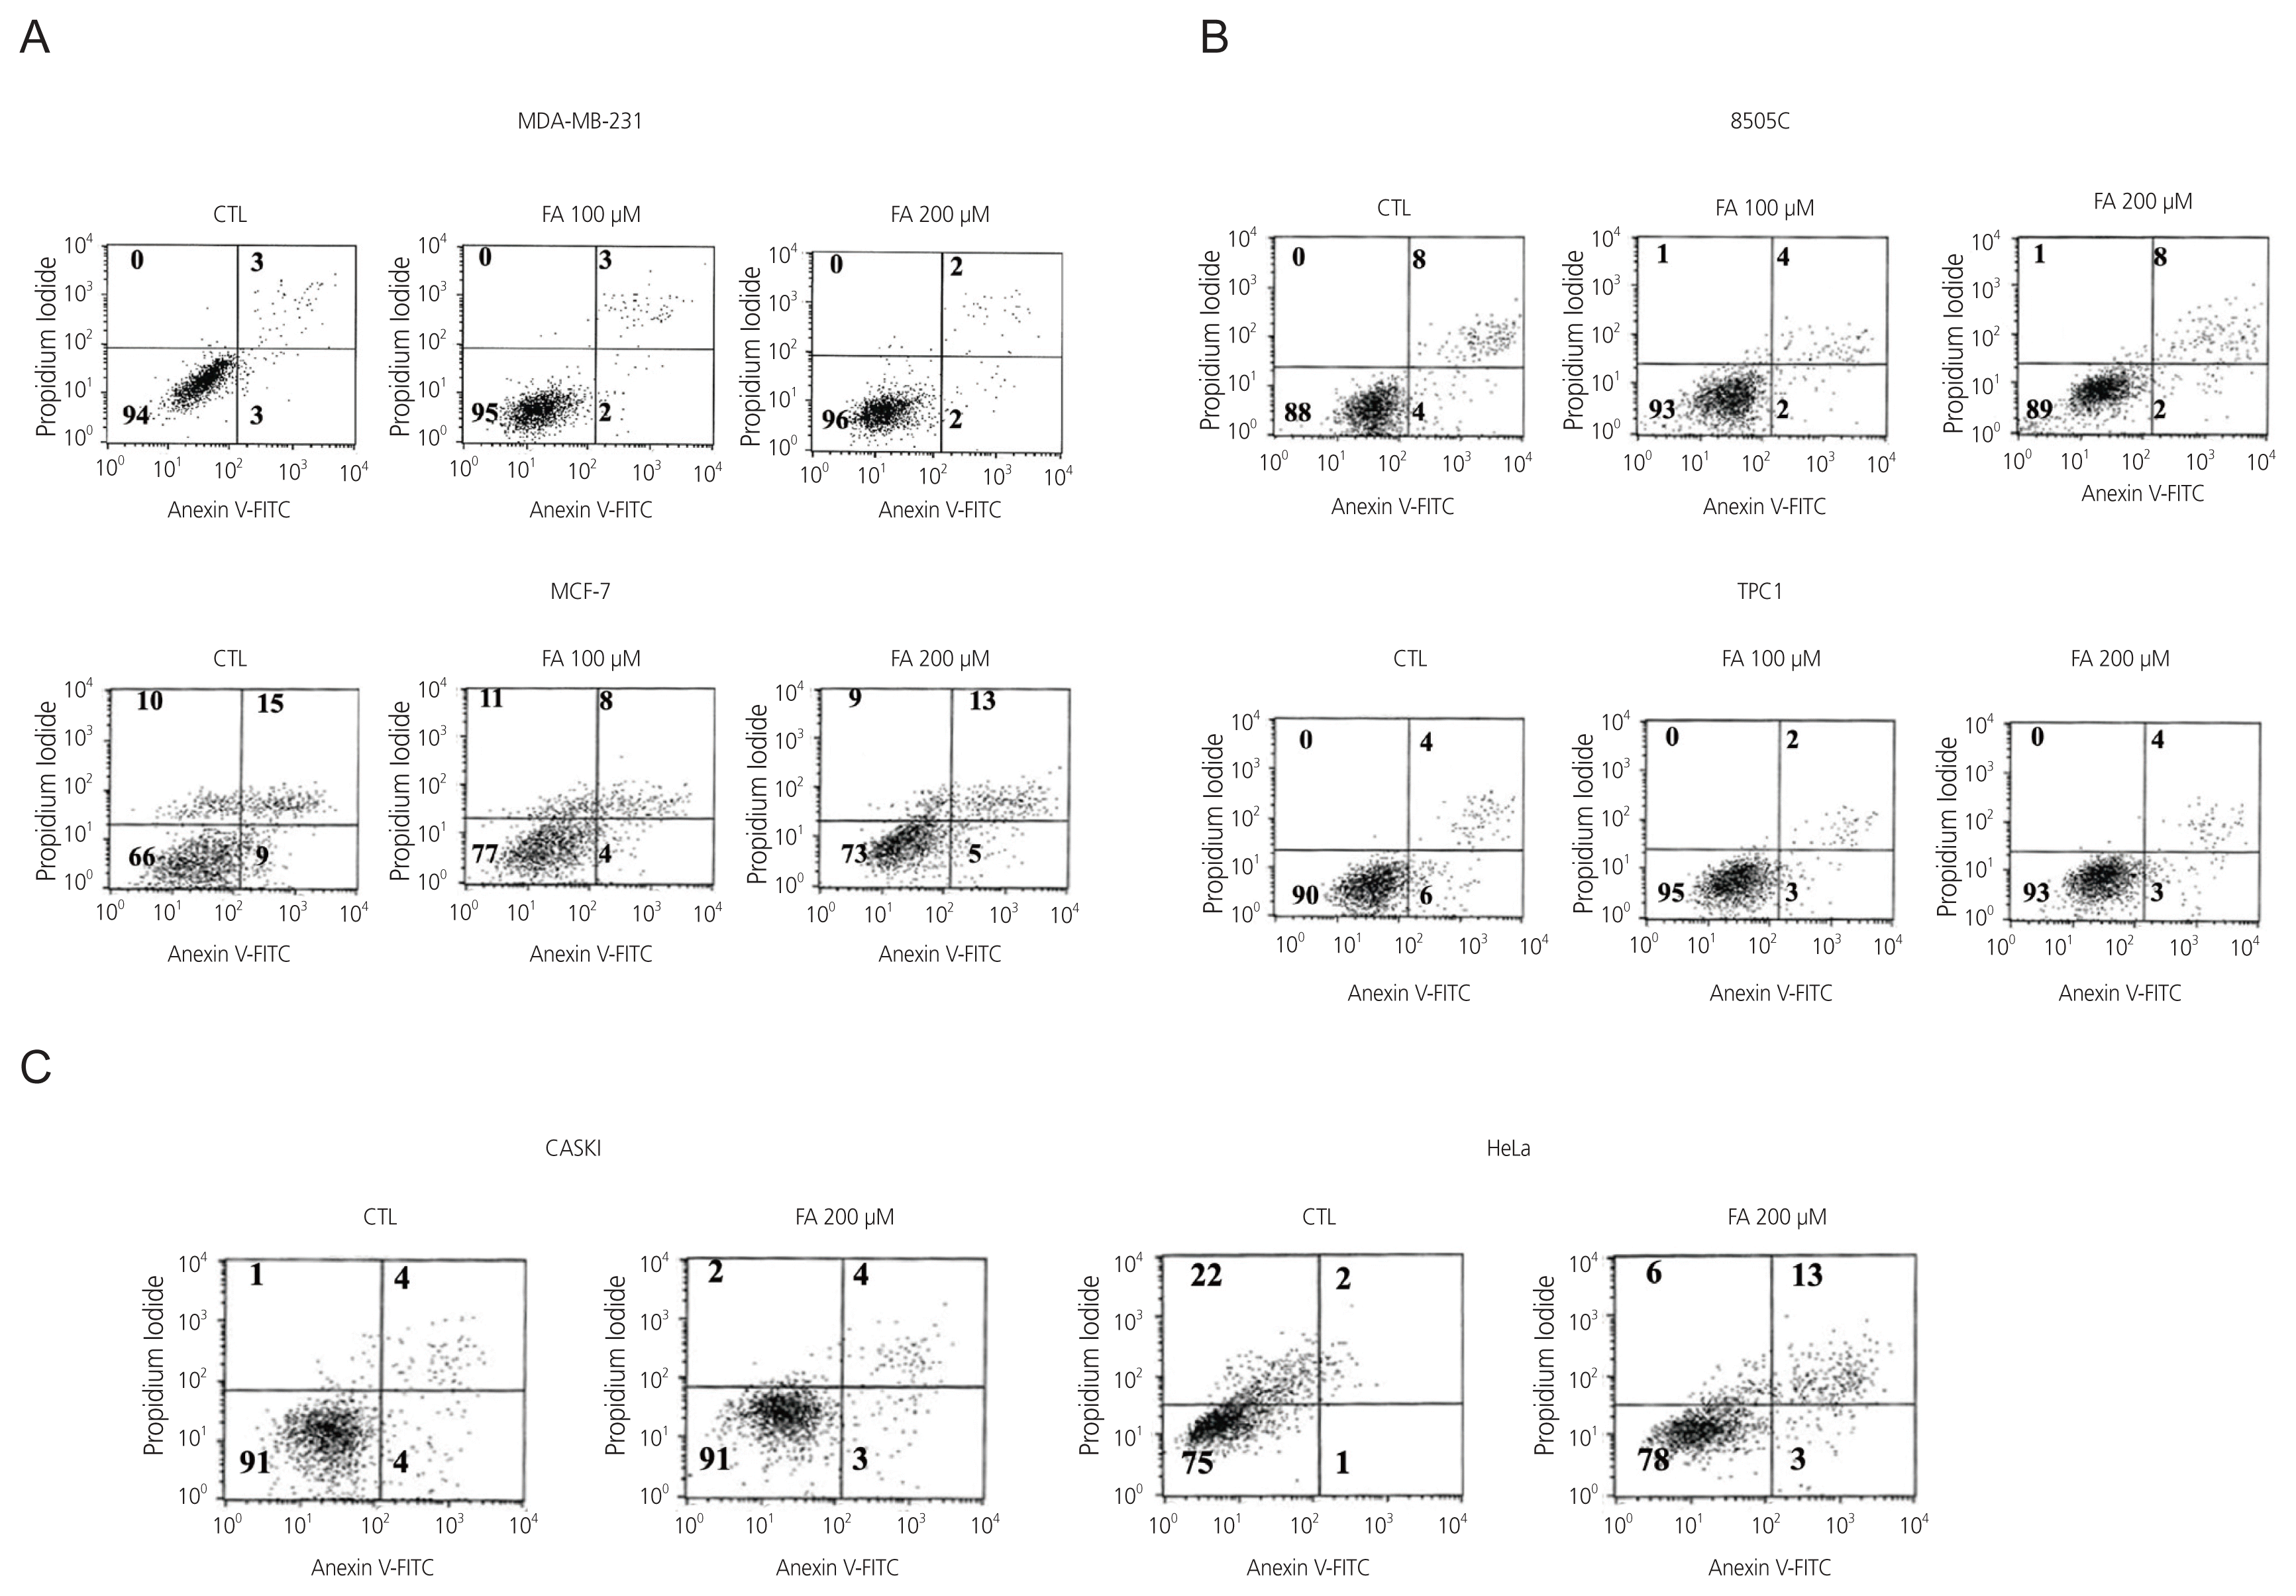
 | Fig. 2Cell death analysis was done after treatment of six cancer cell lines with FA at 100 μM and 200 μM through Annexin V and PI staining followed by flow cytometry. (A) breast cancer cells (MCF-7, MDA-MB-231), (B) thyroid cancer cells (8505C, TPC1), (C) cervical cancer cells (Caski, HeLa). CTL, control; FA, fusidic acid; FITC, fluorescein isothiocyanate; PI, propidium iodide. |
3. Cell cycle progression in breast, thyroid, and cervical cancer cells after FA treatment
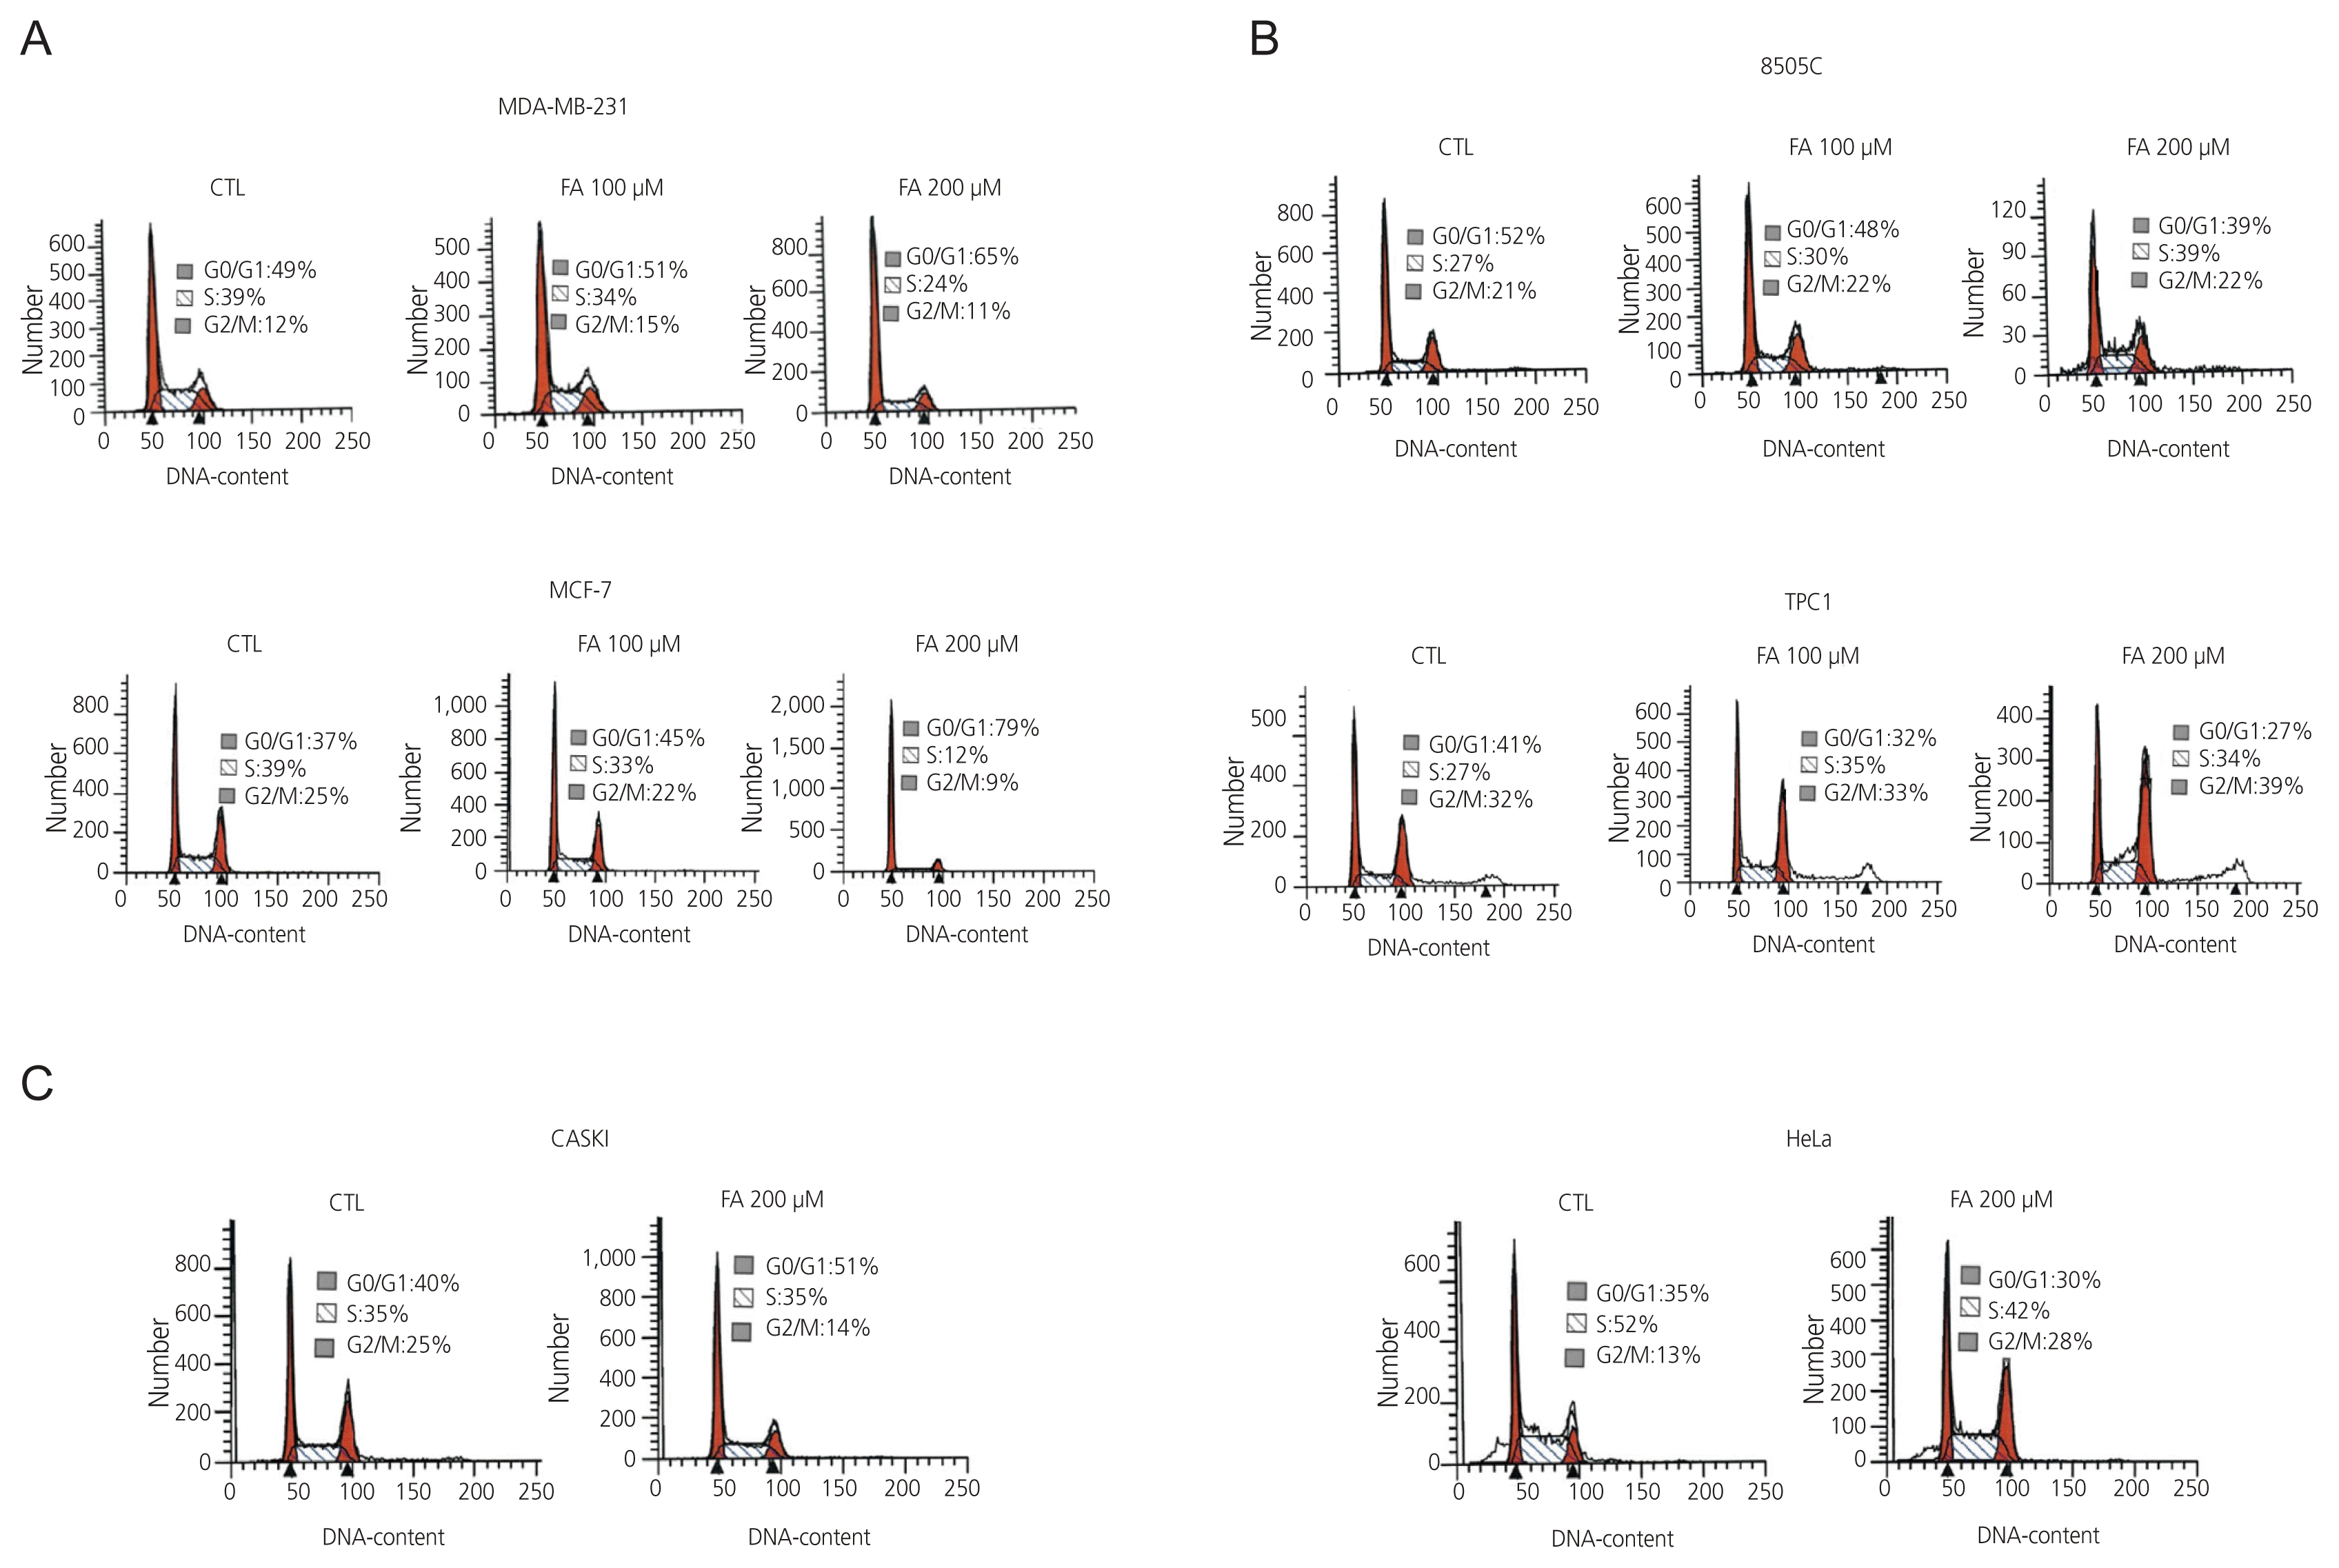
 | Fig. 3Six cancer cells were treated with the indicated amounts of FA at 100 μM and 200 μM for 72 hours and the percentages of cells at each stage of the cell cycle were analyzed by flow cytometry after staining the DNA with PI. (A) Breast cancer cells (MCF-7, MDA-MB-231), (B) thyroid cancer cells (8505C, TPC1), (C) cervical cancer cells (Caski, HeLa). CTL, control; FA, fusidic acid; PI, propidium iodide. |


 PDF
PDF Citation
 Print
Print


 XML Download