Abstract
Background
Methods
Results
References
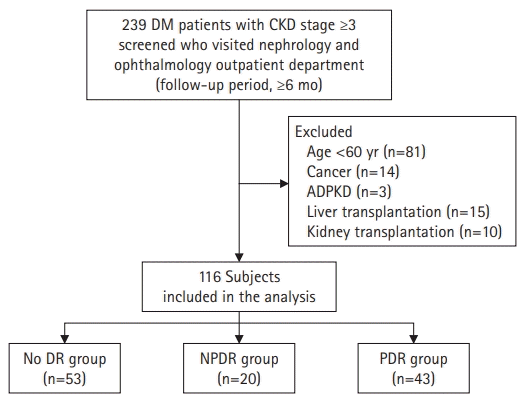
Fig. 1.

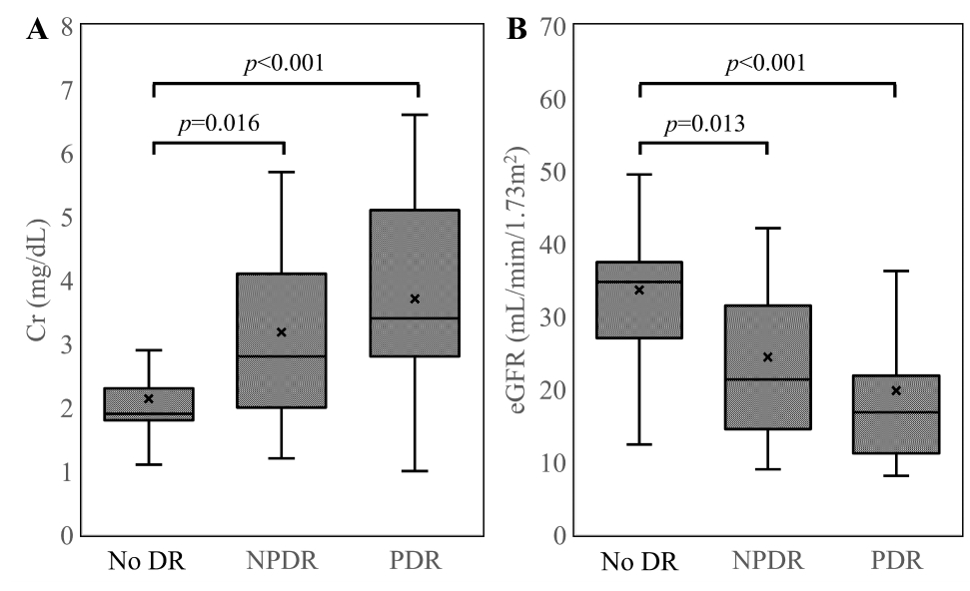
Fig. 2.

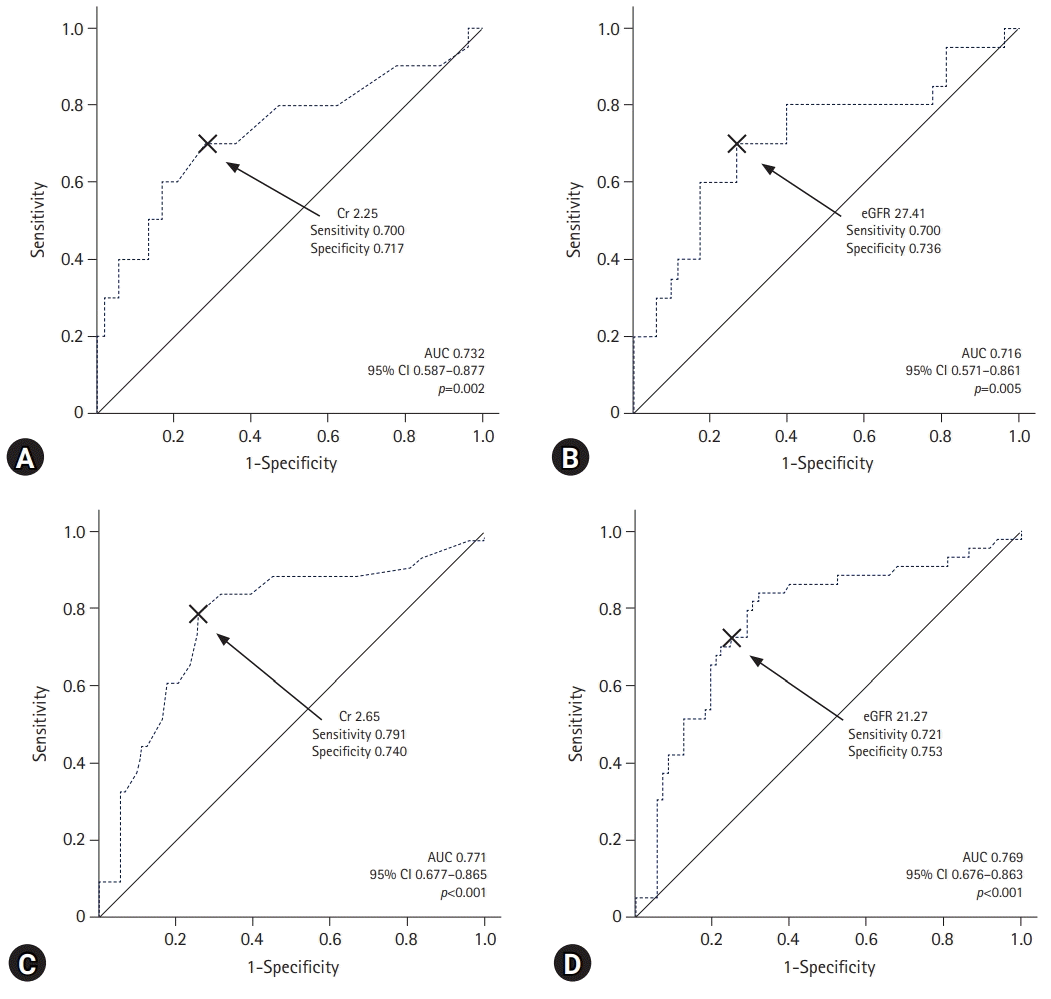
Fig. 3.

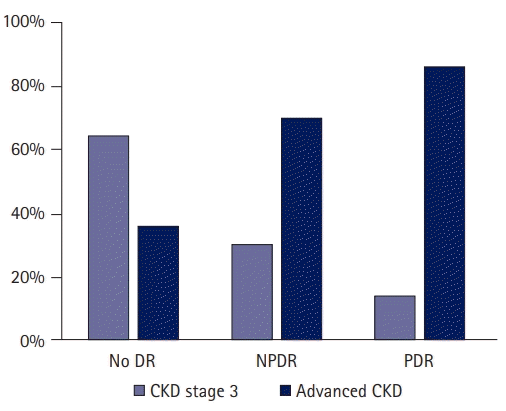
Fig. 4.

Table 1.
| Characteristic | No DR group | NPDR group | PDR group |
p-value |
||
|---|---|---|---|---|---|---|
| No DR vs. NPDR | No DR vs. PDR | NPDR vs. PDR | ||||
| No. of patients | 53 | 20 | 43 | |||
| Age (yr) | 71.62±8.743 | 70.65±8.887 | 68.95±8.679 | 0.906 | 0.301 | 0.754 |
| Very old agea) | 12 (22.6) | 5 (25.0) | 7 (16.3) | >0.999 | 0.437 | 0.496 |
| Male sex | 23 (43.4) | 11 (55.0) | 15 (34.9) | 0.375 | 0.396 | 0.131 |
| HbA1c (%) | 7.281±1.343 | 7.660±1.515 | 7.781±1.934 | 0.645 | 0.290 | 0.958 |
| Total cholesterol (mg/dL) | 147.360±40.484 | 151.150±28.722 | 147.910±38.531 | 0.924 | 0.997 | 0.947 |
| Serum albumin (g/dL) | 4.098±0.459 | 4.000±0.511 | 3.851±0.473 | 0.710 | 0.033 | 0.478 |
| Albuminuriab) | 26 (49.1) | 14 (70.0) | 40 (93.0) | 0.109 | <0.001 | 0.023 |
| Microalbuminuriac) | 3 (5.7) | 2 (10.0) | 3 (7.0) | 0.177 | <0.001 | 0.012 |
| Macroalbuminuriad) | 23 (43.4) | 12 (60.0) | 37 (86.0) | 0.177 | <0.001 | 0.012 |
| Insulin use | 11 (20.8) | 17 (85.0) | 19 (44.2) | <0.001 | 0.014 | 0.002 |
| DM duration (yr) | 13.496±7.726 | 17.810±8.644 | 20.230±8.320 | 0.110 | <0.001 | 0.514 |
| Hypertension | 39 (73.6) | 18 (90.0) | 36 (83.7) | 0.205 | 0.232 | 0.706 |
| Hyperlipidemia | 39 (73.6) | 18 (90.0) | 24 (55.8) | 0.205 | 0.068 | 0.007 |
| Past CVA | 5 (9.4) | 6 (30.0) | 12 (27.9) | 0.060 | 0.018 | 0.864 |
| CVD | 30 (56.6) | 10 (50.0) | 14 (32.6) | 0.613 | 0.019 | 0.185 |
| MI | 6 (11.3) | 6 (30.0) | 4 (9.3) | 0.077 | >0.999 | 0.061 |
| ACS | 14 (26.4) | 6 (30.0) | 6 (14.0) | 0.759 | 0.135 | 0.172 |
| CHF | 24 (45.3) | 10 (50.0) | 9 (20.9) | 0.719 | 0.012 | 0.019 |
| Arrhythmia | 9 (17.0) | 2 (10.0) | 4 (9.3) | 0.716 | 0.274 | >0.999 |
| VHD | 2 (3.8) | 2 (10.0) | 4 (9.3) | 0.301 | 0.403 | >0.999 |
| CABG history | 5 (9.4) | 0 (0) | 2 (4.7) | 0.314 | 0.454 | >0.999 |
Values are expressed as number only, mean±standard deviation, and number (%).
DR, diabetic retinopathy; NPDR, nonproliferative DR; PDR, proliferative DR; HbA1c, glycated hemoglobin; DM, diabetes mellitus; CVA, cerebrovascular accident; CVD, cardiovascular disease; MI, myocardial infarction; ACS, acute coronary syndrome; CHF, congestive heart failure; VHD, valvular heart disease; CABG, coronary artery bypass graft surgery.
Table 2.
| Variable |
Univariate regression model |
|
|---|---|---|
| OR (95% CI) | p-value | |
| No DR | Reference | |
| NPDR | 4.175 (1.377–12.657) | 0.012 |
| PDR | 11.035 (3.943–30.885) | <0.001 |
| Very old agea) | 2.308 (0.809–6.347) | 0.105 |
| Male sex | 0.591 (0.278–1.256) | 0.172 |
| HbA1c ≥8% | 1.500 (0.671–3.353) | 0.323 |
| Macroalbuminuriab) | 4.430 (1.987–9.878) | <0.001 |
| Insulin use | 1.740 (0.802–3.779) | 0.161 |
| DM duration ≥10 yr | 5.454 (2.127–13.984) | <0.001 |
| Hypertension | 2.965 (1.158–7.594) | 0.023 |
| Hyperlipidemia | 0.721 (0.316–1.647) | 0.438 |
| Past CVA | 1.295 (0.500–3.358) | 0.594 |
| CVD | 1.421 (0.671–3.011) | 0.359 |
| MI | 5.500 (1.187–25.484) | 0.029 |
| ACS | 2.667 (0.978–7.268) | 0.055 |
| CHF | 2.252 (1.002–5.061) | 0.049 |
| Arrhythmia | 1.357 (0.435–4.293) | 0.593 |
| VHD | 1.103 (0.250–4.855) | 0.897 |
| CABG history | 1.692 (0.314–9.115) | 0.540 |
OR, odds ratio; CI, confidence interval; DR, diabetic retinopathy; NPDR, nonproliferative DR; PDR, proliferative DR; DM, diabetes mellitus; CVA, cerebrovascular accident; CVD, cardiovascular disease; MI, myocardial infarction; ACS, acute coronary syndrome; CHF, congestive heart failure; VHD, valvular heart disease; CABG, coronary artery bypass graft surgery.
Table 3.
Multivariate regression model 1 is adjusted for the degree of DR, very old age, male sex, poorly controlled DM, macroalbuminuria, insulin use, DM duration of ≥10 years, history of CVA, HTN, hyperlipidemia, and history of CVD. Multivariate regression model 2 is adjusted for the degree of DR, very old age, male sex, poorly controlled DM, macroalbuminuria, insulin use, DM duration of ≥10 years, history of CVA, HTN, hyperlipidemia, MI, CHF, arrhythmia, and history of VHD. Multivariate regression model 3 is adjusted for the degree of DR, very old age, male sex, poorly controlled DM, macroalbuminuria, insulin use, DM duration of ≥10 years, history of CVA, HTN, hyperlipidemia, ACS, CHF, arrhythmia, and history of VHD.
Poorly controlled DM is defined as an HbA1c level of ≥8.0%. Macroalbuminuria is defined as a random urine albumin-creatinine ratio of ≥300 mg/g Cr.
OR, odds ratio; CI, confidence interval; DR, diabetic retinopathy; NPDR, nonproliferative diabetic retinopathy; PDR, proliferative diabetic retinopathy; DM, diabetes mellitus; HTN, hypertension; CVA, cerebrovascular accident; CVD, cardiovascular disease; MI, myocardial infarction; CHF, congestive heart failure; VHD, valvular heart disease; ACS, acute coronary syndrome; HbA1c, glycated hemoglobin.


 PDF
PDF Citation
 Print
Print


 XML Download