

 PDF
PDF Citation
 Print
Print


INTRODUCTION
Neuroendocrine neoplasms (NENs) comprise a diverse group of neoplasms characterized by the presence of neurosecretory granules.1 Two subgroups of epithelial NENs are currently recognized: well-differentiated neuroendocrine tumors (NETs) and poorly differentiated neuroendocrine carcinomas (NECs). NETs have been graded in three tiers as grade 1 (G1), grade 2 (G2), and grade 3 (G3) or in two tiers as carcinoid and atypical carcinoid.1 In contrast, NECs are always high grade and are subclassified into small cell neuroendocrine carcinomas and large cell neuroendocrine carcinomas (LCNECs) based on the histomorphologic appearance. In some organs, these tumors may have different names. For example, pulmonary small cell neuroendocrine carcinoma is currently called small cell carcinoma or small cell lung cancer (SCLC).
Recently, several population-based studies have reported that NETs and NECs of various primary sites commonly have greater tendencies toward liver organotrophic metastasis, suggesting that these tumors of various primary sites share a key factor causing liver organotropic metastasis.23456 This finding is very interesting because NET and NEC are clinically, morphologically, and genetically distinct entities. For example, several previous studies have reported that the mutation profiles of NECs are more similar to those of nonneuroendocrine neoplasms (non-NENs), such as adenocarcinoma (ADC) of the same primary site, than to those of NETs.78 NEC frequently presents as combined NEC with a non-NEN component.91011121314 In summary, NETs and NECs are both characterized by neuroendocrine differentiation, and NECs and non-NENs share similar mutation profiles. Therefore, we presumed that if we simultaneously compare the metastatic patterns of NETs, NECs, and non-NENs from the same primary organ, we might identify a key factor causing liver organotrophic metastasis. Additionally, we identified the characteristics of the metastatic patterns of NETs and NECs. Notably, most previous studies have focused mainly on the high liver metastasis rate, whereas none have compared the metastatic patterns of NET, NEC, and non-NEN at the same time.
We collected data from patients with NETs, NECs, and representative non-NENs from an institutional database and compared metastasis patterns to identify a key factor causing liver organotrophic metastasis and to collect more information about the metastasis patterns of NETs and NECs.
METHODS
Patient selection
The Cancer Database of the Samsung Medical Center was searched between 1994 and 2014 using the International Classification of Diseases for Oncology, 3rd Edition (ICD-O-3) histology codes. In detail, we used 8240/3 (carcinoid tumor, not otherwise specified [NOS]) and 8249/3 (atypical carcinoid tumor) codes to select NET cases. We used 8041/3 (small cell carcinoma), 8013/3 (LCNEC), and 8246/3 (NEC) codes to select NEC cases. Only cases with histopathologically confirmed diagnoses were included in this study. Then, we sorted retrieved cases according to their primary organs and selected NEN cases originating from organs that met the following criteria: 1) organs with sufficient numbers of NEN cases for statistical analysis and 2) organs with representative non-NECs for comparison. The following primary organs of NENs were selected: the lung, gallbladder, pancreas, stomach, small intestine, colorectum, and uterine cervix. Among these selected organs, only the lung had sufficient numbers of SCLCs and LCNEC cases to statistically analyze each SCLC and LCNEC case separately. Therefore, we subdivided lung primary NEC cases into SCLC and LCNEC cases for further analysis. We excluded lung primary NEC cases with 8246/3 (NEC) codes because these cases were unable to be subclassified as SCLC or LCNEC. As a result, 4,046 patients with NEN (1,020 patients with NET and 3,026 patients with NEC) were identified and included in this study.
Then, we retrieved ADC cases from each primary organ as a representative non-NEC. We used ICD-O-3 histology codes 8140/3 (ADC, NOS) and 8384/3 (ADC, endocervical type) to retrieve uterine cervical adenocarcinoma cases and used only 8140/3 (ADC, NOS) to retrieve ADC cases from the remaining primary organs included in this study.
Because all included primary sites were located within the trunk, we also included 177 patients with medullary thyroid carcinoma (MTC) to evaluate the metastatic pattern of NEN originating outside of the trunk, and 2,122 patients with papillary thyroid carcinoma (PTC) were included as the control group. We used ICO-O-3 histology codes 8510/3 (medullary carcinoma, NOS) and 8050/3 (papillary carcinoma, NOS) to retrieve MTC and PTC cases, respectively.
Then, we collected clinical data for all patients, including the age at diagnosis, sex, presence of metastasis, location of metastasis, presence of recurrence and location of recurrence. All radiologically or pathologically identified metastatic sites during the follow-up period, including both synchronous and metachronous metastases, were included in this study. Tumor recurrence in distant organs after surgical resection during the follow-up period was considered metastasis. Metastasis to the same organ, such as lung-to-lung metastasis, was excluded. The locations of metastasis were reviewed and recategorized to simplify the statistical analysis.
Because substantial differences in metastatic rates (percentage of patients with metastasis/total number of patients) were observed according to histologic type, which may cause statistical bias, we calculated and compared the organotrophic metastasis rates (the percentages of patients with metastasis to the indicated organ divided by the total number of patients with metastasis) during comparisons of the metastatic tendency to each organ among different histologic types. In addition, 70.4% (171/243) of patients with PTC showed only lymph node (LN) metastasis, and we considered that their inclusion might also cause statistical bias. Therefore, patients with only LN metastasis were excluded during the comparison of metastatic tendency to each organ (except for LN) between MTC and PTC.
Statistical analysis
Continuous variables, such as the age at diagnosis, were compared using the Mann-Whitney U test, and the results are described as the medians and interquartile ranges. Categorical variables were compared among different groups using Pearson’s χ2 test or Fisher’s exact test, as appropriate. Statistical analyses were performed using OriginPro version 2022 (OriginLab, Northampton, MA, USA) and SPSS version 17.0 (SPSS Inc., Chicago, IL, USA).
RESULTS
Patient characteristics
The clinical features of 45,860 patients (4,223 patients with NENs and 41,637 patients with non-NECs), including the age at diagnosis, sex, and metastatic rates, are summarized in Table 1, Supplementary Tables 1, 2, 3, 4, 5, 6, 7, 8, and Fig. 1. Colorectal NET (n = 623) was the most common NET in this study, followed by gastric NET (n = 134), pulmonary NET (n = 114), small intestinal NET (n = 99), and pancreatic NET (n = 50). Among 623 colorectal NET cases, 589 cases (94.5%) were rectal NET.
Table 1
Summary of patients’ clinical characteristics, including the median age at diagnosis, sex ratio and metastasis rate
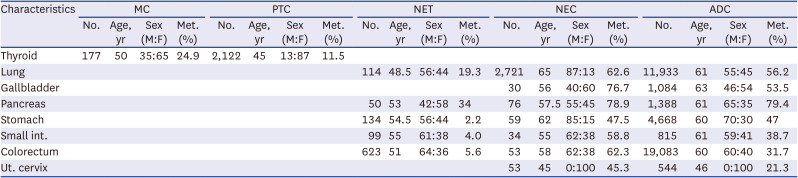
Fig. 1
Comparison of the patients’ median age at diagnosis (years), proportion of male patients (%) and metastasis rate (%).
MTC = medullary thyroid carcinoma, PTC = papillary thyroid carcinoma, NET = neuroendocrine tumor, NEC = neuroendocrine carcinoma, ADC = adenocarcinoma, GB = gallbladder, Ut. cervix = uterine cervix.
Only statistically significant comparisons are marked with asterisks: *P ≤ 0.05; **P ≤ 0.01; ***P ≤ 0.001.
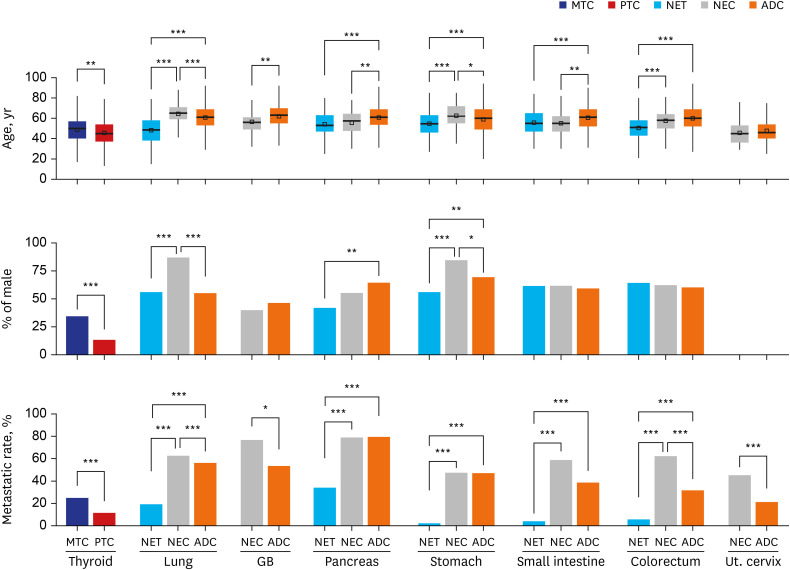
The median ages of patients with NETs were significantly (all P < 0.001) younger than those of patients with ADCs in all primary sites. In contrast, the median ages of patients with NECs showed a variable relationship with the median ages of patients with ADCs, as patients with gallbladder, pancreas, and small intestine involvement were significantly younger, similar ages were observed for patients with colorectum and uterine cervix involvement, and patients with lung and stomach involvement were significantly older. The median age of patients with MTC was also significantly (P = 0.001) older than the median age of patients with PTC.
Compared to median age, differences in sex distributions were not significant. Patients with NETs and NECs generally showed a male predominance, except for those with pancreatic NET and gallbladder NEC. Significantly more females (P = 0.001) were diagnosed with pancreatic NETs than with pancreatic ADCs. Gallbladder NEC and gallbladder ADC both showed a slight female predominance. Additionally, patients with pulmonary NEC and gastric NEC were significantly more likely to be male than patients with NETs and ADCs of each primary organ.
Overall, the metastasis rates of NETs were significantly lower than those of NECs or ADCs in all primary organs. Pancreatic NETs showed the highest metastasis rate (34.0%), followed by pulmonary NETs (19.3%), colorectal NETs (5.6%), small intestinal NETs (4.0%), and gastric NETs (2.2%). In contrast, the metastasis rates of NECs were similar to or significantly higher than those of ADCs. Among NECs, pancreatic NECs showed the highest metastasis rate (78.9%), followed by gallbladder NECs (76.7%), pulmonary SCLCs (63.3%), colorectal NECs (62.3%), small intestinal NECs (58.8%), pulmonary LCNECs (57.7%), gastric NECs (47.5%), and uterine cervical NECs (45.3%). The metastasis rate of MTC (24.9%) was also significantly (P < 0.001) higher than that of PTC (11.5%).
Epidemiology of metastasis
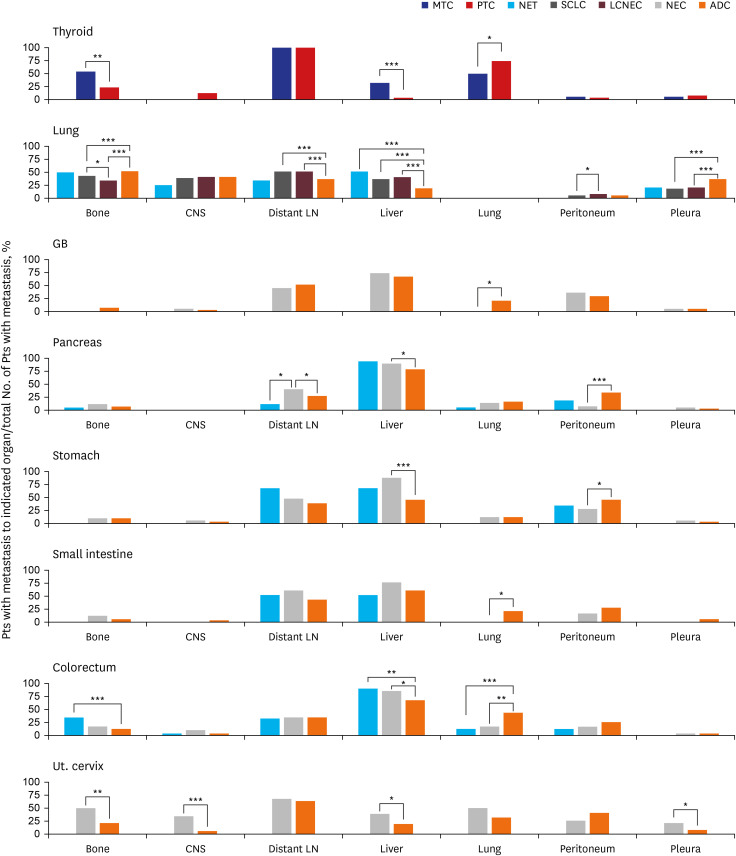
A total of 39,609 records of metastases were identified for the 45,860 patients included in this study. The most common site of metastasis was the liver (7,783/39,609, 19.7%), followed by distant LNs (6,680/39,609, 16.9%), lung (6,230/39,609, 15.7%), bone (4,984/39,609, 12.6%), central nervous system (CNS) (3,416/39,609, 8.6%), peritoneum (3,229/39,609, 8.2%), and pleura (2,793/39,609, 7.0%). Metastasis to these organs accounted for 88.7% (35,115/39,609) of all metastases. Among the remaining organs, a few significant differences in organotrophic metastasis rates were also observed among NETs, NECs, and non-NENs. However, metastasis rates were too low to have clinical significance, despite their statistical significance. For example, splenic organotrophic metastasis was significantly different (P < 0.001) between pulmonary SCLC (5/1,502, 0.3%) and LCNEC (7/202, 3.5%), although these rates were too low to have clinical significance. We describe the details of metastases, including metastases to the remaining organs, in the Supplementary Tables 1, 2, 3, 4, 5, 6, 7, 8. We subsequently focused on comparing the patterns of organotrophic metastasis to the liver, distant LNs, lung, bone, CNS, peritoneum, and pleura (Fig. 2).
Fig. 2
Comparison of metastatic patterns between patients with NENs and patients with non-NENs in various primary sites. Each percentage indicates the percentage of patients with metastasis to the indicated organ divided by the total number of patients with metastasis. For thyroid cancer, patients with LN metastasis alone were excluded from the total number of patients with metastasis.
NEN = neuroendocrine neoplasm, MTC = medullary thyroid carcinoma, PTC = papillary thyroid carcinoma, NET = neuroendocrine tumor, NEC = neuroendocrine carcinoma, ADC = adenocarcinoma, GB = gallbladder, Ut. cervix = uterine cervix, LN = lymph node, CNS = central nervous system.
Only statistically significant comparisons are marked with asterisks: *P ≤ 0.05; **P ≤ 0.01; ***P ≤ 0.001.
Comparison of metastatic patterns
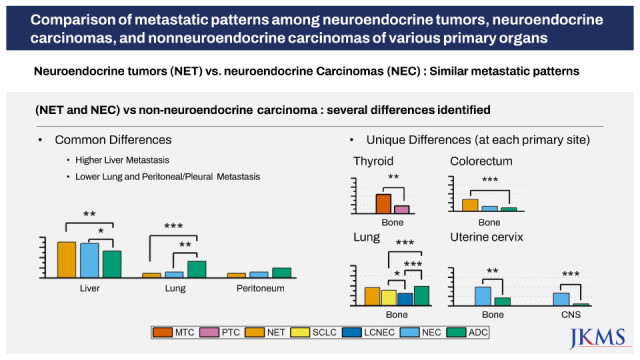
NETs and NECs from the same primary sites showed no significant differences in metastatic patterns, with three exceptions. The bone organotrophic metastasis rate of pulmonary SCLC (589/1,502, 39.2%) was significantly higher (P = 0.028) than that of pulmonary LCNEC (63/202, 31.2%). The peritoneal organotrophic metastasis rate of pulmonary LCNEC (9/202, 4.5%) was significantly higher (P = 0.037) than that of pulmonary SCLC (29/1,502, 1.9%). The distant LN organotrophic metastasis rate of pancreatic NEC (24/60, 40.0%) was significantly higher (P = 0.030) than that of pancreatic NET (2/17, 11.8%).
When we compared the metastatic patterns of NENs and non-NENs in various primary sites, we observed two types of differences. One type entailed differences shared by NENs from most primary sites; the other was differences specific to each organ.
NENs showed higher liver organotrophic metastasis rates, lower pleural/peritoneal organotrophic metastasis rates and lower lung organotrophic metastasis rates than matched non-NENs in most primary sites.
Higher liver organotrophic metastasis rates than those of matched non-NENs were identified for MTC (7/22, 31.8%, P < 0.001), pulmonary NET (11/22, 50%, P < 0.001), pulmonary SCLC (508/1,502, 33.8%, P < 0.001), pulmonary LCNEC (78/202, 38.6%, P < 0.001), pancreatic NEC (54/60, 90%, P = 0.022), gastric NEC (24/28, 85.7%, P < 0.001), colorectal NET (31/35, 88.6%, P = 0.005), colorectal NEC (28/33, 84.8%, P = 0.026), and uterine cervical NEC (22/116, 19%, P = 0.047). However, the liver organotrophic metastasis rates of gallbladder NEC (17/23, 73.9%), pancreatic NET (16/17, 94.1%), gastric NET (2/3, 66.7%), small intestinal NET (2/4, 50%) and small intestinal NEC (15/20, 75%) were not significantly different from those of matched non-NENs of the same primary tissue (P = 0.462, P = 0.141, P = 0.581, P = 0.652 and P = 0.240, respectively), probably due to the small numbers of patients included in this study. Interestingly, the liver organotrophic metastasis rate of NENs increased in proportion to the increase in the liver metastasis rate of non-NENs from the same primary site.
Lower peritoneal organotrophic metastasis rates than those of matched non-NENs were identified for pancreatic NEC (5/60, 8.3%, P < 0.001) and gastric NEC (7/28, 25.0%, P = 0.041). The remaining intra-abdominal NENs did not show statistically significant differences in peritoneal organotrophic metastasis rates. However, colorectal NEN (sum of NET and NEC) (9/68, 13.2%) showed significantly lower peritoneal organotrophic metastasis rates (P = 0.028) than colorectal ADC (1,496/6,040, 24.8%), although neither colorectal NET (4/35, 11.4%) nor colorectal NEC (5/33, 15.2%) showed statistically significant differences (P = 0.068 and P = 0.202) compared to colorectal ADC. Therefore, we suspect that the small number of cases might explain the lack of significant differences. Additionally, pulmonary SCLC (250/1,502, 16.6%) and LCNEC (38/202, 18.8%) showed lower pleural organotrophic metastasis rates (both P < 0.001) than pulmonary ADC (2,234/6,701, 33.3%). None of the pulmonary NETs (0/22, 0%) exhibited pleural metastasis.
Lower lung organotrophic metastasis rates than those of matched non-NENs were identified for MTC (11/22, 50.0%, P < 0.038), colorectal NET (4/35, 11.4%, P < 0.001), and colorectal NEC (5/33, 15.2%, P = 0.002). No gallbladder NEC (0/23), gastric NET (0/3), small intestinal NET (0/4), or small intestinal NEC (0/20) underwent lung metastasis. However, the lung organotrophic metastasis rates of pancreatic NET (1/17, 5.9%), pancreatic NEC (8/60, 13.3%), gastric NEC (3/28, 10.7%), and uterine cervical NEC (12/24, 50.0%) were not significantly different from those of matched non-NENs from the same primary tissue (P = 0.494, P = 0.701, P = 1.000, and P = 0.091, respectively).
In addition to previously described differences shared by various primary sites, we observed several significant differences in metastatic patterns between NENs and non-NENs specific to each organ. In the thyroid, MTC (12/22, 54.5%) exhibited a significantly higher bone organotrophic metastasis rate (P < 0.001) than PTC (16/72, 22.2%). In the lung, SCLC (589/1,502, 39.2%) and LCNEC (63/202, 31.2%) showed significantly lower bone organotrophic metastasis rates (both P < 0.001) than ADC (3,248/6,701, 48.5%). Significantly higher distant LN organotrophic metastasis rates were also observed for SCLC (729/1,502, 48.5%) and LCNEC (99/202, 49.0%) than ADC (2297/6701, 37.1%). In the pancreas, NEC (24/60, 40.0%) exhibited a significantly higher distant LN organotrophic metastasis rate (P = 0.037) than ADC (304/1,102, 27.6%). In the colorectum, NET (12/35, 34.3%) showed a significantly higher bone organotrophic metastasis rate (P < 0.001) than ADC (641/6,040, 10.6%). In the uterine cervix, NEC (12/24, 50.0% and 8/24, 33.3%, respectively) had significantly higher bone and CNS organotrophic metastasis rates (P = 0.003 and P < 0.001, respectively) than ADC (24/116, 20.7% and 6/116, 5.2%, respectively). Uterine cervical NEC (5/24, 20.8%) also had a significantly higher pleural organotrophic metastasis rate (P = 0.048) than ADC (8/116, 6.9%).
DISCUSSION
Among gastroenteropancreatic NETs, colorectal NET was the most common NET in this study, followed by gastric NET, small intestinal NET, and pancreatic NET. Similarly, low metastasis rates (2.2–5.6%) were observed for all gastrointestinal NETs, including small intestinal NETs, which were significantly lower (P < 0.001) than those of pancreatic NETs (34%). These findings are consistent with previous reports from South Korea, China, and Japan.15161718 In contrast, previous studies from the United States and Sweden reported small intestinal NETs to be the most common NET among gastroenteropancreatic NETs.419 Small intestinal NETs also have significantly higher metastasis rates than other gastrointestinal NETs.34 The cause of this difference, especially regarding the incidence of small intestinal NETs, is unknown. One study from the United States reported significant racial/ethnic disparities in the incidence of gastrointestinal NETs,20 although Asians were not included in that study.
Higher liver organotrophic metastasis rates were identified for all NENs in this study, including NENs originating from outside of the abdominal cavity. Although small intestinal NETs, gallbladder NECs, pancreatic NETs, gastric NETs and small intestinal NECs did not show statistically significant differences in liver organotrophic metastasis rates, we believe that these results are due to the small number of patients included. Several previous studies have also reported high liver metastasis rates for NEN or NET.346 However, in this study, we first showed that both NETs and NECs exhibit liver organotropic metastasis, with no significant differences in liver organotrophic metastasis rates between NETs and NECs from the same primary organ.
What is the cause of the liver organotropic metastasis of these NENs? NETs and NECs are known to have quite different biological and genetic characteristics; indeed, only neuroendocrine differentiation is shared by all NENs. Therefore, a reasonable approach would be to consider that the multigene program that causes neuroendocrine differentiation in tumor cells might have a major role in liver organotropic metastasis. Unfortunately, the exact mechanisms of neuroendocrine differentiation remain unclear. Nevertheless, liver metastases of NENs usually occur as multiple nodules,21 and previous studies have reported that a careful pathologic examination of hepatic metastatectomy specimens frequently reveals micrometastases that are undetectable by a radiologic examination.22 In our opinion, these findings suggest that tumor cells of NENs more easily extravasate and colonize the liver parenchyma. We also found that the liver organotrophic metastasis rate of NENs increases in proportion to the increase in the liver organotrophic metastasis rate of non-NEC from the same primary site, suggesting that mechanical accessibility to the liver is important for liver organotropic metastasis. Interestingly, a recent study reported that pancreatic NETs are divided into subgroups with different risks of liver metastasis based on the results of a genetic analysis.23 Further investigation is needed.
Lower peritoneal organotrophic metastasis rates were identified for pancreatic NEC and gastric NEC. All pulmonary NENs, including pulmonary NET, SCLC, and LCNEC, showed lower pleural organotrophic metastasis rates than pulmonary ADC. Although the remaining intraperitoneal NENs did not show significantly lower peritoneal organotrophic metastasis rates, we propose that these results are also due to the small number of patients included. For example, when we combined the colorectal NET group and NEC group to form the colorectal NEN group, the colorectal NEN group showed significantly lower peritoneal organotrophic metastasis rates than the colorectal ADC group. In our opinion, lower pleural/peritoneal metastasis rates are probably associated with the morphologic characteristics of the tumor border. NENs tend to display a pushing border, which is less invasive than the infiltrative border frequently exhibited by ADCs.24
Lower lung organotrophic metastasis rates were identified for MTC, colorectal NET, and colorectal NEC. Gallbladder NEC, gastric NET, small intestinal NET, and small intestinal NEC did not undergo lung metastasis. This result is interesting because the lung is one of the common target organs of metastasis and one of the common primary organs of NENs. A previous study including gastroenteropancreatic NET and pulmonary NET reported similar results.4
Additionally, we identified several differences in metastatic patterns between NEN and non-NEN specific for each primary site. After reviewing previous studies, we concluded that some of these differences are not caused by NENs but rather by the characteristics of non-NEN tumors at each primary site. For example, MTC showed a higher bone organotrophic metastasis rate than PTC in this study, and a previous study reported a lower bone organotrophic metastasis rate for PTC than for other thyroid carcinomas, including follicular thyroid carcinoma and MTC.25 Similarly, pulmonary NENs showed a lower bone organotrophic metastasis rate than pulmonary ADCs. Several previous studies have reported that pulmonary ADC has a higher bone organotrophic metastasis rate than other types of pulmonary carcinoma.26 Regardless, some differences cannot be explained by the characteristics of non-NENs.
A higher bone organotrophic metastasis rate for colorectal NETs was identified in this study. This result is consistent with a previous study.4 When we compared colorectal NEN and ADC to other gastrointestinal neoplasms, the bone metastasis rate of colorectal NET was unusually high, although the bone metastasis rate of colorectal ADC was similar to that of other gastrointestinal ADCs. Therefore, we conclude that the higher bone metastasis rate of colorectal NETs represents a characteristic specific to this tumor.
Similarly, the metastasis pattern of uterine cervical NEC, including higher bone and CNS metastasis rates, is quite unique compared to NENs from other primary sites and uterine cervical ADC. Unfortunately, we were unable to retrieve any previous studies comparing metastasis patterns among the histologically different types of uterine cervical carcinoma. Therefore, we validated this result using the data provided by the Surveillance, Epidemiology, and End Results program.27 We confirmed that NECs of the uterine cervix, endometrium, and ovary show greater tendencies toward bone, CNS, and liver organotrophic metastases.
To the best of our knowledge, this study is the first to compare metastasis patterns between NETs, NECs, and non-NENs from various primary sites. However, because this study is based on data from a single institution, the number of patients was sometimes insufficient for statistical analysis.
In conclusion, NETs and NECs from the same primary site show similar patterns of metastases among all primary sites included in this study. We also found that NENs commonly show high liver organotrophic metastasis, low pleural/peritoneal organotrophic metastasis, and low lung organotrophic metastasis rates. Site-specific differences in the metastasis pattern between NENs and non-NENs were also observed, and these differences are attributed not only to the characteristics of NENs but also the characteristics of non-NENs. Finally, we report that the metastatic pattern of uterine cervical NEC is quite different from that of uterine cervical ADC and NENs of other primary tumors. A consideration of these differences will be beneficial in the management of patients with NENs. Further studies revealing differences in metastasis patterns and the causes of these differences will be helpful for understanding the mechanism of metastasis.
 XML Download