

 PDF
PDF Citation
 Print
Print


INTRODUCTION
Drug-induced parkinsonism (DIP) is the second most common parkinsonism after Parkinson’s disease (PD) and the most common drug-induced movement disorder.12 The prevalence of DIP has increased in Korea.3 DIP is usually considered reversible by discontinuing offending drugs. However, because DIP is sometimes clinically indistinguishable from PD, diagnosis is challenging.4567
Because of nigrostriatal dopaminergic dysfunction in PD, dopamine transporter (DAT) imaging can be used to assess and differentiate DIP from PD.8 Despite the clinical benefit, DAT applicability may be limited due to cost, radiation hazard, long waiting time from isotope injection to start of imaging, and the necessity of special equipment such as positron emission tomography (PET) or single photon emission computed tomography.4 Therefore, another discriminating method is needed.
Optical coherence tomography (OCT) is a non-invasive and non-contact transpupillary imaging technology providing high-resolution, cross-sectional images of the retina.9 OCT advantages include low cost, no radiation hazards, and easy access.10 OCT measurements were suggested as an imaging biomarker for PD because the retina can reflect brain pathology and PD-related retinal degeneration.10 Although inconsistent results have been found,1112 retinal thinning in PD1314 and its correlation with disease duration and motor severity have been reported.1415
Asymmetric motor symptoms are considered a typical feature in PD and are correlated with DAT imaging. This asymmetricity correlated with interocular asymmetry of OCT findings in our previous study.9 Although 13–48% of DIP patients reportedly had asymmetric onset, DIP is classically described as symmetric parkinsonism.116 Therefore, we hypothesized that asymmetric interocular OCT findings would be more frequent in PD than in DIP subjects.
Because DIP is reversible, we hypothesized that there would be no retinal degeneration in DIP; therefore, OCT could be used to differentiate DIP from PD. The aim of this study was to explore difference in OCT imaging between DIP and PD. Because asymmetric motor symptoms are considered a typical feature in PD and are correlated with DAT imaging, we also compared the interocular asymmetry of OCT imaging between DIP and PD patients. Furthermore, we evaluated the correlation of interocular asymmetry with asymmetricity of DAT findings in PD and DIP.
METHODS
Patients
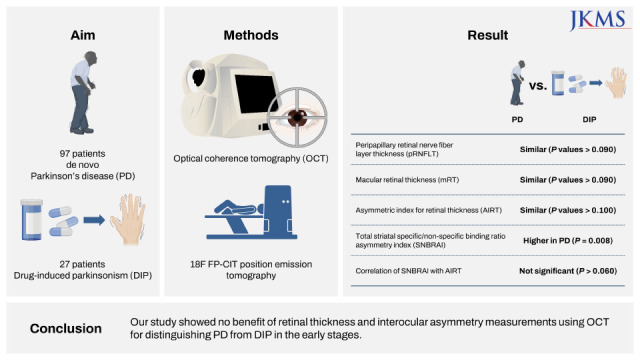
We consecutively examined 97 patients with de novo PD and 27 DIP patients who visited our hospital from 2012 to 2021. PD was diagnosed according to the UK Brain Bank criteria.17 DIP was diagnosed based on the following criteria418: 1) the presence of at least two of the four cardinal symptoms of parkinsonism, 2) absence of parkinsonism prior to exposure to offending drugs, 3) resolution of or significant improvement in parkinsonism within 12 months after withdrawal of offending drugs, 4) no alternative explanation for parkinsonism, and 5) normal symmetric DAT binding in the caudate nucleus and putamen on 18F-fluorinated-N-3-fluoropropyl-2-b-carboxymethoxy-3-b-(4- iodophenyl) nortropane (18F-FP-CIT) PET. We collected Hoehn and Yahr stage, the Unified Parkinson’s Disease Rating Scale (UPDRS) part I–III, results of the Korean version of the Mini-Mental State Examination (K-MMSE) and the Korean version of the Montreal Cognitive Assessment (K-MoCA), education, disease duration, and Beck depression inventory (BDI) at diagnosis. The exclusion criteria were dementia (K-MMSE < 2.5th percentile for age and educational-appropriate norm); comorbid ophthalmic pathologies capable of affecting retinal thickness such as glaucoma, age-related macular degeneration, diabetic retinopathy, retinal vein or artery occlusion, epiretinal membrane, macular hole, and high myopia (defined as spherical equivalent > −6.0 diopters or glaucomatous optic neuropathies); media opacity impeding acquisition of high-quality OCT images; or inability to undergo OCT examination. Eyes that had undergone ocular surgery other than cataract extraction were also excluded. Glaucomatous eyes were excluded based on intraocular pressure > 21 mmHg, narrow anterior chamber angles at gonioscopy, cup-to-disc ratio > 0.6, and glaucomatous appearance of the optic discs (defined as fellow eye asymmetry in cup-to-disc ratio > 0.2, neuroretinal rim thinning, disc hemorrhages, or retinal nerve fiber layer defects).
Ophthalmic evaluation
All participants underwent complete ophthalmologic examinations as previously described.9 We obtained peripapillary retinal nerve fiber layer thickness (pRNFLT) and macular retinal thickness (mRT) using spectral-domain optical coherence tomography (SD-OCT, Spectralis; Heidelberg Engineering, Heidelberg, Germany). The automatic eye-tracking technology maintains fixation on the retina. Only well-centered images with a signal strength > 20 dB were used for analysis. The details of SD-OCT measurements were previously described as undermentioned.9 The pRNFLT was measured around the optic disc with 16 averaged consecutive circular B-scans (diameter of 3.5 mm, 768 A-scans). The pRNFLT (from the inner margin of the internal limiting membrane to the outer margin of the RNFL) was automatically segmented using Spectralis software version 5.3.3.0. pRNFLT data were collected on the RNFL in each of the superior, inferior, temporal, and nasal sectors. We acquired the mRT topographic maps via raster images of 31 high-resolution B scans covering a 30° × 25° area centered on the fovea. We defined the mRT as the distance between the surface line of the NFL and hyporeflective line above the retinal pigment epithelium with the automatic segmentation algorithms of the Spectralis software. Spectralis SD-OCT measured the macular thickness in 1, 3, and 6 mm circles. These were divided into 9 regions: a center circle of 500 mm radius and inner and outer rings, each divided into 4 quadrants based on the Early Treatment of Diabetic Retinopathy Study. The mRT values of the central, superior inner, inferior inner, temporal inner, nasal inner, superior outer, inferior outer, temporal outer, and nasal outer regions were reported. The mRT of each superior, inferior, nasal, and temporal area was applied to the analysis of the average value of the measured mRT at the 3 and 6 mm circles: superior 3 mm + superior 6 mm = mean superior mRT. We used the same method to calculate the mean inferior, temporal, and nasal mRT.
We calculated interocular differences of pRNFLT and mRT in both eyes, as in a previous study.9 Asymmetric index (%) for retinal thickness (AIRT) was calculated using the following equation: (a−b/a+b) × 2 × 100, where a represents the more affected side of the eye and b represents the less affected side of the eye.
Quantitative analysis of 18F-FP-CIT PET
18F-FP-CIT PET images were obtained 180 minutes after injection of 18F-FP-CIT (7 mCI; 259 MBq) with a Biograph mCT S (64)-3R PET/CT scanner (Siemens Medical Solutions USA, Inc., Malvern, PA, USA) with three-dimensional resolution of 4.42 mm full width at half-maximum. Quantitative analyses were done following previously described methods.1920 Image processing was executed using SPM12 (Wellcome Department of Imaging Neuroscience, Institute of Neurology, University College London, London, UK) with MATLAB 2018a for Windows (MathWorks, Natick, MA, USA). We defined volumes of interest (VOIs) according to an FP-CIT PET template in standard space of the Montreal Neurology Institute (MNI) template. All reconstructed PET images were spatially normalized to Talairach space with a standard 18F-FP-CIT PET template produced from 18F-FP-CIT PET and T-1 MR images of 13 normal controls. As in a previous study, 12 VOIs (left and right ventral striatum, anterior/posterior caudate, anterior/posterior/ventral putamen) of bilateral striatal subregions and one occipital VOI were drawn on a co-registered spatially normalized single T-1 MR and 18F-FP-CIT PET template image on MRIcro version 1.37 (Chris Rorden, Columbia, SC, USA).20 The striatum was segmented into the anterior caudate, posterior caudate, ventral striatum, anterior putamen, and posterior putamen.21
We determined the VOI for the ventral striatum by previously defined criteria,21 and the boundary between the anterior and posterior putamen as the anterior commissure of the coronal plane. The outer boundaries of the striatal subregions were visually set by the characteristic dense grey signal of the striatum, readily distinguishing these subregions from adjacent structures. The anterior/posterior division of putamen was set by the anterior commissure in the MNI template space. A minor translation in our in-house editing software called ANTIQUE were used for the adjustment of the VOI.22 We calculated DAT activity with the specific/non-specific binding ratio (SNBR), defined as mean standardized uptake value of the striatal subregions VOI − mean standardized uptake value of the occipital VOI/mean standardized uptake value of the occipital VOI. 23
We calculated the total striatal SNBR asymmetry index (SNBRAI) as described in a previous study24 using the following equation: [(R−L/R+L)] × 2 × 100, where R represents the striatum contralateral to the most affected side of the body, and L represents the striatum ipsilateral to the most affected side of the body.
Statistical analysis
Data were expressed as mean ± standard deviation. Demographic and clinical variables among PD and DIP were compared. The chi-square test was used for categorical variables and unpaired t-test for continuous variables. To use both eyes of the same participant, OCT parameters between the two groups were compared using generalized estimating equation, a statistical method that compensates for inter-eye correlation in the same participant.25 We also adjusted the effect of age, disease duration, K-MMSE, education years, BDI, UPDRS part II and III. We chose these parameters, because they showed the statistical differences between two groups or possibly would affect the results, although there were no significant differences. We did not adjust the effect of K-MoCA and UPDRS part I, because these two variables were considered to be overlapped because they reflected the same clinical domain as other clinical variables (i.e., cognition and mood including depression). In the case of the AIRT of OCT parameters, PD and DIP patient comparisons were analyzed using one-way analysis of covariance (ANCOVA) for data with normal distribution and the ranked ANCOVA for data with non-normal distribution after adjusting for age and K-MMSE. Normality test was performed using skewness and kurtosis, and the acceptable values were < 3 and < 10, respectively.26 We assessed the relationship between AIRT and SNBRAI using Spearman ranked correlation. A P value < 0.0125 (0.05/4) or < 0.0056 (0.05/9) was considered significant after multiple comparison corrections for correlation analysis with pRNFLT or mRT, respectively. Otherwise, a P value < 0.05 was considered statistically significant. Statistical analysis was performed using IBM SPSS 27 statistics (IBM Corp., Armonk, NY, USA).
Ethics statement
The Institutional Review Board (IRB) of Hallym University Dongtan Sacred Heart Hospital approved this study (IRB Number: 2022-03-006). All methods were performed in accordance with the Declaration of Helsinki and followed relevant guidelines and regulations. Informed consent was obtained from all participants.
RESULTS
The patient demographics and clinical features are summarized in Table 1. Significant differences were found in age at examination, K-MMSE, K-MoCA, BDI, and UPDRS part I scores between PD and DIP patients. The mean age at examination was higher (P = 0.000), the K-MMSE and K-MoCA scores lower (P = 0.007, 0.001, respectively), and BDI and UPDRS part I values higher (P = 0.013, 0.005, respectively) in the DIP group.
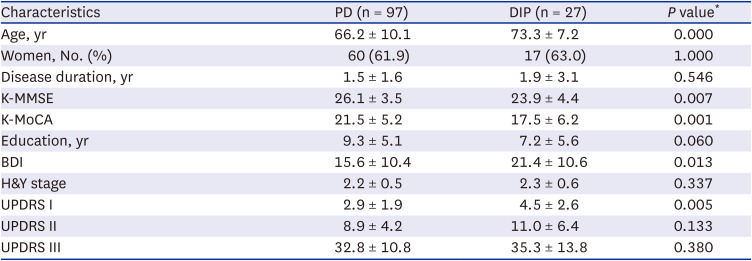
Table 1
Patients’ demographic and clinical characteristics
Values are means ± standard deviation except where indicated.
PD = Parkinson’s disease, DIP = drug-induced parkinsonism, K-MMSE = Korean version of the Mini-Mental State Examination, K-MoCA = Korean version of the Montreal Cognitive Assessment, BDI = Beck Depression Inventory, H&Y stage = Hoehn and Yahr stage, UPDRS = Unified Parkinson’s Disease Rating Scale.
*P < 0.05 indicates significant differences.
![]()
We observed no difference between PD and DIP patients in pRNFLT or mRT measurements (all P values > 0.09, Table 2). The demographics and clinical features of patients included in the asymmetric index analyses are described in Supplementary Table 1. Only patients with binocular examination data were included. The mean SNBRAI value was significantly higher in PD (12.4 ± 9.0) than in DIP (5.8 ± 2.5; F = 7.390, P = 0.008) patients; however, difference was not observed in AIRT in pRNFLT and mRT (all P values > 0.100, Table 3). We did not find any correlation of SNBRAI with AIRT of pRNFL or mRT (all P values > 0.060, Supplementary Table 2).
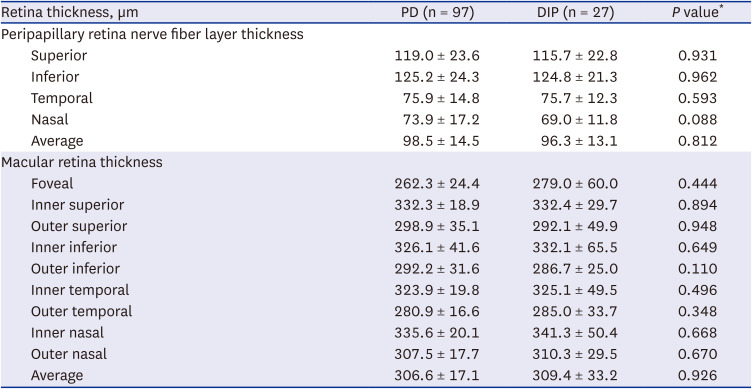
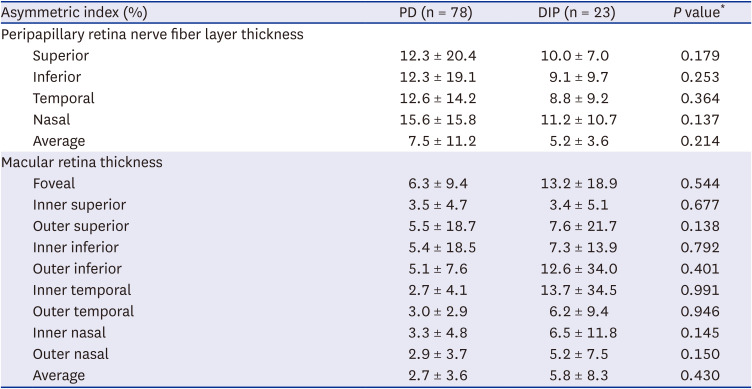
Table 2
Retina thickness between PD and DIP
Values are means ± standard deviation except where indicated.
PD = Parkinson’s disease, DIP = drug-induced parkinsonism.
*P < 0.05 indicates significant differences.
![]()
Table 3
Interocular difference of retina thickness
Values are means ± standard deviation except where indicated.
Asymmetric index (%) was [(a−b)/(a+b)] × 2 × 100 (for retinal thickness, a = more affected side of eye, b = less affected side of eye).
PD = Parkinson’s disease, DIP = drug-induced parkinsonism.
*P < 0.05 indicates significant differences.
![]()
DISCUSSION
Our results did not show any significant difference in retinal thickness or interocular asymmetry of OCT measurements between PD and DIP patients. Therefore, OCT measurements might not be a proper screening tool to differentiate early stages of PD from DIP.
The exact reason for the negative result obtained is unknown. In previous studies, variable results were also reported, although reduced retinal thickness in PD patients was frequently observed.27 These discrepancies may be due to heterogeneous PD populations,2829 disease duration,28 different states of disease,1029 different PD phenotype such as postural instability-gait disorder10 or cognition,30 and differences in imaging technologies.29 The duration of PD in previous studies was 6.7 ± 3.6 years (ranging from 0.7–18.4 years), longer than in our study. Although there was a discrepancy in the correlation between motor severity and retinal thickness, retinal abnormality appeared more frequently in advanced PD.10 All PD patients in the present study were de novo, in the early stages of PD without dementia. Because our hospital is not a tertiary referral hospital, patients in the early stage of PD were more likely to be included.
Heterogeneous DIP populations and their causative drugs (Supplementary Table 3) might be another reason for the negative results because retinal structural changes were reported in psychiatric disorders such as schizophrenia and major depression.3132 The DIP patients in the present study had depression, delusion, gastrointestinal disorders, and cardiovascular disease. In addition, antipsychotics were reported to cause retinal changes.333435
Although psychiatric disorders or antipsychotics might be influential in the retina, we assumed these influences would be symmetric because the effect of the drugs is systemic and the clinical manifestations of DIP are generally bilateral, symmetric parkinsonism.1 The interocular asymmetry in PD was previously reported36 and correlated with motor asymmetry.9 Therefore, we hypothesized that the interocular asymmetric index might discriminate between PD and DIP patients; however, this hypothesis was not proven in this study. Furthermore, because the SNBRAI values did not correlate with the AIRT in PD patients, the clinical significance of the AIRT as a screening method should be further investigated.
The present study had several limitations. First, healthy controls were not included. It would be of interest to see how DIP differ from healthy controls when then compared to PD patients next. Second, the number of DIP patients was relatively small. However, the advantages of the study were that only de novo PD patients were included and the studied patients had no dementia or other comorbid ophthalmic pathologies. In addition, the DAT imaging data were included in the analysis. Third, age might affect our results, although we adjusted the effect of age for our analysis because DIP patients were much older than de novo PD patients. A recent population-based large study with Asian ethnic groups showed that most of the retinal layers decreased with age.37
In conclusion, the retinal thickness and the interocular asymmetry measurements do not appear useful for distinguishing PD from DIP in the early stages, and further studies with age/gender-matched de novo PD patients are needed for confirmation.
 XML Download