

 PDF
PDF Citation
 Print
Print


INTRODUCTION
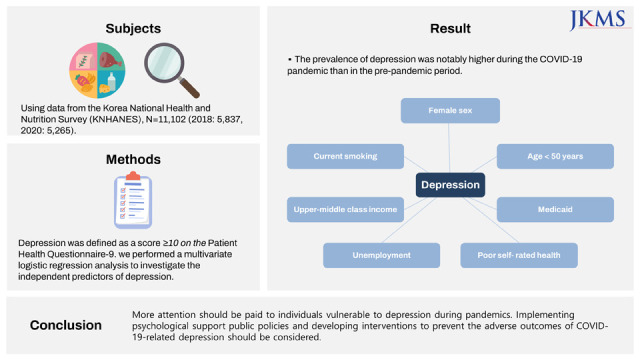
The global coronavirus disease 2019 (COVID-19) pandemic has affected the daily lives of people worldwide in unprecedented ways.1 As of July 2022, more than 559 million people have been infected with COVID-19, resulting in at least 6.3 million deaths globally.1 In addition to the fear of being infected or transmitting the disease, the COVID-19 pandemic resulted in new social situations as most of countries have implemented various infection control policies, such as “social distancing,” “staying at home,” “temporary school suspensions,” “international travel ban,” and “limit on private gatherings.”2345 Furthermore, there was a significant rise in the number of unemployed workers during the pandemic.6 The COVID-19 pandemic itself has been a traumatic stressor for many people, evoking post-traumatic stress disorder-like responses and other associated mental health problems such as depression, anxiety and stress symptoms in some people.7 In fact, a number of previous studies from various countries have reported that the prevalence of depression noticeably increased during the pandemic.89101112 However, studies that measured and compared the prevalence of depression before and during the COVID-19 pandemic using nationally representative data are lacking. Furthermore, knowledge of the factors affecting depression during the COVID-19 crisis is important to understanding the psychological effects of pandemics of highly contagious, life-threatening infectious diseases, such as COVID-19 and to prepare for future pandemics.1013 Therefore, we aimed to estimate and compare the prevalence of depression before and during the COVID-19 pandemic using data from the Korea National Health and Nutrition Survey (KNHANES), a nationally representative population-based survey. In addition, we investigated factors associated with depression during the COVID-19 pandemic to provide meaningful insights into the prevention and management of depression during the ongoing pandemic.
METHODS
Data source and study population
The KNHANES is a cross-sectional nationwide surveillance program conducted annually by the Korea Disease Control and Prevention Agency (KDCA) since 1998. This program collects detailed information on the non-institutionalized civilian population of Korea, including socio-demographic status, past medical history, anthropometric measures, biochemical profiles, and health behaviors. Data is collected through personal interviews, physical examinations, and laboratory tests. The KNHANES sampling plan follows a complex, stratified, multistage, probability-cluster to select a nationally representative sample of Korean civilians.1415 Since the 9-item Patient Health Questionnaire (PHQ-9) was included in the survey in even numbered years, we analyzed the KNHANES 2018 and 2020 to measure and compare the prevalence of depression among Korean adults before and during the COVID-19 pandemic. After excluding those with missing data for any of the study variables, 5,837 participants aged ≥ 19 years were selected from the KNHANES 2018 and 5,265 were selected from the KHNANES 2020.
Study variables
The prevalence of depression, the outcome variable of this study, was defined as the proportion of participants with a PHQ score of 10 or greater, a standard cut-off score for identifying depression.16 The accuracy and validity of the PHQ-9 for the detection of major depressive disorder has been well-established as a PHQ-9 score ≥ 10, with a sensitivity of 88% and a specificity of 88%.1617 The depression status of participants was classified into 3 categories according to the severity of depression based on the PHQ-9 scores (PHQ-9 < 10, no depression; 10–19, moderate depression; and 20–27, severe depression).17
Factors associated with depression were classified into 3 domains: sociodemographic, health status, and health behavior. The sociodemographic domain comprised age, sex, marital status, number of persons living in a house, employment status, household income, residential area, and type of health insurance. Obesity status, comorbidities, and self-rated health were included in the health status domain, and the health behavior domain comprised smoking, drinking, physical activity, and regular health screening. Each variable was assembled using a self-administered questionnaire from the Health Interview Survey of KNHANES. Obesity status was assessed by computing the body mass index (BMI; m2/kg) and was categorized into 4 types based on the Korean obesity standards (BMI < 18.5 kg/m2: underweight, 18.5–22.9 kg/m2: ideal weight, 23–24.9 kg/m2: overweight, and ≥ 25.0 kg/m2: obese).18 Comorbidities were defined as a prior diagnosis of any of the following diseases by a physician: hypertension, diabetes mellitus, ischemic heart disease (myocardial infarction and angina), stroke, cancers (stomach, liver, breast, lung, cervix, and thyroid cancer), chronic pulmonary diseases (chronic obstructive pulmonary disease and asthma), liver cirrhosis, and chronic renal disease. Smoking status was classified as current smoker or non-smoker (never smoker or former smoker). Regarding drinking, participants were categorized as risky drinkers (those who consume alcohol ≥ 2 times/week with an average of ≥ 5 drinks/ occasion for men and ≥ 7 drinks/occasion for women) and non-risky drinking (non-alcoholic or those who consume alcohol less than risky drinkers).19 Physical activity status of participants was assessed using the Physical Activity Guidelines for Americans (PAG) 2nd edition. According to PAG, adults should do at least 150 minutes of moderate-intensity aerobic physical activity, 75 minutes of vigorous-intensity aerobic physical activity, or an equivalent combination of moderate and vigorous-intensity activity.20 Individuals whose physical activity self-report met these criteria were labeled as having “sufficient activity.” Finally, the regular health screening status of participants was assessed based on the self-report of questions asking whether they had undergone health check-ups within the last 2 years.
Statistical analysis
Sampling weights based on the sample design of each KNHANES were applied to all statistical analyses to present unbiased estimates representing the entire Korean population.14 The baseline characteristics of participants from KNHANES 2018 and 2020 were presented through descriptive analyses. We conducted χ2 analysis for proportions and Student’s t-test for means to determine the statistical differences in the characteristics of participants from KNHANES 2018 and KNHANES 2020. Both the overall prevalence of depression and the prevalence according to the baseline characteristics before (KNHANES 2018) and during the COVID-19 pandemic (KNHANES 2020) were compared using the χ2 test. Finally, considering the above-mentioned factors as covariates, univariate and multivariate logistic regression analyses were performed to identify factors associated with the prevalence of depression during COVID-19. Covariates with P < 0.1 in the univariate analyses were included in the multivariate analyses. All statistical analyses were performed using IBM SPSS Statistics for Windows (version 22.0; IBM Corp., Armonk, NY, USA), and statistical significance was set at P < 0.05.
Ethics statement
The present study protocol was reviewed and approved by the Institutional Review Board of Seoul St. Mary’s Hospital, Catholic University of Korea (approval number: KC22ZASI0270). The study protocol conformed to the ethical guidelines of the 1975 Declaration of Helsinki. The requirement for written informed consent was waived since all data were fully anonymized and de-identified.
RESULTS
Baseline characteristics
The baseline characteristics of the participants in KNHANES 2018 (before the COVID-19 pandemic) and 2020 (during the COVID-19 pandemic) are presented in Table 1. In terms of the sociodemographic characteristics, the unemployment rate was significantly higher in 2020 than in 2018 (36.0% vs 33.5%, P = 0.044), meaning that economic activity participation rate became relatively lower during the COVID-19 pandemic. Regarding health status, depression was significantly more prevalent during the COVID-19 pandemic than during pre-pandemic (5.2% vs. 4.3%, P = 0.043). More specifically, the prevalence of both moderate depression (PHQ-9: 10–19, 4.4% vs. 3.9%, P = 0.043) and severe depression (PHQ-9: ≥ 20, 0.8% vs. 0.4%, P = 0.043) were significantly higher during the pandemic than before (Fig. 1). The prevalence of obesity (38.7% vs. 35.3%, P < 0.001) and overweight (23.0% vs. 21.9%, P < 0.001) was also considerably higher during the pandemic than before. Chronic renal disease was the only comorbidity that was significantly more prevalent during the pandemic (1.6% vs. 0.2%; P < 0.001).
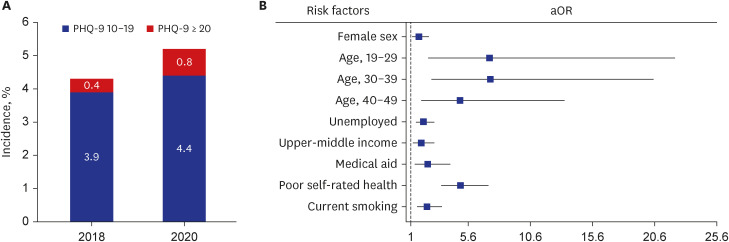
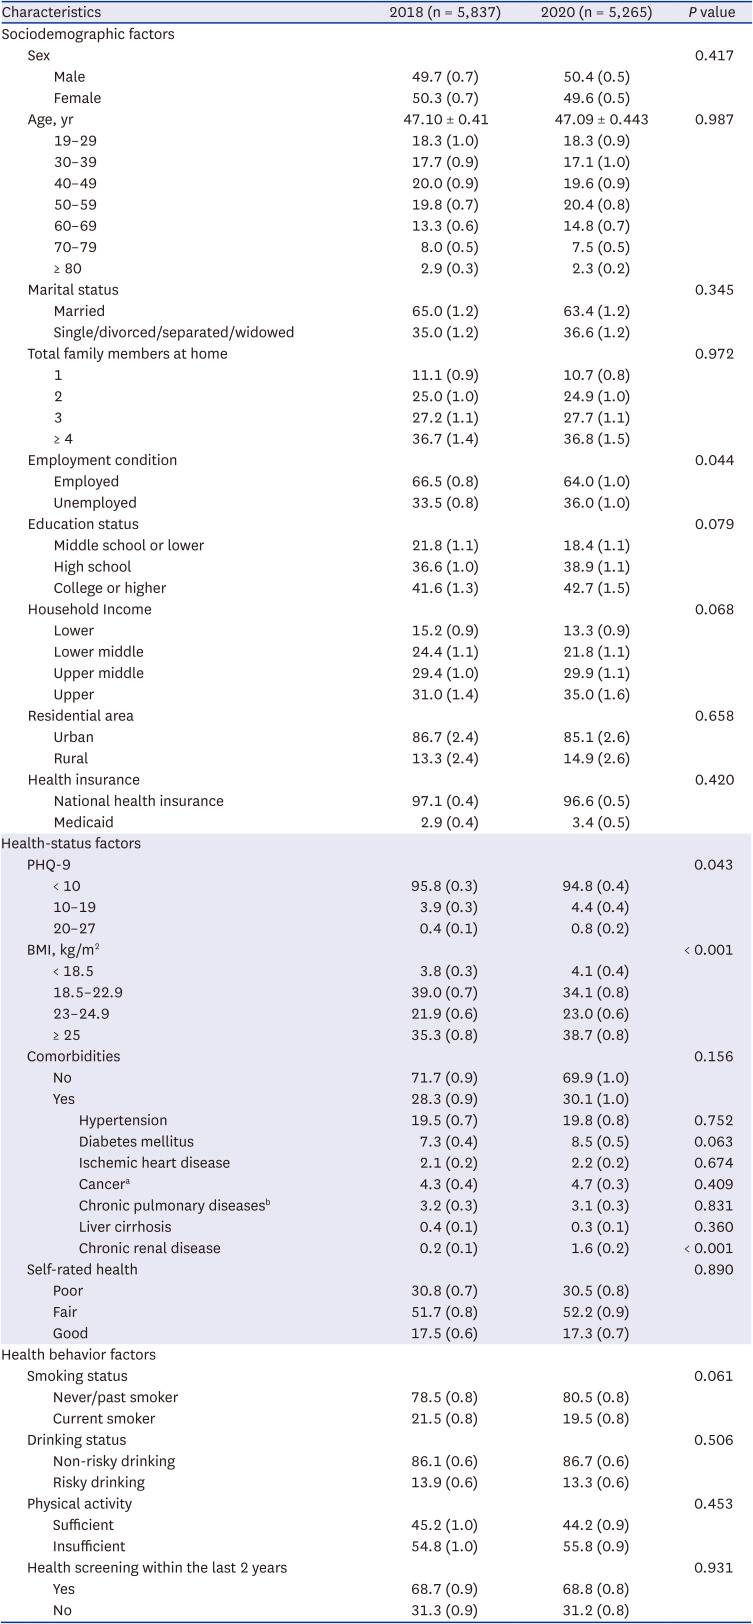
Fig. 1
Prevalence and the associated factors of depression in COVID-19 pandemic. (A) Comparison of prevalence rate of depression defined as PHQ-9 ≥ 10 between 2018 and 2020. (B) Forest plot showing aOR and 95% confidence interval of significant associated factors for depression in 2020.
COVID-19 = coronavirus disease 2019, PHQ-9 = Patient Health Questionnaire-9, aOR = adjusted odds ratio.
![]()
Table 1
Baseline characteristics of participants by survey years
All data were weighted to the Korean standard population. Values are presented as % (standard error) or mean ± standard deviations. P values were obtained by χ2 test or Student's t-test.
PHQ-9 = Patient Health Questionnaire-9, BMI = body mass index.
aStomach, liver, colon, breast, cervix, lung, and thyroid cancer; bAsthma and chronic obstructive pulmonary disease.
![]()
Prevalence of depression according to the baseline characteristics
The prevalence of depression before and during the pandemic according to baseline characteristics is presented in Table 2. In the pre-pandemic period, the prevalence of depression was significantly higher in women, single/divorced/separated/widowed individuals, medicaid beneficiaries, risky drinkers, those with comorbidities, and those who did not undergo health screening within the 2 prior years. Depression also tended to be more prevalent in individuals with lower education and income levels. Meanwhile, the prevalence of depression tended to decrease with age until the 40s, tending to increase thereafter, peaking at ≥ 80 years (8.5%). Lastly, the prevalence of depression was highest among the underweight population, and decreased as BMI increased until the point of being overweight, subsequently rising again as individuals became obese. The overall trend in depression during the pandemic was generally similar to that during the pre-pandemic period. However, during the pandemic, the prevalence of depression in men nearly doubled while women’s prevalence was mostly stationary. In terms of age, the prevalence of depression notably increased in those aged < 50 years during the pandemic and this trend was more prominent in men than women (Supplementary Table 1). The age group 20–29 years had the highest prevalence of depression, while those aged ≥ 80 years had the highest prevalence in the pre-pandemic period. Depression was also somewhat more prevalent in the upper-middle income class during the pandemic; in contrast, lower income class was associated with a higher prevalence of depression in the pre-pandemic period. Although the overall trend of depression according to BMI during the pandemic was stationary, the prevalence among the underweight population was relatively lower. Finally, unlike the pre-pandemic period, the difference in depression according to drinking status was not significant during the pandemic, although it was significantly more prevalent among smokers.
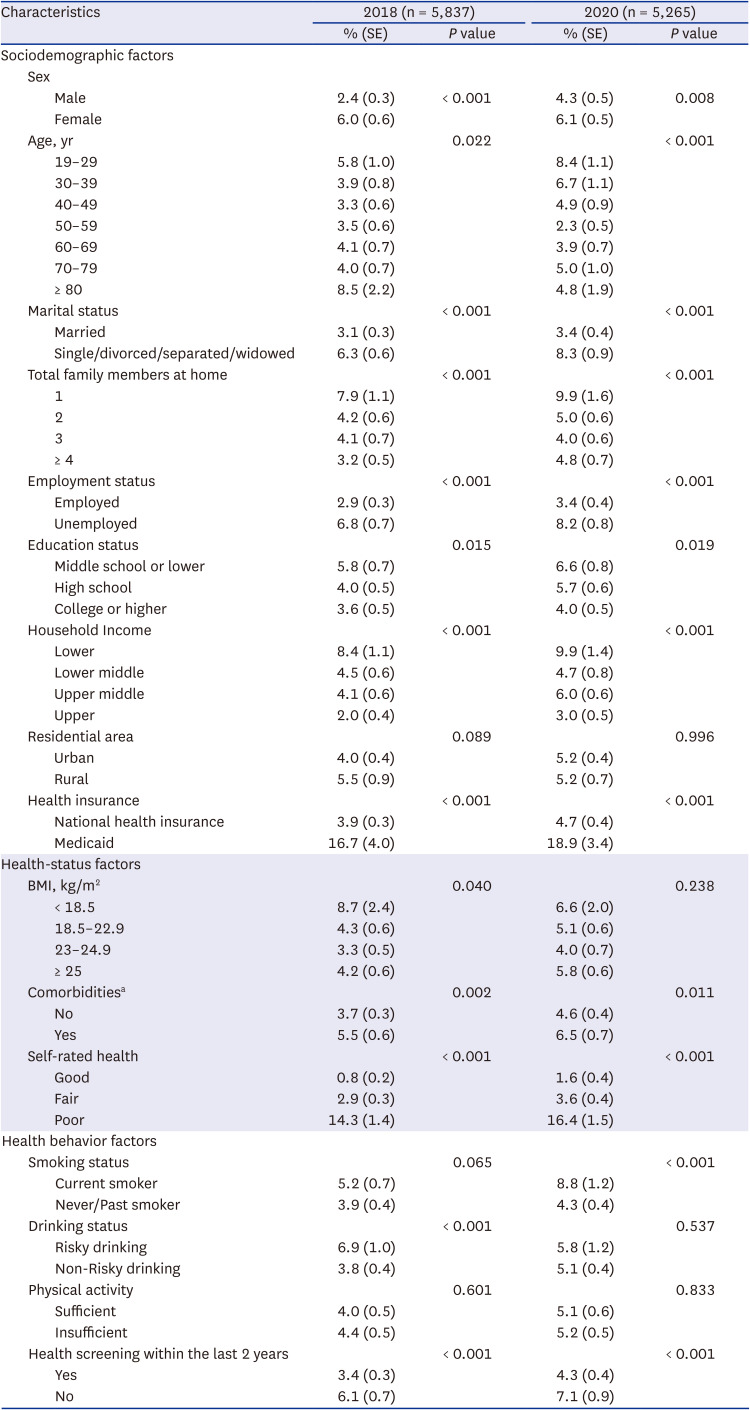
Table 2
Comparison of prevalence of depression by general characteristics
All data were weighted to the Korean standard population. P values were obtained by χ2 test.
SE = standard error, PHQ-9 = Patient Health Questionnaire-9, BMI = body mass index.
aComorbidities: hypertension, diabetes mellitus, dyslipidemia, ischemic heart disease, stroke, cancer, chronic pulmonary disease, liver cirrhosis, and chronic renal disease.
![]()
Factors associated with depression before and during the pandemic
The results of the univariate and multivariate analyses of factors influencing depression during the COVID-19 pandemic are presented in Table 3. All variables except for residential area, drinking status, and physical activity were included in the multivariate analysis. This analysis revealed that female sex (adjusted odds ratio [aOR], 1.63; 95% confidence interval [CI], 1.10–2.41), age < 50 years (19–29 years: aOR, 7.31; 95% CI, 2.40–22.21; 30–39 years: aOR, 7.38; 95% CI, 2.66–20.47; 40–49 years: aOR, 4.94; 95% CI, 1.84–13.31 compared to ≥ 80 years), unemployment (aOR, 2.00; 95% CI, 1.41–2.85), upper-middle class income (aOR, 1.83; 95% CI, 1.18–2.85 compared to upper-class income), being a beneficiary of Medicaid (aOR, 2.35; 95% CI, 1.33–4.14), poor self-rated health (aOR, 4.99; 95% CI, 1.51–3.47 compared to fair self-rated health), and current smoking (aOR, 2.29; 95% CI, 1.51–3.47) were independent risk factors for developing depression (Fig. 1).
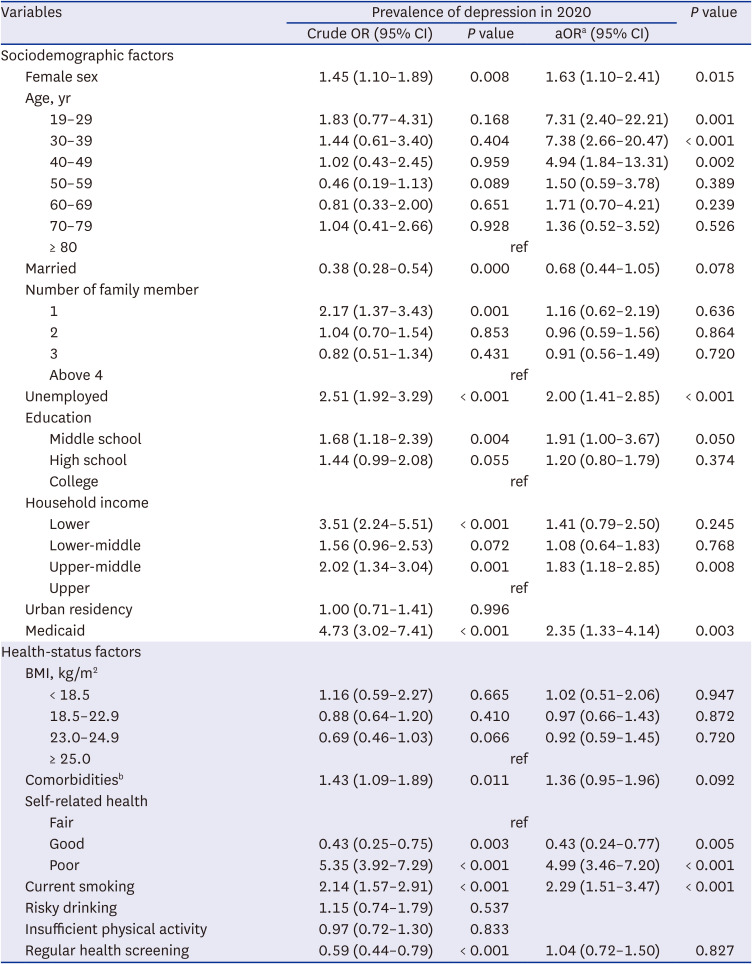
Table 3
Factors associated with prevalence of depression during the COVID-19 pandemic
All data were weighted to the Korean standard population. Analyses were performed by univariate and multivariate logistic regression models.
COVID-19 = coronavirus disease 2019, OR = odds ratio, aOR = adjusted odds ratio, CI = confidence interval, BMI = body mass index.
aAdjusted for age, sex, marital status, education status, employment status, household income, residential area, type of health insurance, BMI, hypertension, diabetes mellitus, dyslipidemia, ischemic heart disease, stroke, cancer, chronic pulmonary diseases, liver cirrhosis, chronic renal disease, level of self-related health, smoking status, drinking status, physical activity status and receiving regular health check-ups.
bComorbidities: hypertension, diabetes mellitus, dyslipidemia, ischemic heart disease, stroke, cancer, chronic pulmonary disease, liver cirrhosis, and chronic renal disease.
![]()
DISCUSSION
In this nationally representative cross-sectional study, survey respondents in the pandemic era were found to be significantly more depressed than those in the pre-pandemic era. This trend was consistent with the results of previous studies in other countries, which also showed increase in depression.89 The detrimental impact of the COVID-19 pandemic on the mental health of the general population has been frequently demonstrated in earlier research.21 Thus, it is important to recognize individuals’ mental problems during the pandemic and to implement public policies for emotional support, especially for those who are particularly vulnerable to psychological stress.2223 Regarding the independent risk factors of depression during the pandemic, our multivariate logistic regression analysis revealed that women, those younger than 50 years, unemployed, upper middle class, current smokers, and those with subjective poor health were at significantly higher risk of developing depression.
Specifically, compared with men, women are generally known to have higher incidence of depression and present a more chronic disease course.2425 Greater vulnerability to depression in females has been extensively observed worldwide during the COVID-19 pandemic.26 The entire pandemic situation would have been more burdensome to women, both socially and economically.26 Extra parenting and household duties due to school closures or family members’ COVID-19 infection are most commonly assigned to women.2627 Moreover, compared with men, women have lower salaries and poorer job security, and thus, are more likely to face tougher financial struggles during the pandemic.2829 These circumstances presumably caused women to be more depressed during the COVID-19 pandemic.
In terms of age, our findings demonstrated that participants younger than 50 years were more likely to experience depression during the COVID-19 pandemic. Recent studies have shown similar results, indicating that younger individuals were more vulnerable to depression globally during the COVID-19 pandemic.3031 Conversely, pre-pandemic studies have reported increasing age as a risk factor for depression.3233 This discrepancy is likely due to differences in social engagement between young and older adults before the pandemic. In normal times, younger people are less likely to be lonely due to their active social life, whereas older people may have already felt emotionally isolated through retirement or widowing.31 Thus, a sudden reduction in social activity due to lockdown and social distancing likely gave younger individuals more emotional blows compared to older adults.31
Regarding socioeconomic factors, unemployment and Medicaid paid status, which are conventional risk factors for depression,3435 were persistently associated with an increased risk of depression during the COVID-19 pandemic. Interestingly, in terms of household income, upper middle-class families were more likely to develop depression during the pandemic. The Korean government’s primary goal during the beginning of the pandemic was to prevent the spread of the disease through strict social distancing.36 Consequently, the overall household economy collapsed, which led to a financial crisis in many middle-class families who had previously been relatively stable.37 The lower income class families also financially collapsed during the pandemic. However, compared to lower middle- and lower-income class families who were already financially struggling, the psycho-emotional impact on the upper middle-class families was likely stronger owing to the sudden economic fallout during the pandemic. We believe that this situation increased the vulnerability of the upper middle class to depression.
Our study also revealed that smoking was notably associated with an increased risk of depression during the pandemic. A recent UK study based on a nationwide survey confirmed a significant association between deteriorated mental health and increased smoking during the COVID-19 pandemic.38 Perceived stress is a well-known factor that triggers initiation and relapse of smoking,3940 and the causal relationship between stressful events and depression has been well-documented.41 Therefore, various stresses induced by the COVID-19 pandemic, such as fear of infection, loneliness, and economic struggles, likely led to depression and increased tobacco consumption.
Lastly, poor self-rated health is not only a well-known risk factor for developing depressive symptoms, but is associated with poor long-term prognosis in those with depression.4243 This trend was consistently observed in our study participants during the pandemic.
This study has several limitations. First, since the KHNANES is conducted annually with different participants, we were not able to compare the depression status of identical individuals before and during the pandemic. However, the fact that each year of the KHNANES provides nationally representative data that objectively reflects the status of participants during that particular year makes it suitable for evaluating trends in the prevalence of depression before and during the pandemic and for analyzing associated factors. Second, owing to the nature of the cross-sectional study design, we were unable to track the long-term mental health status of participants throughout the ongoing pandemic. Thus, further longitudinal follow-up studies will be necessary to evaluate how the introduction of COVID-19 vaccines and prolonged social distancing policies has affected and changed the psychological status of individuals as the pandemic progressed. Last, since the KNHANES data were mostly obtained via self-reported surveys, response bias and recall errors may have occurred.
In this nationally representative study, we found that depression was significantly more prevalent among Korean adults during the COVID-19 pandemic than in the pre-pandemic era. In terms of factors predicting depression during the pandemic, female sex, age < 50 years, upper-middle-class household income, poor self-rated health, and smoking were all independent risk factors for depression. This indicates that more attention should be paid to individuals’ mental health during the pandemic. Implementing public policies for psychological support and developing interventions to prevent the adverse outcomes of COVID-19 related depression should also be considered.
 XML Download