Journal List > J Korean Med Sci > v.38(10) > 1516081827

Bae, Kim, Kim, Kim, Yong, Ha, Ryoo, Uh, Shin, Lee, Sohn, Shin, and Kim: Changing Epidemiology of Pathogenic Bacteria Over the Past 20 Years in Korea

Abstract

Background

The epidemiology of pathogenic bacteria varies according to the socioeconomic status and antimicrobial resistance status. However, longitudinal epidemiological studies to evaluate the changes in species distribution and antimicrobial susceptibility of pathogenic bacteria nationwide are lacking. We retrospectively investigated the nationwide trends in species distribution and antimicrobial susceptibility of pathogenic bacteria over the last 20 years in Korea.

Methods

From 1997 to 2016, annual cumulative antimicrobial susceptibility and species distribution data were collected from 12 university hospitals in five provinces and four metropolitan cities in South Korea.

Results

The prevalence of Staphylococcus aureus was the highest (13.1%) until 2012 but decreased to 10.3% in 2016, consistent with the decrease in oxacillin resistance from 76.1% in 2008 to 62.5% in 2016. While the cefotaxime resistance of Escherichia coli increased from 9.0% in 1997 to 34.2% in 2016, E. coli became the most common species since 2013, accounting for 14.5% of all isolates in 2016. Pseudomonas aeruginosa and Acinetobacter baumannii rose to third and fifth places in 2008 and 2010, respectively, while imipenem resistance increased from 13.9% to 30.8% and 0.7% to 73.5% during the study period, respectively. Streptococcus agalactiae became the most common pathogenic streptococcal species in 2016, as the prevalence of Streptococcus pneumoniae decreased since 2010. During the same period, pneumococcal penicillin susceptibility decreased to 79.0%, and levofloxacin susceptibility of S. agalactiae decreased to 77.1% in 2016.

Conclusion

The epidemiology of pathogenic bacteria has changed significantly over the past 20 years according to trends in antimicrobial resistance in Korea. Efforts to confine antimicrobial resistance would change the epidemiology of pathogenic bacteria and, consequently, the diagnosis and treatment of infectious diseases.

Graphical Abstract

jkms-38-e73-abf001.jpg

INTRODUCTION

The epidemiology of infectious diseases is influenced by many factors, such as the socioeconomic status, population composition, and healthcare practices, including antimicrobial usage.123 Because many industrialized countries, including Korea, have experienced rapidly changing societal and medical circumstances, a change in the epidemiology of infectious diseases is presumed, and nationwide data are needed.
The emergence and transmission of antimicrobial-resistant bacteria have been one of the most significant medical issues in recent decades. From the worldwide spread of methicillin-resistant Staphylococcus aureus (MRSA)3 to the emergence of antimicrobial resistance, such as carbapenemase-producing Enterobacterales,4 monitoring of antimicrobial resistance based on the epidemiology of pathogens has become a national public health issue designated by the World Health Organization.5
Since South Korea joined the Organisation for Economic Co-operation and Development in October 1996, its gross domestic product has tripled over 20 years. The age-standardized mortality rate from infectious diseases decreased from 43.5/100,000 in 1983 to 16.5/100,000 in 1996; however, it rose again to 44.6/100,000 in 2015.6 Despite the extreme decline in the incidence of tuberculosis and intestinal infections, an increase in the number of senior citizens aged 65 years and over has increased mortality in the last two decades. During the same period, the emergence of various multidrug-resistant pathogenic bacteria has threatened public health.5 Longitudinal epidemiological studies to understand the changes in species distribution and antimicrobial susceptibility of pathogenic bacteria nationwide are lacking. Thus, the aim of this study was to collect and retrospectively analyze data over 20 years from clinical microbiology laboratories of 12 university hospitals in South Korea.

METHODS

Participating laboratories

For this study, 12 clinical microbiology laboratories were recruited from 10 tertiary care hospitals and two secondary care hospitals so that each South Korean region could be evenly covered.

Microbiologic data

From 1997 to 2016, data on the number of isolates and patients and antimicrobial susceptibility for 11 species, including S. aureus, Escherichia coli, Klebsiella pneumoniae, Pseudomonas aeruginosa, Acinetobacter baumannii, Enterococcus faecium, Enterococcus faecalis, Streptococcus pneumoniae, Streptococcus pyogenes, Streptococcus agalactiae, Haemophilus influenzae were collected annually from the laboratory information system. All susceptibility data were analyzed except those for the surveillance isolates. Susceptibility data were interpreted based on Clinical and Laboratory Standards Institute M100-S27 using WHONET software.7 Susceptibility data were analyzed for the first isolate per patient when there were more than 30 patients per species in one laboratory. The susceptibility of S. pneumoniae to penicillin and cefotaxime was analyzed by dividing the cases according to meningitis or non-meningitis criteria.

Statistical analysis

For trend analysis, the ratios of the number of isolates of E. coli to S. aureus (E/S ratio) and A. baumannii to P. aeruginosa (A/P ratio), % cefotaxime-resistant E. coli to % oxacillin-resistant S. aureus (CREC/MRSA ratio), and % imipenem-resistant A. baumannii to % imipenem-resistant P. aeruginosa (IRAB/IRPA ratio) were compared annually. The correlation analysis between the ratios was performed using Spearman’s rank correlation coefficient (ρ) using Statistical Package for the Social Sciences (ver. 18.0; SPSS, Chicago, IL, USA).

RESULTS

Data collection in participating laboratories

As the number of participating laboratories increased from 2 in 1997 to 12 in 2010, the data collection period varied from 7 to 20 years (Supplementary Table 1). The annual number of isolates was 42,800 in 1997 and 290,500 in 2010. In 2016, the number of isolates increased to 324,700. A total of 3,733,938 isolates were analyzed for each species or genus during the study period.

Trends of species distribution

S. aureus was the most common species in 1997–2012 and the second most common in 2013–2016 (Fig. 1A). The number of S. aureus isolates was 38,000 in 2012 and then decreased to 33,000 in 2016. The frequency of E. faecium increased in rank from 18th in 1997 to 6th in 2016, whereas the frequency of E. faecalis increased more slowly than that of E. faecium.
Fig. 1

Trend of species distribution of major pathogenic bacteria in (A) total isolates and (B) blood isolates for 20 years from 1997 to 2016.

jkms-38-e73-g001
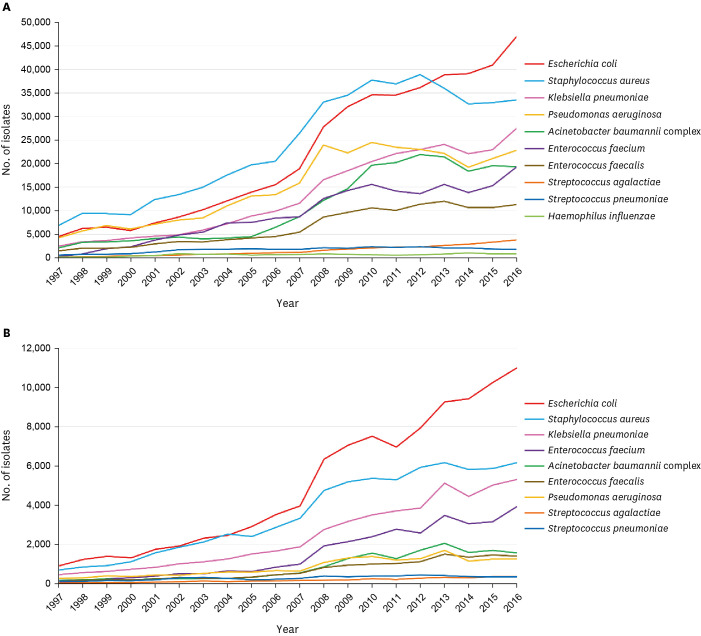
E. coli was the second most common species in 2001–2012 and the most common species in 2013–2016 (Fig. 1A). The number of K. pneumoniae continued to increase to exceed the number of P. aeruginosa isolates in 2012 and has been the third most common species since 2013. The frequency of P. aeruginosa increased in the early decade, whereas that of A. baumannii rapidly increased from 2005 to 2010.
The number of S. pneumoniae isolates did not change since 2002, and the frequency rank decreased from 11th in 2002 to 18th in 2016 (Fig. 1A). The number of S. agalactiae isolates continued to increase to twice that of S. pneumoniae isolates in 2016. H. influenzae was ranked 25th during the study period.
The species distribution in blood isolates showed slightly different trends compared with the total species distribution. E. coli was the most common species isolated from blood during the entire study period, except in 2004, when S. aureus ranked first (Fig. 1B). While the frequencies of P. aeruginosa and A. baumannii showed a gradual increase among blood isolates during the entire study period. E. faecium was isolated more frequently than both P. aeruginosa and A. baumannii since 2004 and the frequency of E. faecium markedly increased to become greater than frequencies of the two combined in 2016.

Cumulative antimicrobial susceptibility

S. aureus and Enterococcus species

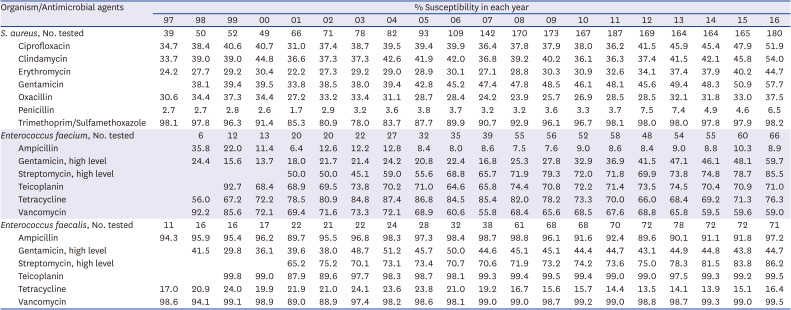
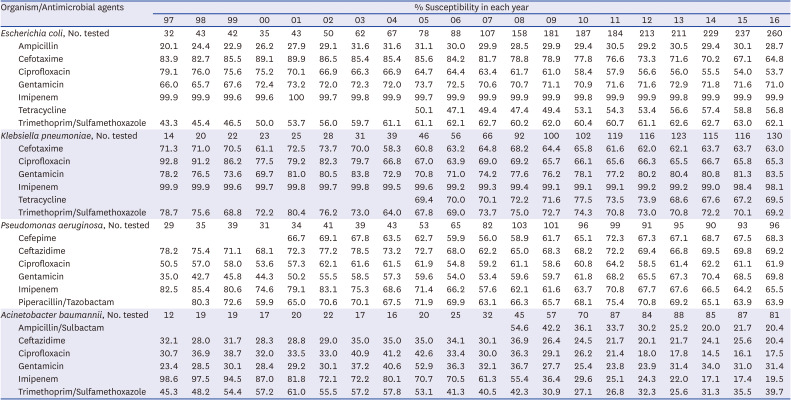
The susceptibility of S. aureus to ciprofloxacin, clindamycin, erythromycin, gentamicin, and penicillin increased in parallel with oxacillin susceptibility during the last decade (Table 1). Trimethoprim/sulfamethoxazole susceptibility was the lowest at 78.0% in 2003 but rebounded to 98.2% in 2016. Among E. faecium isolates, vancomycin susceptibility decreased from 92.2% in 1998 to 59.0% in 2016, and susceptibility to both high-level gentamicin and high-level streptomycin significantly increased during the same period. The proportion of vancomycin-resistant E. faecalis was consistently low at less than 2%, except in 2000 and 2001, but susceptibility to high-dose streptomycin increased from 65.2% in 2001 to 86.2% in 2016.
Table 1

Antimicrobial susceptibility of Staphylococcus aureus and Enterococcus species

jkms-38-e73-i001
Organism/Antimicrobial agents % Susceptibility in each year
97 98 99 00 01 02 03 04 05 06 07 08 09 10 11 12 13 14 15 16
S. aureus, No. tested 39 50 52 49 66 71 78 82 93 109 142 170 173 167 187 169 164 164 165 180
Ciprofloxacin 34.7 38.4 40.6 40.7 31.0 37.4 38.7 39.5 39.4 39.9 36.4 37.8 37.9 38.0 36.2 41.5 45.9 45.4 47.9 51.9
Clindamycin 33.7 39.0 39.0 44.8 36.6 37.3 37.3 42.6 41.9 42.0 36.8 39.2 40.2 36.1 36.3 37.4 41.5 42.1 45.8 54.0
Erythromycin 24.2 27.7 29.2 30.4 22.2 27.3 29.2 29.0 28.9 30.1 27.1 28.8 30.3 30.9 32.6 34.1 37.4 37.9 40.2 44.7
Gentamicin 38.1 39.4 39.5 33.8 38.5 38.0 39.4 42.8 45.2 47.4 47.8 48.5 46.1 48.1 45.6 49.4 48.3 50.9 57.7
Oxacillin 30.6 34.4 37.3 34.4 27.2 33.2 33.4 31.1 28.7 28.4 24.2 23.9 25.7 26.9 28.5 28.5 32.1 31.8 33.0 37.5
Penicillin 2.7 2.7 2.8 2.6 1.7 2.9 3.2 3.6 3.8 3.7 3.2 3.2 3.6 3.3 3.7 7.5 7.4 4.9 4.6 6.5
Trimethoprim/Sulfamethoxazole 98.1 97.8 96.3 91.4 85.3 80.9 78.0 83.7 87.7 89.9 90.7 92.9 96.1 96.7 98.1 98.0 98.0 97.8 97.9 98.2
Enterococcus faecium, No. tested 6 12 13 20 20 22 27 32 35 39 55 56 52 58 48 54 55 60 66
Ampicillin 35.8 22.0 11.4 6.4 12.6 12.2 12.8 8.4 8.0 8.6 7.5 7.6 9.0 8.6 8.4 9.0 8.8 10.3 8.9
Gentamicin, high level 24.4 15.6 13.7 18.0 21.7 21.4 24.2 20.8 22.4 16.8 25.3 27.8 32.9 36.9 41.5 47.1 46.1 48.1 59.7
Streptomycin, high level 50.0 50.0 45.1 59.0 55.6 68.8 65.7 71.9 79.3 72.0 71.8 69.9 73.8 74.8 78.7 85.5
Teicoplanin 92.7 68.4 68.9 69.5 73.8 70.2 71.0 64.6 65.8 74.4 70.8 72.2 71.4 73.5 74.5 70.4 70.9 71.0
Tetracycline 56.0 67.2 72.2 78.5 80.9 84.8 87.4 86.8 84.5 85.4 82.0 78.2 73.3 70.0 66.0 68.4 69.2 71.3 76.3
Vancomycin 92.2 85.6 72.1 69.4 71.6 73.3 72.1 68.9 60.6 55.8 68.4 65.6 68.5 67.6 68.8 65.8 59.5 59.6 59.0
Enterococcus faecalis, No. tested 11 16 16 17 22 21 22 24 28 32 38 61 68 68 70 72 78 72 72 71
Ampicillin 94.3 95.9 95.4 96.2 89.7 95.5 96.8 98.3 97.3 98.4 98.7 98.8 96.1 91.6 92.4 89.6 90.1 91.1 91.8 97.2
Gentamicin, high level 41.5 29.8 36.1 39.6 38.0 48.7 51.2 45.7 50.0 44.6 45.1 45.1 44.4 44.7 43.1 44.9 44.8 43.8 44.7
Streptomycin, high level 65.2 75.2 70.1 73.1 73.4 70.7 70.6 71.9 73.2 74.2 73.6 75.0 78.3 81.5 83.8 86.2
Teicoplanin 99.8 99.0 87.9 89.6 97.7 98.3 98.7 98.1 99.3 99.4 99.5 99.4 99.0 99.0 97.5 99.3 99.2 99.5
Tetracycline 17.0 20.9 24.0 19.9 21.9 21.0 24.1 23.6 23.8 21.0 19.2 16.7 15.6 15.7 14.4 13.5 14.1 13.9 15.1 16.4
Vancomycin 98.6 94.1 99.1 98.9 89.0 88.9 97.4 98.2 98.6 98.1 99.0 99.0 98.7 99.2 99.0 98.8 98.7 99.3 99.0 99.5
No. tested = the number of tested isolates (× 100).

Streptococcus species and H. influenzae

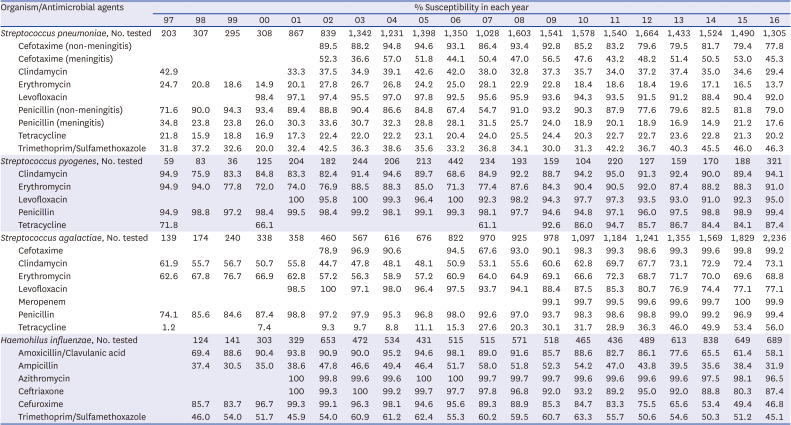
Among S. pneumoniae isolates, penicillin susceptibility decreased from 93.2% in 2009 to 79.0% in 2016, and cefotaxime, erythromycin, levofloxacin, and clindamycin susceptibility also decreased (Table 2). However, S. pyogenes was consistently susceptible to penicillin, and susceptibility to erythromycin and clindamycin recovered during the late decade from 87.6% and 92.2% in 2008 to 91.0% and 94.1% in 2016, respectively. The susceptibility of S. agalactiae to levofloxacin decreased from 98.5% in 2001 to 77.1% in 2016. The susceptibility of H. influenzae to amoxicillin/clavulanic acid and cefuroxime decreased from 98.1% and 95.6% in 2006 to 58.1% and 46.8% in 2016, respectively.
Table 2

Antimicrobial susceptibility of Streptococcus species and Haemophilus influenzae

jkms-38-e73-i002
Organism/Antimicrobial agents % Susceptibility in each year
97 98 99 00 01 02 03 04 05 06 07 08 09 10 11 12 13 14 15 16
Streptococcus pneumoniae, No. tested 203 307 295 308 867 839 1,342 1,231 1,398 1,350 1,028 1,603 1,541 1,578 1,540 1,664 1,433 1,524 1,490 1,305
Cefotaxime (non-meningitis) 89.5 88.2 94.8 94.6 93.1 86.4 93.4 92.8 85.2 83.2 79.6 79.5 81.7 79.4 77.8
Cefotaxime (meningitis) 52.3 36.6 57.0 51.8 44.1 50.4 47.0 56.5 47.6 43.2 48.2 51.4 50.5 53.0 45.3
Clindamycin 42.9 33.3 37.5 34.9 39.1 42.6 42.0 38.0 32.8 37.3 35.7 34.0 37.2 37.4 35.0 34.6 29.4
Erythromycin 24.7 20.8 18.6 14.9 20.1 27.8 26.7 26.8 24.2 25.0 28.1 22.9 22.8 18.4 18.6 18.4 19.6 17.1 16.5 13.7
Levofloxacin 98.4 97.1 97.4 95.5 97.0 97.8 92.5 95.6 95.9 93.6 94.3 93.5 91.5 91.2 88.4 90.4 92.0
Penicillin (non-meningitis) 71.6 90.0 94.3 93.4 89.4 88.8 90.4 86.6 84.8 67.4 54.7 91.0 93.2 90.3 87.9 77.6 79.6 82.5 81.8 79.0
Penicillin (meningitis) 34.8 23.8 23.8 26.0 30.3 33.6 30.7 32.3 28.8 28.1 31.5 25.7 24.0 18.9 20.1 18.9 16.9 14.9 21.2 17.6
Tetracycline 21.8 15.9 18.8 16.9 17.3 22.4 22.0 22.2 23.1 20.4 24.0 25.5 24.4 20.3 22.7 22.7 23.6 22.8 21.3 20.2
Trimethoprim/Sulfamethoxazole 31.8 37.2 32.6 20.0 32.4 42.5 36.3 38.6 35.6 33.2 36.8 34.1 30.0 31.3 42.2 36.7 40.3 45.5 46.0 46.3
Streptococcus pyogenes, No. tested 59 83 36 125 204 182 244 206 213 442 234 193 159 104 220 127 159 170 188 321
Clindamycin 94.9 75.9 83.3 84.8 83.3 82.4 91.4 94.6 89.7 68.6 84.9 92.2 88.7 94.2 95.0 91.3 92.4 90.0 89.4 94.1
Erythromycin 94.9 94.0 77.8 72.0 74.0 76.9 88.5 88.3 85.0 71.3 77.4 87.6 84.3 90.4 90.5 92.0 87.4 88.2 88.3 91.0
Levofloxacin 100 95.8 100 99.3 96.4 100 92.3 98.2 94.3 97.7 97.3 93.5 93.0 91.0 92.3 95.0
Penicillin 94.9 98.8 97.2 98.4 99.5 98.4 99.2 98.1 99.1 99.3 98.1 97.7 94.6 94.8 97.1 96.0 97.5 98.8 98.9 99.4
Tetracycline 71.8 66.1 61.1 92.6 86.0 94.7 85.7 86.7 84.4 84.1 87.4
Streptococcus agalactiae, No. tested 139 174 240 338 358 460 567 616 676 822 970 925 978 1,097 1,184 1,241 1,355 1,569 1,829 2,236
Cefotaxime 78.9 96.9 90.6 94.5 67.6 93.0 90.1 98.3 99.3 98.6 99.3 99.6 99.8 99.2
Clindamycin 61.9 55.7 56.7 50.7 55.8 44.7 47.8 48.1 48.1 50.9 53.1 55.6 60.6 62.8 69.7 67.7 73.1 72.9 72.4 73.1
Erythromycin 62.6 67.8 76.7 66.9 62.8 57.2 56.3 58.9 57.2 60.9 64.0 64.9 69.1 66.6 72.3 68.7 71.7 70.0 69.6 68.8
Levofloxacin 98.5 100 97.1 98.0 96.4 97.5 93.7 94.1 88.4 87.5 85.3 80.7 76.9 74.4 77.1 77.1
Meropenem 99.1 99.7 99.5 99.6 99.6 99.7 100 99.9
Penicillin 74.1 85.6 84.6 87.4 98.8 97.2 97.9 95.3 96.8 98.0 92.6 97.0 93.7 98.3 98.6 98.8 99.0 99.2 96.9 99.4
Tetracycline 1.2 7.4 9.3 9.7 8.8 11.1 15.3 27.6 20.3 30.1 31.7 28.9 36.3 46.0 49.9 53.4 56.0
Haemohilus influenzae, No. tested 124 141 303 329 653 472 534 431 515 515 571 518 465 436 489 613 838 649 689
Amoxicillin/Clavulanic acid 69.4 88.6 90.4 93.8 90.9 90.0 95.2 94.6 98.1 89.0 91.6 85.7 88.6 82.7 86.1 77.6 65.5 61.4 58.1
Ampicillin 37.4 30.5 35.0 38.6 47.8 46.6 49.4 46.4 51.7 58.0 51.8 52.3 54.2 47.0 43.8 39.5 35.6 38.4 31.9
Azithromycin 100 99.8 99.6 99.6 100 100 99.7 99.7 99.7 99.6 99.6 99.6 99.6 97.5 98.1 96.5
Ceftriaxone 100 99.3 100 99.2 99.7 97.7 97.8 96.8 92.0 93.2 89.2 95.0 92.0 88.8 80.3 87.4
Cefuroxime 85.7 83.7 96.7 99.3 99.1 96.3 98.1 94.6 95.6 89.3 88.9 85.3 84.7 83.3 75.5 65.6 53.4 49.4 46.8
Trimethoprim/Sulfamethoxazole 46.0 54.0 51.7 45.9 54.0 60.9 61.2 62.4 55.3 60.2 59.5 60.7 63.3 55.7 50.6 54.6 50.3 51.2 45.1
No. tested = the number of tested isolates.

Enterobacterales and nonfermenting gram-negative bacilli

Although cefotaxime and ciprofloxacin susceptibility significantly decreased in both E. coli and K. pneumoniae during the study period, this trend was more pronounced in K. pneumoniae in the early decade and E. coli in the late decade (Table 3). The susceptibility of P. aeruginosa to imipenem and ceftazidime decreased markedly during the first decade and remained in the range of 60–70% in the second decade, whereas the susceptibility of A. baumannii to imipenem and ampicillin/sulbactam markedly decreased. Susceptibility of A. baumannii to imipenem decreased from 98.6% in 1997 to 19.5% in 2016, and susceptibility to ampicillin/sulbactam decreased from 54.6% in 2008 to 20.4% in 2016. In contrast, gentamicin susceptibility continuously increased from 35.0% in 1997 to 69.8% in 2016 in P. aeruginosa, whereas it showed no significant change at approximately 30% in A. baumannii.
Table 3

Antimicrobial susceptibility of Enterobacterales and nonfermenting gram-negative bacilli

jkms-38-e73-i003
Organism/Antimicrobial agents % Susceptibility in each year
97 98 99 00 01 02 03 04 05 06 07 08 09 10 11 12 13 14 15 16
Escherichia coli, No. tested 32 43 42 35 43 50 62 67 78 88 107 158 181 187 184 213 211 229 237 260
Ampicillin 20.1 24.4 22.9 26.2 27.9 29.1 31.6 31.6 31.1 30.0 29.9 28.5 29.9 29.4 30.5 29.2 30.5 29.4 30.1 28.7
Cefotaxime 83.9 82.7 85.5 89.1 89.9 86.5 85.4 85.4 85.6 84.2 81.7 78.8 78.9 77.8 76.6 73.3 71.6 70.2 67.1 64.8
Ciprofloxacin 79.1 76.0 75.6 75.2 70.1 66.9 66.3 66.9 64.7 64.4 63.4 61.7 61.0 58.4 57.9 56.6 56.0 55.5 54.0 53.7
Gentamicin 66.0 65.7 67.6 72.4 73.2 72.0 72.3 72.0 73.7 72.5 70.6 70.7 71.1 70.9 71.6 71.6 72.9 71.8 71.6 71.0
Imipenem 99.9 99.9 99.6 99.6 100 99.7 99.8 99.9 99.7 99.9 99.9 99.9 99.9 99.8 99.9 99.9 99.8 99.9 99.9 99.9
Tetracycline 50.1 47.1 49.4 47.4 49.4 53.1 54.3 53.4 56.6 57.4 58.8 56.8
Trimethoprim/Sulfamethoxazole 43.3 45.4 46.5 50.0 53.7 56.0 59.7 61.1 61.1 62.1 62.7 60.2 62.0 60.4 60.7 61.1 62.6 62.7 63.0 62.1
Klebsiella pneumoniae, No. tested 14 20 22 23 25 28 31 39 46 56 66 92 100 102 119 116 123 115 116 130
Cefotaxime 71.3 71.0 70.5 61.1 72.5 73.7 70.0 58.3 60.8 63.2 64.8 68.2 64.4 65.8 61.6 62.0 62.1 63.7 63.7 63.0
Ciprofloxacin 92.8 91.2 86.2 77.5 79.2 82.3 79.7 66.8 67.0 63.9 69.0 69.2 65.7 66.1 65.6 66.3 65.5 66.7 65.8 65.3
Gentamicin 78.2 76.5 73.6 69.7 81.0 80.5 83.8 72.9 70.8 71.0 74.2 77.6 76.2 78.1 77.2 80.2 80.4 80.8 81.3 83.5
Imipenem 99.9 99.9 99.6 99.7 99.8 99.7 99.8 99.5 99.6 99.2 99.3 99.4 99.1 99.1 99.1 99.2 99.2 99.0 98.4 98.1
Tetracycline 69.4 70.0 70.1 72.2 71.6 77.5 73.5 73.9 68.6 67.6 67.2 69.5
Trimethoprim/Sulfamethoxazole 78.7 75.6 68.8 72.2 80.4 76.2 73.0 64.0 67.8 69.0 73.7 75.0 72.7 74.3 70.8 73.0 70.8 72.2 70.1 69.2
Pseudomonas aeruginosa, No. tested 29 35 39 31 34 41 39 43 53 65 82 103 101 96 99 91 95 90 93 96
Cefepime 66.7 69.1 67.8 63.5 62.7 59.9 56.0 58.9 61.7 65.1 72.3 67.3 67.1 68.7 67.5 68.3
Ceftazidime 78.2 75.4 71.1 68.1 72.3 77.2 78.5 73.2 72.7 68.0 62.2 65.0 68.3 68.2 72.2 69.4 66.8 69.5 69.8 69.2
Ciprofloxacin 50.5 57.0 58.0 53.6 57.3 62.1 61.6 61.5 61.9 54.8 59.2 61.1 58.6 60.8 64.2 58.5 61.4 62.2 61.1 61.9
Gentamicin 35.0 42.7 45.8 44.3 50.2 55.5 58.5 57.3 59.6 54.0 53.4 59.6 59.7 61.8 68.2 65.5 67.3 70.4 68.5 69.8
Imipenem 82.5 85.4 80.6 74.6 79.1 83.1 75.3 68.6 71.4 66.2 57.6 62.1 61.6 63.7 70.8 67.7 67.6 66.5 64.2 65.5
Piperacillin/Tazobactam 80.3 72.6 59.9 65.0 70.6 70.1 67.5 71.9 69.9 63.1 66.3 65.7 68.1 75.4 70.8 69.2 65.1 63.9 63.9
Acinetobacter baumannii, No. tested 12 19 19 17 20 22 17 16 20 25 32 45 57 70 87 84 88 85 87 81
Ampicillin/Sulbactam 54.6 42.2 36.1 33.7 30.2 25.2 20.0 21.7 20.4
Ceftazidime 32.1 28.0 31.7 28.3 28.8 29.0 35.0 35.0 35.0 34.1 30.1 36.9 26.4 24.5 21.7 20.1 21.7 24.1 25.6 20.4
Ciprofloxacin 30.7 36.9 38.7 32.0 33.5 33.0 40.9 41.2 42.6 33.4 30.0 36.3 29.1 26.2 21.4 18.0 17.8 14.5 16.1 17.5
Gentamicin 23.4 28.5 30.1 28.4 29.2 30.1 37.2 40.6 52.9 36.3 32.1 36.7 27.7 25.4 23.8 23.9 31.4 34.0 31.0 31.4
Imipenem 98.6 97.5 94.5 87.0 81.8 72.1 72.2 80.1 70.7 70.5 61.3 55.4 36.4 29.6 25.1 24.3 22.0 17.1 17.4 19.5
Trimethoprim/Sulfamethoxazole 45.3 48.2 54.4 57.2 61.0 55.5 57.2 57.8 53.1 41.3 40.5 42.3 30.9 27.1 26.8 32.3 25.6 31.3 35.5 39.7
No. tested = the number of tested isolates (× 100).

Correlation between species distribution and antimicrobial resistance

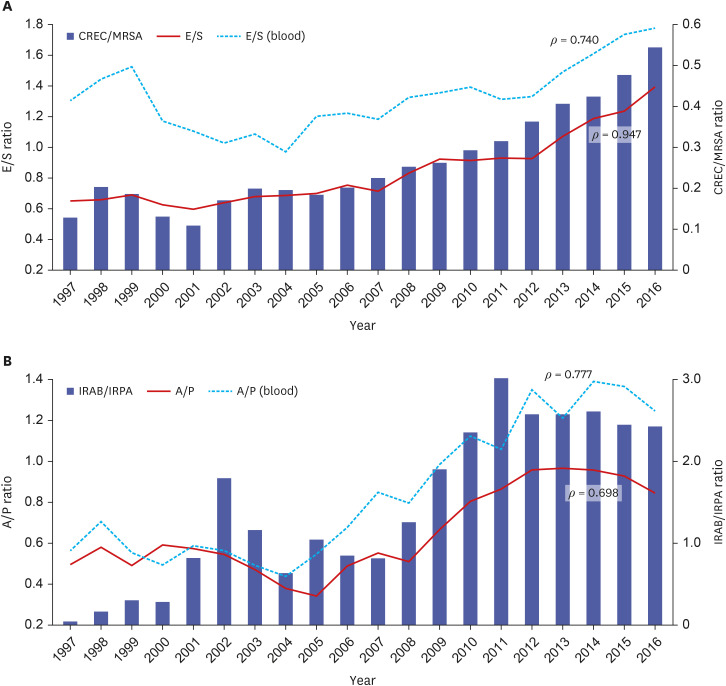
The E/S ratio was below 0.69 until 2001 and then increased to 1.4 in 2016 (Fig. 2A). The CREC/MRSA ratio was below 0.2 until 2001 and then increased to 0.55 in 2016. The E/S and CREC/MRSA ratios were strongly correlated (ρ = 0.947). The A/P ratio was within the range of 0.49 to 0.59 until 2000, gradually decreased to 0.34 in 2005, and then increased rapidly to 0.97 in 2013 (Fig. 2B). The A/P and IRAB/IRPA ratios were moderately correlated (ρ = 0.698). The E/S and A/P ratios from the blood isolates also showed moderate correlation with the CREC/MRSA and IRAB/IRPA ratios, as shown in the total isolates (ρ = 0.740 and 0.777, respectively) (Fig. 2).
Fig. 2

Correlation between species distribution and antimicrobial resistance of four most prevalent species. (A) Correlation analysis of the E/S ratio and the CREC/MRSA ratio showed strong correlation in total isolates (ρ = 0.947) and moderate correlation with blood isolates (ρ = 0.740). (B) The A/P ratio and the IRAB/IRPA ratio showed moderate correlations in both total (ρ = 0.698) and blood isolates (ρ = 0.777).

E/S ratio = ratio of the number of isolates of Escherichia coli to those of Staphylococcus aureus, CREC/MRSA ratio = ratio of % cefotaxime-resistant E. coli to % oxacillin-resistant S. aureus, A/P ratio = ratio of the number of isolates of Acinetobacter baumannii to those of Pseudomonas aeruginosa, IRAB/IRPA ratio = ratio of % imipenem-resistant A. baumannii to % imipenem-resistant P. aeruginosa.
jkms-38-e73-g002

DISCUSSION

We investigated the changes in species distribution and antimicrobial susceptibility of major pathogenic bacteria over the past 20 years in South Korea. Among the epidemiological changes during the study period, the most prominent finding was that the frequency of S. aureus and MRSA decreased over the last 10 years. The MRSA surveillance program in the United States also reported a decrease in the incidence of invasive MRSA infections between 2009 and 2016.8 MRSA is one of the most important targets for infection control, and various interventions, including national surveillance, have been implemented. The prevalence of MRSA bloodstream infections (BSI) increased between 2005 and 2008 and decreased till 2013–2016 among hospital-onset and community-acquired BSI in a 20-year global study of SENTRY.9 The rate of device-associated MRSA infections in intensive care units (ICUs) has been reported to decrease slightly from 95.0% in 2006 to 90.2% in 2013.10 The trends of decreasing MRSA rates were more prominent when more community-related isolates were included, changing from 69% in 2009 to 66% in 2011 in the Korean Nationwide Surveillance of Antimicrobial Resistance program (KONSAR)1112 and from 72% in 2013 to 66% in 2015 in the Korean Antimicrobial Resistance Monitoring System.13 A laboratory in Daejeon which is one of the participating laboratories reported a 20% annual decline in the incidence density of ICU-acquired MRSA bacteremia over a decade (2009–2018), primarily due to reductions in the incidence of catheter-related infections.14 Therefore, the frequency of total S. aureus and the decreased MRSA rate seems to be a national trend in South Korea.
E. coli became the most prevalent pathogen since 2012 in this study. It has consistently been the most abundant pathogen in the KONSAR study since 2007,11 and SENTRY reported that E. coli was the most common pathogen worldwide, causing BSI from 2005 to 2016.9 The simultaneous decrease in the frequency of S. aureus and increase in that of E. coli appears to be due to antimicrobial resistance when inferring a strong correlation between the E/S ratio and the CREC/MRSA ratio in this study. Cefotaxime is the most sensitive indicator of extended-spectrum β-lactamase (ESBL) E. coli in Korea because type of ESBL is mainly CTX-M-14 or M-15 among ESBL-producing E. coli. 15 The CREC rate correlated with the ESBL-producing rate in E. coli. The predominant strain of antimicrobial-resistant E. coli was ST131 in the early 2000s worldwide16 and in Korea, as shown in a previous multicenter study analyzing ciprofloxacin-resistant E. coli isolated in 2006–2007.17 ST131 is also a major clone in ESBL-producing E. coli in the community and healthcare settings in Korea.18 The domestic spread of this clone may explain its decreased susceptibility to ciprofloxacin and cefotaxime in the late decade. In this study, K. pneumoniae was always more resistant than E. coli to imipenem and cefotaxime. Classical K. pneumoniae is a pathogen that causes healthcare-associated infections driven by multidrug resistance (MDR) rather than higher virulence.19 Therefore, it is noteworthy that the imipenem susceptibility of E. coli remained unchanged for 20 years, whereas the imipenem resistance of K. pneumoniae increased to 2% in 2016. Carbapenem-resistant Enterobacterales (CRE) is an emerging threat to public health worldwide.9 The number of carbapenem-nonsusceptible Enterobacterales isolates increased approximately 1.5-fold per year as per the national laboratory surveillance of Korea conducted from 2011 to 2015.20 The most serious concern is that carbapenem resistance in K. pneumoniae is mediated by plasmids carrying carbapenemase genes encoding KPC, NDM, VIM, OXA-48, and IMP, among others.21 Therefore, close monitoring and thorough infection control of CRE are required, as CRE is considered to affect the epidemiology of pathogenic bacteria in the near future.
Concurrent increases in imipenem resistance and the frequency of P. aeruginosa and A. baumannii continued until 2008 and 2011, respectively. The frequency of meropenem-nonsusceptible Acinetobacter spp. markedly increased from 13.6% to 78.8% in the Asia-Pacific region from 1997–1998 to 2015–2016, while the frequency of meropenem-nonsusceptible P. aeruginosa fluctuated between 20% and 30% over 20 years.2223 According to previous studies, the increase in carbapenem resistance in P. aeruginosa and A. baumannii in South Korea is similar to a global trend.1213 In this study, the increase in the prevalence of carbapenem-resistant A. baumannii was primarily explained by the spread of a clone carrying the blaoxa-23-like gene since 2007 in South Korea.24 Compared to A. baumannii, carbapenem resistance in P. aeruginosa is mediated more by the induction of multifaceted resistance mechanisms against antimicrobial usage than by plasmid-mediated carbapenemases.252627 Given the impact of carbapenem resistance mechanisms on the epidemiology of P. aeruginosa and A. baumannii, K. pneumoniae will become the most problematic pathogen in the near future through their carbapenemase-mediated resistant mechanism.
This study showed that vancomycin resistance in E. faecium was as high as 40–50% and that E. faecalis was still susceptible to vancomycin independent of the hospital size and region in Korea. These findings are consistent with those of previous global and Korean studies.1228 E. faecium is intrinsically more resistant than E. faecalis, a well-known virulence factor that increases the incidence of E. faecium infections in healthcare-associated settings.29 In this study, the number of isolates of E. faecium first outnumbered that of E. faecalis in 2000 among all isolates and in 1999 among blood isolates. Since then, the incidence of these two Enterococcus species fluctuated. However, the number of patients was consistently higher with E. faecalis than with E. faecium, except from 2004 to 2006. A transient increase in the frequency of E. faecium is often associated with the prevalence of vancomycin-resistant E. faecium; in 2001–2002, two laboratories showed very high vancomycin resistance rates of up to 29.0%. Therefore, Enterococcus species are representative organisms in which antimicrobial resistance affects epidemiology; thus, if there is a sudden change in the isolation frequency, it should always be interpreted concerning antimicrobial susceptibility.
The relative frequency of S. pneumoniae infection decreased since 2002. Considering that pneumococcal vaccines were started in 2003 in Korea, which caused a decline in the frequency of pathogenic serotypes,3031 this finding is not surprising. The prevalence of multidrug-resistant S. pneumoniae, including those resistant to penicillin, continuously increased during the study period. There is a strong correlation between antimicrobial resistance and serotype, and the representative non-PCV13 serotype 11A that most frequently causes infection after pneumococcal vaccination has a MDR rate of 80.9% and the next most frequent serotype 19A is also an MDR strain in South Korea.3132 Unlike other species, the increase in MDR with a decrease in the incidence of S. pneumoniae infections can be explained by the vaccine effect.
The frequency of S. agalactiae showed a 19-fold increase over 20 years, and it became the most common pathogenic Streptococcus species since 2013. It was also the most common pathogenic Streptococcus isolated from blood cultures since 2015. S. agalactiae is a well-known pathogen that causes meningitis and pneumonia in infants < 3 months of age.33 However, the prevalence of S. agalactiae skin/soft tissue infections and bacteremia in adults with underlying diseases has increased.343536 S. agalactiae showed low susceptibility to erythromycin and clindamycin at 56.3–72.3% and 44.7–73.1%, respectively, from the beginning of this study. Levofloxacin susceptibility remained high but declined to 77.1% in 2016 over the past decade. The increasing trend in levofloxacin resistance is supported by a previous report that showed an increase from 5.6% in 2005 to 10.6% in 2008 among clinical isolates of S. agalactiae in a university hospital.37 Reduced levofloxacin and macrolide susceptibility exacerbates the problem associated with the increased incidence of S. agalactiae infections. The guidelines for community-acquired pneumonia published in 2009 recommend β-lactam ± macrolide or respiratory fluoroquinolone as the first choice of antimicrobial agents for outpatients in Korea.38 Therefore, the increased incidence of S. agalactiae infections and increased resistance to levofloxacin and macrolide may be associated with the greater use of macrolide and levofloxacin in the community. For the same reason, S. agalactiae is likely to become a more serious problem over a considerable period.
This study has a few important limitations. This study aimed to collect comprehensive national data for the last 20 years; however, the minimal inhibitory concentration (MIC) test panel differed according to the laboratory; therefore, some antimicrobials were not included in the analysis. Second, not all laboratories participated during the study period because each participating laboratory’s data collection period was different. Third, the participating laboratories were mainly from university and tertiary care hospitals; therefore, the conclusions of this study cannot be generalized to community hospitals. However, the homogeneity of the participating laboratories had an advantage in terms of test performance and MIC data quality.
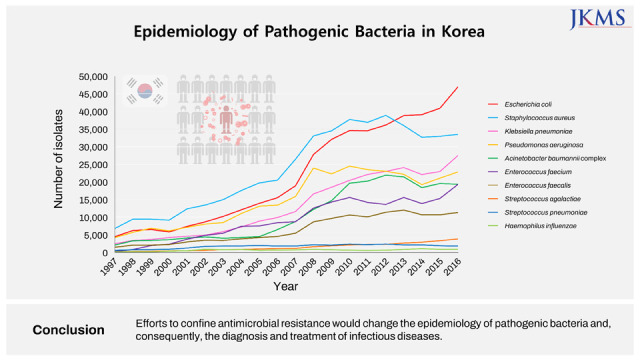
In conclusion, the epidemiology of pathogenic bacteria has greatly changed according to the trends of antimicrobial resistance rates over the past two decades in Korea. An increase in antimicrobial resistance is associated with the trend of an increasing frequency of certain species. National trend analysis of species distribution and antimicrobial resistance of pathogenic bacteria helps to predict epidemiologic changes in the near future and highlights interventions for infection control and antimicrobial agent usage to prevent the further spread of antimicrobial resistance.

Notes

Funding: This research was supported by Basic Science Research Program through the National Research Foundation of Korea (NRF) funded by the Ministry of Education (2021R1I1A2055983).

Disclosure: The authors have no potential conflicts of interest to disclose.

Author Contributions:

  • Conceptualization: Kim MN.

  • Formal analysis: Bae MH, Kim MN.

  • Funding acquisition: Bae MH.

  • Investigation: Kim MS, Kim MN.

  • Methodology: Kim MN.

  • Project administration: Kim MN.

  • Resources: Bae MH, Kim TS, Kim S, Yong D, Ha GY, Ryoo NH, Uh Y, Shin JH, Lee HS, Sohn YH, Shin S.

  • Supervision: Kim MN.

  • Validation: Kim MN.

  • Visualization: Kim MS.

  • Writing - original draft: Bae MH, Kim MS.

  • Writing - review & editing: Kim MN.

References

1. Murray CJ, Lopez AD. Global mortality, disability, and the contribution of risk factors: Global Burden of Disease Study. Lancet. 1997; 349(9063):1436–1442. PMID: 9164317.
2. Cohen ML. Changing patterns of infectious disease. Nature. 2000; 406(6797):762–767. PMID: 10963605.
3. Chambers HF. The changing epidemiology of Staphylococcus aureus? Emerg Infect Dis. 2001; 7(2):178–182. PMID: 11294701.
4. Nordmann P, Dortet L, Poirel L. Carbapenem resistance in Enterobacteriaceae: here is the storm! Trends Mol Med. 2012; 18(5):263–272. PMID: 22480775.
5. World Health Organization. Global Antimicrobial Resistance Surveillance System (GLASS) Report Early Implementation 2016–2017. Updated 2018. Accessed October 15, 2020. https://www.who.int/publications/i/item/9789241513449 .
6. Choe YJ, Choe SA, Cho SI. Trends in infectious disease mortality, South Korea, 1983-2015. Emerg Infect Dis. 2018; 24(2):320–327. PMID: 29350153.
7. O’Brien TF, Stelling JM. WHONET: removing obstacles to the full use of information about antimicrobial resistance. Diagn Microbiol Infect Dis. 1996; 25(4):162–168. PMID: 8937840.
8. Ramanan P, Bryson AL, Binnicker MJ, Pritt BS, Patel R. Syndromic panel-based testing in clinical microbiology. Clin Microbiol Rev. 2018; 31(1):e00024-17. PMID: 29142077.
9. Diekema DJ, Hsueh PR, Mendes RE, Pfaller MA, Rolston KV, Sader HS, et al. The microbiology of bloodstream infection: 20-year trends from the SENTRY Antimicrobial Surveillance Program. Antimicrob Agents Chemother. 2019; 63(7):e00355-19. PMID: 31010862.
10. Choi JY, Kwak YG, Yoo H, Lee SO, Kim HB, Han SH, et al. Trends in the distribution and antimicrobial susceptibility of causative pathogens of device-associated infection in Korean intensive care units from 2006 to 2013: results from the Korean Nosocomial Infections Surveillance System (KONIS). J Hosp Infect. 2016; 92(4):363–371. PMID: 26876746.
11. Lee K, Kim MN, Kim JS, Hong HL, Kang JO, Shin JH, et al. Further increases in carbapenem-, amikacin-, and fluoroquinolone-resistant isolates of Acinetobacter spp. and P. aeruginosa in Korea: KONSAR study 2009. Yonsei Med J. 2011; 52(5):793–802. PMID: 21786445.
12. Yong D, Shin HB, Kim YK, Cho J, Lee WG, Ha GY, et al. Increase in the prevalence of carbapenem-resistant Acinetobacter isolates and ampicillin-resistant non-typhoidal salmonella species in Korea: a KONSAR study conducted in 2011. Infect Chemother. 2014; 46(2):84–93. PMID: 25024870.
13. Kim D, Ahn JY, Lee CH, Jang SJ, Lee H, Yong D, et al. Increasing resistance to extended-spectrum cephalosporins, fluoroquinolone, and carbapenem in gram-negative bacilli and the emergence of carbapenem non-susceptibility in Klebsiella pneumoniae: analysis of Korean Antimicrobial Resistance Monitoring System (KARMS) data from 2013 to 2015. Ann Lab Med. 2017; 37(3):231–239. PMID: 28224769.
14. Kim H, Kim ES, Lee SC, Yang E, Kim HS, Sung H, et al. Decreased incidence of methicillin-resistant Staphylococcus aureus bacteremia in intensive care units: a 10-year clinical, microbiological, and genotypic analysis in a tertiary hospital. Antimicrob Agents Chemother. 2020; 64(10):e01082-20. PMID: 32747360.
15. Song W, Lee H, Lee K, Jeong SH, Bae IK, Kim JS, et al. CTX-M-14 and CTX-M-15 enzymes are the dominant type of extended-spectrum beta-lactamase in clinical isolates of Escherichia coli from Korea. J Med Microbiol. 2009; 58(Pt 2):261–266. PMID: 19141747.
16. Rogers BA, Sidjabat HE, Paterson DL. Escherichia coli O25b-ST131: a pandemic, multiresistant, community-associated strain. J Antimicrob Chemother. 2011; 66(1):1–14. PMID: 21081548.
17. Lee MY, Choi HJ, Choi JY, Song M, Song Y, Kim SW, et al. Dissemination of ST131 and ST393 community-onset, ciprofloxacin-resistant Escherichia coli clones causing urinary tract infections in Korea. J Infect. 2010; 60(2):146–153. PMID: 19932131.
18. Park SH, Byun JH, Choi SM, Lee DG, Kim SH, Kwon JC, et al. Molecular epidemiology of extended-spectrum β-lactamase-producing Escherichia coli in the community and hospital in Korea: emergence of ST131 producing CTX-M-15. BMC Infect Dis. 2012; 12(1):149. PMID: 22747570.
19. Moellering RC Jr. NDM-1--a cause for worldwide concern. N Engl J Med. 2010; 363(25):2377–2379. PMID: 21158655.
20. Yoon EJ, Yang JW, Kim JO, Lee H, Lee KJ, Jeong SH. Carbapenemase-producing Enterobacteriaceae in South Korea: a report from the National Laboratory Surveillance System. Future Microbiol. 2018; 13(7):771–783. PMID: 29478336.
21. Logan LK, Weinstein RA. The epidemiology of carbapenem-resistant Enterobacteriaceae: the impact and evolution of a global menace. J Infect Dis. 2017; 215(suppl_1):S28–S36. PMID: 28375512.
22. Sader HS, Castanheira M, Arends SJ, Goossens H, Flamm RK. Geographical and temporal variation in the frequency and antimicrobial susceptibility of bacteria isolated from patients hospitalized with bacterial pneumonia: results from 20 years of the SENTRY Antimicrobial Surveillance Program (1997-2016). J Antimicrob Chemother. 2019; 74(6):1595–1606. PMID: 30843070.
23. Shortridge D, Gales AC, Streit JM, Huband MD, Tsakris A, Jones RN. Geographic and temporal patterns of antimicrobial resistance in Pseudomonas aeruginosa over 20 years from the SENTRY Antimicrobial Surveillance Program, 1997-2016. Open Forum Infect Dis. 2019; 6(Suppl 1):S63–S68. PMID: 30895216.
24. Lee Y, Kim YR, Kim J, Park YJ, Song W, Shin JH, et al. Increasing prevalence of blaOXA-23-carrying Acinetobacter baumannii and the emergence of blaOXA-182-carrying Acinetobacter nosocomialis in Korea. Diagn Microbiol Infect Dis. 2013; 77(2):160–163. PMID: 23891219.
25. Woodford N, Turton JF, Livermore DM. Multiresistant Gram-negative bacteria: the role of high-risk clones in the dissemination of antibiotic resistance. FEMS Microbiol Rev. 2011; 35(5):736–755. PMID: 21303394.
26. Bae IK, Suh B, Jeong SH, Wang KK, Kim YR, Yong D, et al. Molecular epidemiology of Pseudomonas aeruginosa clinical isolates from Korea producing β-lactamases with extended-spectrum activity. Diagn Microbiol Infect Dis. 2014; 79(3):373–377. PMID: 24792837.
27. Hong JS, Yoon EJ, Lee H, Jeong SH, Lee K. Clonal dissemination of Pseudomonas aeruginosa sequence type 235 isolates carrying blaIMP-6 and emergence of blaGES-24 and blaIMP-10 on novel genomic islands PAGI-15 and -16 in South Korea. Antimicrob Agents Chemother. 2016; 60(12):7216–7223. PMID: 27671068.
28. Mendes RE, Castanheira M, Farrell DJ, Flamm RK, Sader HS, Jones RN. Longitudinal (2001-14) analysis of enterococci and VRE causing invasive infections in European and US hospitals, including a contemporary (2010-13) analysis of oritavancin in vitro potency. J Antimicrob Chemother. 2016; 71(12):3453–3458. PMID: 27609052.
29. Gao W, Howden BP, Stinear TP. Evolution of virulence in Enterococcus faecium, a hospital-adapted opportunistic pathogen. Curr Opin Microbiol. 2018; 41:76–82. PMID: 29227922.
30. Richter SS, Diekema DJ, Heilmann KP, Dohrn CL, Riahi F, Doern GV. Changes in pneumococcal serotypes and antimicrobial resistance after introduction of the 13-valent conjugate vaccine in the United States. Antimicrob Agents Chemother. 2014; 58(11):6484–6489. PMID: 25136018.
31. Park DC, Kim SH, Yong D, Suh IB, Kim YR, Yi J, et al. Serotype distribution and antimicrobial resistance of invasive and noninvasive Streptococcus pneumoniae Isolates in Korea between 2014 and 2016. Ann Lab Med. 2019; 39(6):537–544. PMID: 31240881.
32. Kim SH, Song JH, Chung DR, Thamlikitkul V, Yang Y, Wang H, et al. Changing trends in antimicrobial resistance and serotypes of Streptococcus pneumoniae isolates in Asian countries: an Asian Network for Surveillance of Resistant Pathogens (ANSORP) study. Antimicrob Agents Chemother. 2012; 56(3):1418–1426. PMID: 22232285.
33. Rhie K, Choi EH, Cho EY, Lee J, Kang JH, Kim DS, et al. Etiology of invasive bacterial infections in immunocompetent children in Korea (2006-2010): a retrospective multicenter study. J Korean Med Sci. 2018; 33(6):e45. PMID: 29349940.
34. Matsubara K, Yamamoto G. Invasive group B streptococcal infections in a tertiary care hospital between 1998 and 2007 in Japan. Int J Infect Dis. 2009; 13(6):679–684. PMID: 19131262.
35. Björnsdóttir ES, Martins ER, Erlendsdóttir H, Haraldsson G, Melo-Cristino J, Kristinsson KG, et al. Changing epidemiology of group B streptococcal infections among adults in Iceland: 1975-2014. Clin Microbiol Infect. 2016; 22(4):379.e9–e16.
36. Lee K, Kim WJ, Kim DL, Ko HM, Baik SH, Kim MN, et al. Clinical characteristics of Streptococcus agalactiae bacteremia in adults living in Jeju Island. Ann Clin Microbiol. 2014; 17(1):9–13.
37. Ki M, Srinivasan U, Oh KY, Kim MY, Shin JH, Hong HL, et al. Emerging fluoroquinolone resistance in Streptococcus agalactiae in South Korea. Eur J Clin Microbiol Infect Dis. 2012; 31(11):3199–3205. PMID: 22752224.
38. Song JH, Jung KS, Kang MW, Kim DJ, Pai H, Suh GY, et al. Treatment guidelines for community-acquired pneumonia in Korea: an evidence-based approach to appropriate antimicrobial therapy. Tuberc Respir Dis. 2009; 67(4):281–302.

SUPPLEMENTARY MATERIAL

Supplementary Table 1

Number of isolates tested in 12 participating laboratories
jkms-38-e73-s001.doc
TOOLS
Similar articles