

 PDF
PDF Citation
 Print
Print


INTRODUCTION
It has been almost two and a half years since the World Health Organization declared the coronavirus disease 2019 (COVID-19) outbreak a pandemic.1 During this time, there have been many changes in daily life to prevent the spread of the coronavirus, such as mask wearing, social distancing, and isolating confirmed COVID-19 patients.2 In Korea, the number of confirmed COVID-19 patients peaked with the emergence of the severe acute respiratory syndrome coronavirus 2 omicron variant of concern, and socioeconomic activities seem to be gradually recovering as strict social distancing measures are loosened.
However, the medical field, at least the emergency medical field, does not seem to have begun to recover. Patients with fever are still preemptively isolated before being assigned beds in the emergency department (ED) and are checked for COVID-19 infection. Preemptive isolation of fever patients aims to prevent the coronavirus from spreading to other patients in the ED who are not immunocompetent and medical staff.3 This preemptive isolation begins with the prehospital emergency medical service (EMS) system.4 EMS providers should check the availability of isolation beds to accommodate fever patients before transport, except in emergencies.
However, since isolation beds in the ED are not always available, fever patients are sometimes transported to distant EDs rather than close EDs. Even patients or EMS providers may abandon visiting the ED or transporting patients to the ED. Transport delay or failure (nontransport) for fever patients to the ED has already been reported in the media several times. Transporting infants with fever to the ED seems more of an issue.
However, few studies have focused on delays and failure in transporting fever patients to the ED since COVID-19, despite being reported in the media. Studies have verified the impact of COVID-19 on transport interval for acute stroke, acute myocardial infarction, and out-of-hospital cardiac arrest patients.567 Early in the COVID-19 pandemic, studies reported that ED transport was delayed and paralyzed due to the explosion in emergency calls by patients with fever or dyspnea due to the rapid spread of coronavirus in some cities, such as New York and Milan.891011 Korea had a low incidence of COVID-19 before omicron emergence; the situation in Korea was different from that in these cities. Therefore, this study aimed to examine and compare the EMS time interval and nontransport rate of patients with fever using EMSs before and after COVID-19 in Busan, South Korea.
METHODS
Study design and setting
This retrospective observational study analyzed and compared the prehospital EMS time interval and nontransport rate of patients with fever who contacted the EMS system in Busan in South Korea from March 1, 2019 to February 28, 2022.
Busan, where we conducted this study, is a metropolitan city located on the southeastern coast of the Korean peninsula consisting of 15 major administrative districts and one county with a population of over 3.35 million and an area of 770.04 km.212 The EMS system of Busan is a government-based and single-tiered system, which is the same as that of South Korea as a whole and provides basic- to intermediate-level EMSs from fire agency headquarters. As of 2021, the Busan EMS system consists of one headquarters, one fire school, 11 fire stations with 59 safety centers, and 70 EMS teams. There is one EMS system control center where all emergency calls are processed and dispatched to the EMS teams. Most EMS teams have three EMS providers, including at least one emergency medical technician (EMT). Most EMS providers are registered nurses or have first/second-level EMT certification. Ambulances with physicians are not available except for interhospital transfers. There are three levels of EDs according to their capabilities and resources in South Korea. As of 2021, Busan had one regional emergency center, eight local emergency centers, and 19 local EDs.13
Study population and variables
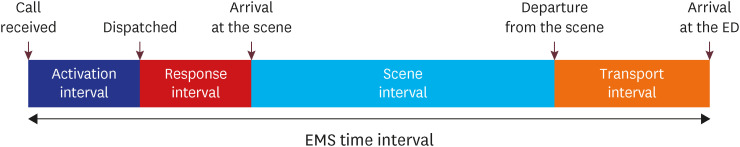
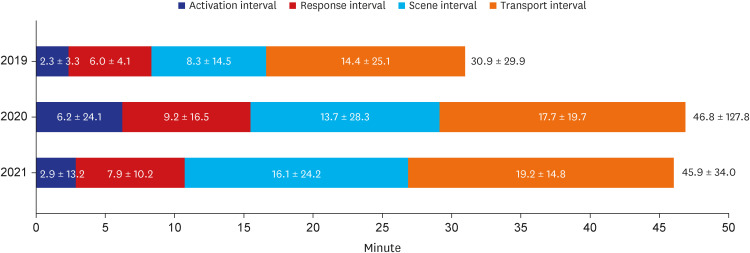
The inclusion criteria were all patients who contacted EMSs during this study. The exclusion criteria were patients without a body temperature (BT) record or with an error in their BT record, such as 99°C. The criterion for fever was 37.5°C or higher, measured by a tympanic thermometer. This was referenced as the standard BT for preemptive isolation in local emergency medical centers during the study period. Fire service dispatches do not have BT records; thus, they were excluded from this process. In addition, all cases without records of transport results were excluded; thus, multiple dispatches were excluded in this process. The EMS time interval was defined as the time between the patient’s EMS call and ED arrival time and consisted of the activation, response, scene, and transport interval.14 We defined activation interval as the time from the patient’s call to EMS dispatch. We defined EMS response interval, scene interval, and transport interval as the time elapsed from EMS dispatch to EMS arrival at the scene, from EMS arrival at the scene to EMS departure from the scene, and from EMS departure from the scene to EMS arrival at the ED, respectively (Fig. 1). Nontransport was defined as a case that was recorded as the individual not being transported in the emergency dispatch reports. In this study, the study population from March 1, 2019 to February 29, 2020, was defined as the control group, and the study population from March 1, 2020 to February 28, 2022, was defined as the study group. The study group was divided into two groups to track the trend: the 2020 group from March 1, 2020 to February 28, 2021, and the 2021 group from March 1, 2021 to February 28, 2022.
Data sources and collection
We analyzed the data from the emergency dispatch reports. Scene-dispatched EMS providers record all EMS dispatches, and these prehospital reports are electronically collected and managed by regional fire agencies. These reports contain the patient’s age and sex, time interval variables (EMS activation, response, scene, and transport interval), chief complaint, vital signs (blood pressure, pulse rate, respiration rate, BT), emergency medical procedures performed by EMS providers, etc. For this study, we collected anonymous prehospital emergency dispatch reports from the headquarters of the Busan National Fire Agency.
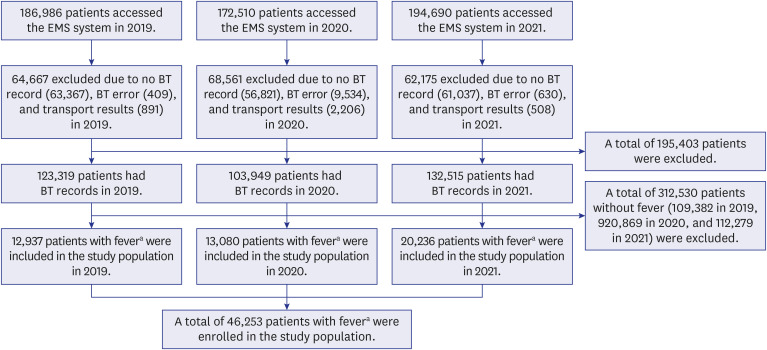
We extracted EMS call and ED arrival time data to calculate the EMS time interval. We also collected patient age, sex, and BT data. We excluded all cases with an error or no record of BT or transport results; the rest were included in the study population. Then, the study population was classified into two groups: those with fever and those without fever. Each group was again classified into two groups, an ED transport group and a nontransport group, to compare the nontransport rate before and after COVID-19. The flowchart of the study population inclusion process is presented in Fig. 2.
Main outcomes
The primary outcome was comparing the EMS time interval for patients with fever to the ED before and after COVID-19, and the secondary outcome was the nontransport rates of patients with fever before and after COVID-19. As a subgroup analysis, the EMS time interval and nontransport rates of infants with fever were analyzed.
Statistical analysis
We performed descriptive analysis mainly to examine the distribution of the variables. Continuous variables are presented as the means and standard deviations or categorical variables are presented as numbers and percentages. In comparing the two groups, we assessed differences in continuous variables using the independent t-test or the Mann-Whitney U test after verifying normality and in categorical variables using the χ2 test. We performed all statistical analyses using Microsoft Excel ver. 2018 (Microsoft Corp., Redmond, WA, USA). We considered a two-sided P value of < 0.05 to be statistically significant.
Ethics statement
The present study protocol was reviewed and approved by the Institutional Review Board of Dong-A University Hospital (approval No. DAUHIRB-EXP-22-161). Informed consent was waived because the data provided by the Busan National Fire Agency headquarters did not contain any personal information that could identify the patient.
RESULTS
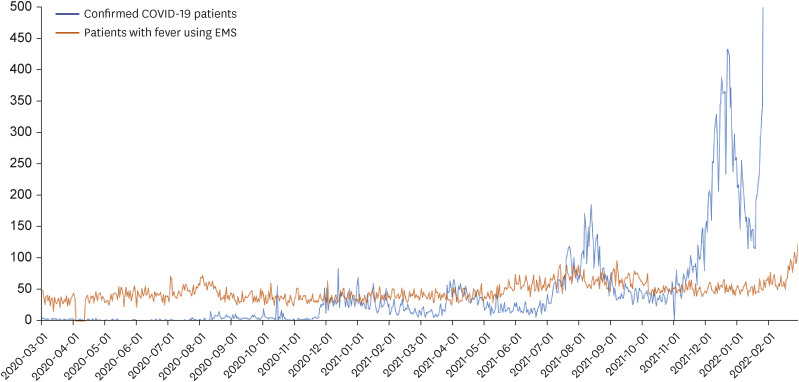
A total of 554,186 patients in Busan accessed the EMS system during the study period. Among them, 195,403 patients were excluded because there were errors or no information in the BT or transport result records. A total of 312,530 patients who did not meet the fever criterion were excluded. Finally, 46,253 patients were included in the study population (Fig. 2). Basic demographics (age and sex) are presented in Table 1. The daily numbers of confirmed COVID-19 patients and patients with fever using EMSs during the study period are shown in Fig. 3, and the Pearson correlation coefficient was 0.38 (P < 0.001).
Table 1
Basic demographics and EMS time interval for patients with fever using EMSs before and after coronavirus disease 2019
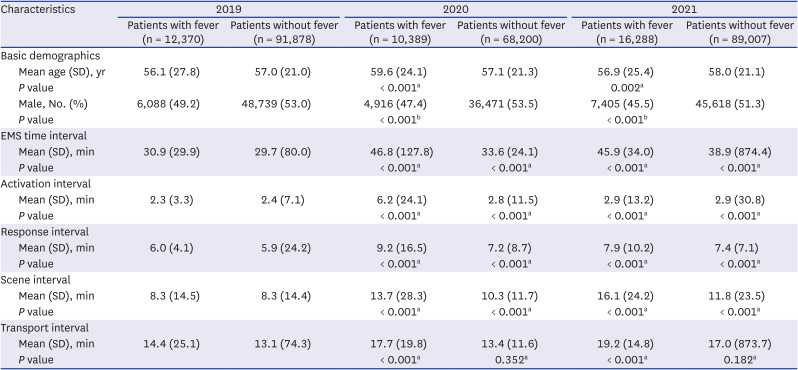
Fig. 3
The trends in the number of patients with fever using EMSs and confirmed COVID-19 patients.
EMS = emergency medical service, COVID-19 = coronavirus disease 2019.
The EMS time interval for patients with fever using EMSs before and after COVID-19
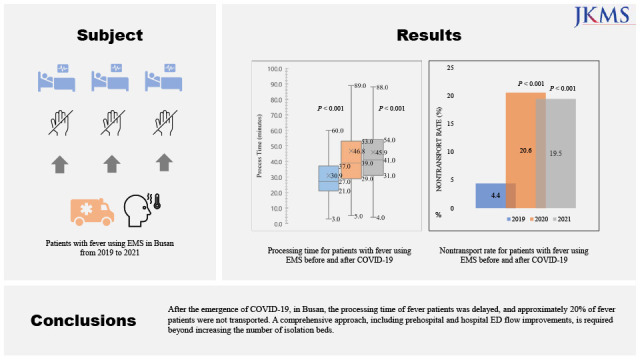
The mean EMS time interval of fever patients was 30.9 ± 29.9 minutes in 2019, 46.8 ± 127.8 minutes in 2020 (P < 0.001) and 45.9 ± 34.0 minutes in 2021 (P < 0.001) (Table 1, Fig. 4). During the COVID-19 period, all time intervals, including activation, response, scene, and transport, were significantly delayed compared to before COVID-19 (P < 0.001) (Fig. 5).
Fig. 4
Box plot of EMS time interval for patients with fever using EMSs before and after coronavirus disease 2019. Extremely delayed outliers were omitted.
EMS = emergency medical service.
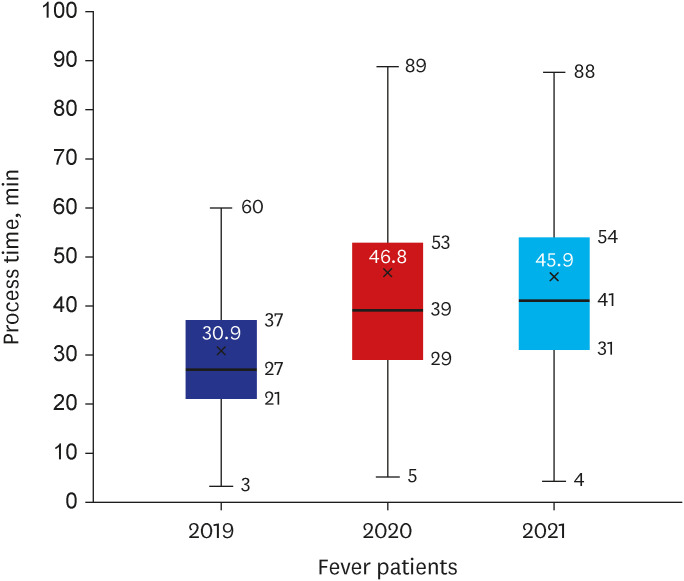
Fig. 5
EMS time interval intervals for patients with fever using EMSs before and after coronavirus disease 2019. The values (minutes) in the bar and outside the bar represent the mean time, and standard deviation spent for each time interval and the EMS time interval.
EMS = emergency medical service.
The nontransport rate of patients with fever using EMSs before and after COVID-19
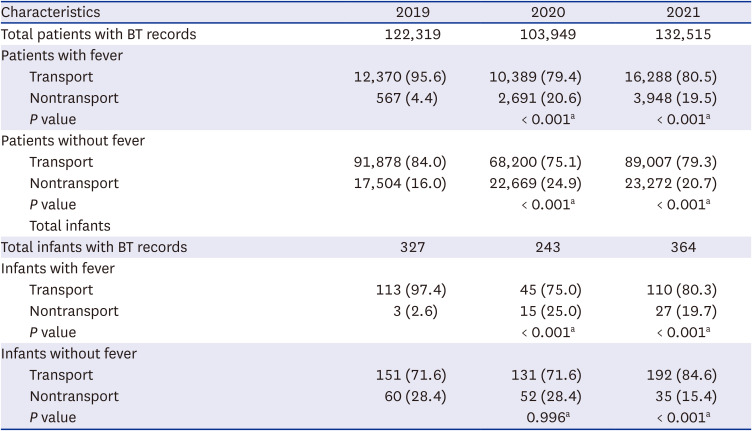
The nontransport rate of fever patients to the ED is presented in Table 2. The nontransport rate of patients with fever was 4.4% in 2019, 20.6% in 2020 (P < 0.001), and 19.5% in 2021 (P < 0.001) and increased by 4.5 times after COVID-19.
Table 2
Nontransport rate for patients and infants with fever using emergency medical services before and after coronavirus disease 2019
The EMS time interval and nontransport rate of infants with fever using EMSs before and after COVID-19
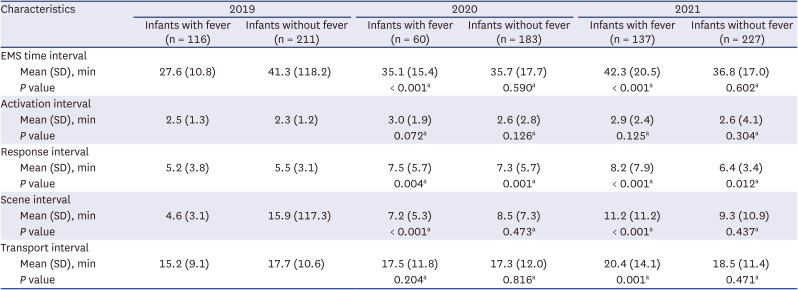
After COVID-19, the EMS time interval of infants with fever showed an upward trend from a mean of 27.6 ± 10.8 minutes in 2019 to 35.1 ± 15.4 minutes in 2020 (P < 0.001) and 42.3 ± 20.5 minutes in 2021 (P < 0.001) (Table 3). The nontransport rate was 2.6% in 2019, and it increased significantly to 25.0% in 2020 (P < 0.001) but decreased slightly to 19.7% in 2021 (P < 0.001) (Table 2).
Table 3
EMS time interval for infants with fever using EMSs before and after coronavirus disease 2019
DISCUSSION
This study aimed to examine and compare the prehospital EMS time interval and nontransport rate of fever patients in the region before and after COVID-19. After COVID-19, the EMS time interval was delayed by 16 minutes, and the nontransport rate increased by 4.5 times compared with before COVID-19. For infants with fever, during COVID-19, the EMS time interval was shorter than that of the overall study population; however, there was an upward trend. The nontransport rate was higher than that of the overall study population; however, there was a downward trend.
After the COVID-19 pandemic declaration, a delay in the EMS time interval of fever patients in the prehospital stage was expected. The difference in the number of fever patients in 2019 and 2020 was approximately 500 patients in Busan. However, there was a significant difference between the EMS time interval and the nontransport rate between 2019 and 2020. Two factors can explain these findings: ED capacity and flow.1516
The first factor was a reduction in ED capacity. The number of ED beds in the region that can accommodate fever patients has decreased. Before COVID-19, fever patients could be assigned to any bed in the ED according to the initial triage level. However, after COVID-19, only isolation beds were allowed for them. In 2019, there were 12,937 fever patients in Busan, and they could use 479 beds in the ED. However, in 2020, there were 13,080 fever patients in Busan, and they could use only 68 isolation beds in the ED.17 The number of patients with fever using EMSs was steady and was not substantially affected by the number of confirmed COVID-19 patients (Fig. 3). However, there was a sharp decline in the capacity of the ED. Moreover, these isolation beds had to be shared with fever patients who were transferred from nursing homes or ambulatory patients who presented with fever. The EMS time interval and nontransport rate of nonfever patients also increased, which was estimated to be due to a reduction in ED capacity. After COVID-19, extra beds in the ED were not allowed in corridors, between beds, etc.
The second factor was the delay in ED flow. Fever patients in isolation beds are tested for COVID-19 infection if they do not have information on COVID-19 infection. In 2020, the ED took a minimum of 1 hour to a maximum of 6 hours for test results. If the patient is COVID-19 negative, the patient can move from an isolation to a nonisolation bed. However, if the patient is COVID-19 positive, the patient occupies the bed until their disposition (admission, transfer, or discharge) is determined. The occupied isolation bed is not available for other fever patients. As the positivity rate of the COVID-19 test increases, the number of occupied beds increases. At the same time, the number of isolation beds available to fever patients outside the ED decreases. The delay in ED flow was aggravated if the patients were not admitted or transferred during the nighttime.18 The congestion of the ED flow and consequent increase in the length of ED stay during COVID-19 have also been reported in other studies.1920
In 2021, the number of patients with fever increased from 2020 due to the omicron variant, but the EMS time interval and nontransport rate did not change much. The number of isolation beds in the region did not change between 2020 and 2021. The number of fever patients who contacted EMS increased, the flow of the ED stagnated, and as a result, the nontransport rate increased.21 However, our findings were different from those of a previous study. We estimate that this is because the ED flow has improved due to rapid COVID-19 testing and the disposition of confirmed COVID-19 patients to residential treatment centers.
Not all fever patients will need emergency care. The acuity and severity of fever patients show a broad spectrum, from stable patients with only fever to patients with impending septic shock. EMS providers in Korea have not yet implemented a prehospital triage system in the field that prioritizes patient care requirements and classifies treatment urgency.22 While a stable fever patient who arrived first occupies an isolation bed while waiting for their COVID-19 test result, a sepsis patient who came later must stay in the ambulance on the road until an isolation bed is found. Medical resources cannot be expanded indefinitely. A prehospital strategy such as a nontransport protocol conducted in the United States can be an alternative to reduce the burden on health systems.23
Notably, the EMS time interval of infants with fever was shorter than that of the entire study population, but the nontransport rate was higher than that of the entire study population in 2020. This is not fully explained by the reduction in ED capacity. Since the isolation beds for infants with fever are not managed separately, the ED capacity is the same as that of the study population. However, ED flow may be different. There should be further investigation or research on the cause, which may include a shortage of pediatric emergency staff.
The findings of this study confirm that the delay in the EMS time interval of fever patients occurs not only during the transport interval but also during other EMS time intervals, such as the activation, response, and scene interval. The delay in the transport of fever patients in the prehospital stage deteriorates the flow of the EMS system. The ambulance offload delay eventually obstructs EMS providers from responding to other emergency dispatches.24 Waiting for an ED to have an isolation bed at the entrance of the ED is the same situation in which a fever patient occupies the isolation bed to wait for a test result or disposition. The number of ambulances available for emergency dispatch in the jurisdiction has been reduced. In the future, infectious diseases such as COVID-19 will likely reemerge.2526 Several isolation beds in the ED cannot be a solution because we are already experiencing a barrier when all the isolation beds are occupied. It may be necessary to convert all ED beds into isolation beds to increase ED capacity. In addition, strategies to improve the ED flow at both the prehospital and hospital stages should be discussed.
This study has several limitations. First, the data are all from Busan and therefore difficult to generalize to the rest of Korea. However, it is estimated that there will be no significant difference because all of the EMS systems in Korea are the same. Second, we could not track whether the clinical outcomes of fever patients worsened due to the delayed EMS time interval or nontransport. Follow-up research is needed. Third, it may not be reasonable to interpret all nontransport occurrences as a lack of isolation beds in the ED. There were three types of nontransport in the emergency dispatch reports: patient refusal to transport, EMS provider refusal to transport, and on-site treatment. Since not all fever patients need to be transported to the ED, EMS providers refused to transfer some patients or treated them on site.
In conclusion, after COVID-19, in Busan, the EMS time interval of fever patients was delayed, and approximately 20% of fever patients were not transported. In particular, the nontransport rate of infants with fever was higher than that of the overall study population, which is not fully explained by the impact of COVID-19. Infectious diseases will be repeated. A comprehensive approach, including prehospital and hospital ED flow improvements, is required beyond increasing the number of isolation beds.
 XML Download