

 PDF
PDF Citation
 Print
Print


INTRODUCTION
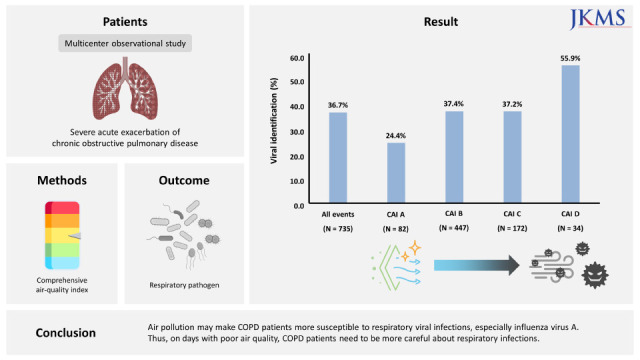
Chronic obstructive pulmonary disease (COPD) is a representative chronic respiratory disease.1 Treatment of COPD consists of maintenance treatment to preserve lung function and quality of life and acute treatment for acute exacerbation of COPD (AECOPD).2 In the case of AECOPD treatment, appropriate antibiotic selection and systemic steroid treatment are important. If possible, prevention is the most important. The main causes of AECOPD are respiratory pathogen infections and air pollution.3 AECOPD might be caused by a combination of several factors. However, studies on the mutual influence between causes of AECOPD are lacking.
Recently, as the environment has gradually deteriorated, air pollution has been suggested as an important acute exacerbation factor of COPD.4 Particulate matter (PM), ozone (O3), nitrogen dioxide (NO2), sulfur dioxide (SO2), and carbon monoxide (CO) are major factors in air pollution. Specially, PM with a diameter of less than 10 µm (PM10) and PM with a diameter of less than 2.5 µm (PM2.5) are considered as major air pollutants in Korea.56 They are known to increase severe AECOPD requiring hospitalization.7 PM has a direct effect on the immune system and the mucosal barrier, which can have an influence on respiratory infection.89 The objective of this study was to investigate the correlation between air pollution and bacterial or viral infection in severe AECOPD through a multicenter observational study.
METHODS
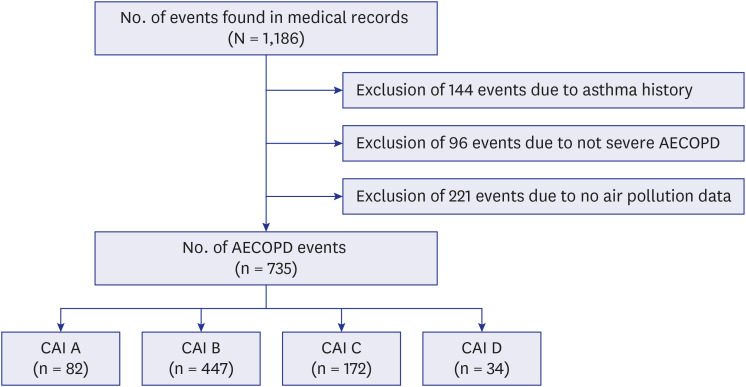
This multicenter observational study was conducted by reviewing electronic medical records of AECOPD patients at 28 hospitals in South Korea between January 2015 and December 2018.10 Patients were divided into four groups according to the comprehensive air-quality index (CAI) used in Korea. Identification rates of bacteria and viruses of each group were analyzed (Fig. 1).
Fig. 1
Study design.
AECOPD = acute exacerbation of chronic obstructive pulmonary disease, CAI = comprehensive air-quality index.
Eligibility criteria
Inclusion criteria were as follows: (a) age > 40 years; (b) patients diagnosed with COPD based on the global initiative for chronic obstructive lung disease (GOLD) report (a ratio of post-bronchodilator forced expiratory volume in one second (FEV1) to forced vital capacity (FVC) of < 70%); (c) patients diagnosed with AECOPD based on the GOLD report (an acute event characterized by a worsening of the patient’s respiratory symptoms beyond normal day-to-day variation, leading to a change in medication); (d) patients hospitalized for AECOPD; (e) patients tested for bacterial sputum culture and respiratory viral polymerase chain reaction (PCR) assays to analyze the cause of AECOPD.
Data collection
Bacterial culture (sputum samples using standard techniques within 2 days of admission time) and respiratory viral PCR assays (throat or nasopharyngeal swabs within 2 days of admission time; multiplex reverse transcriptase-PCR test [Real-Q RV Detection kit, BioSewoom, Seoul, Korea; Anyplex II RV16, Seegene, Seoul, Korea; AdvanSure RV, LG Life Sciences, Seoul, Korea]) were performed for all patients. Respiratory viral PCR assays confirmed the following viruses: influenza virus, rhinovirus, parainfluenza virus, coronavirus, respiratory syncytial virus, metapneumovirus, adenovirus, enterovirus, and bocavirus. Additionally, rapid antigen testing to detect influenza virus (throat or nasopharyngeal swabs within 2 days of admission time; SD BIOLINE Influenza Antigen test, Standard Diagnostics, Yongin, Korea; BD Veritor System for Rapid Detection of FluA+B, BD Diagnostics, Sparks, MD, USA) was performed for 260 (35.4%) patients. Baseline characteristics included age, gender, smoking history, inhaler use before admission, comorbidities, and pulmonary function test within 6 months before acute exacerbation.
Air pollution data officially shared on the internet by Korea environment corporation (www.airkorea.or.kr) were used. In a previous study, our research team confirmed that it was related to the acute exacerbation of COPD even by analyzing PM monitoring stations around hospitals.11 So, the air pollution monitoring station was based on the nearest station from each of the 28 hospitals. The distance from the hospital to the measuring station was 0.5 km to 4.1 km. We used the CAI in Korea calculated through six representative air pollutants (PM10, PM2.5, O3, NO2, SO2, and CO) as air pollution standard for this study (Supplementary Table 1). The CAI is a way of describing ambient air quality based on the level of health risks associated with the level of air pollution. The CAI is calculated by synthesizing the air pollution index after converting each air pollution factor into 0~500 points. And air pollution is divided into four categories according to CAI value. CAI ‘A’ category had the lowest air pollution degree and CAI ‘D’ category had the highest air pollution degree. Patients were divided into four groups based on CAI. They were also divided into four groups based on PM10 and PM2.5 for further analysis. In the case of air pollutant exposure period, a meta-analysis revealed that 2–3 days prior had the most effect. Thus, we used air pollution information 2 days prior to AECOPD events.12
Statistical analysis
Data were analyzed using SPSS 20 software (SPSS Inc., Chicago, IL, USA). Data are presented as mean ± standard deviation or number and percentage of each group. When subjects were divided into four groups by CAI, no value followed a normal distribution. Therefore, viral and bacterial pathogen identification were analyzed using the Kruskal-Wallis H test among one-way analysis of variance. In Fig. 2, Mann-Whitney U test, one of the nonparametric tests, was used. P < 0.05 was considered statistically significant.
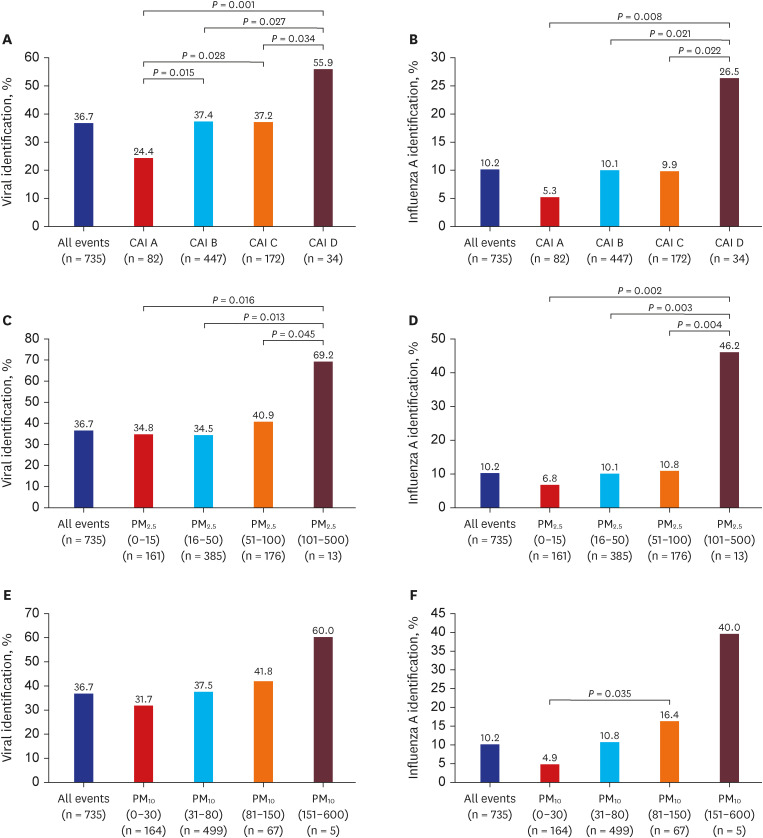
Fig. 2
Viral identification rate according to air pollution. (A) Viral identification rate analysis according to CAI, (B) Influenza A identification rate analysis according to CAI, (C) Viral identification rate analysis according to PM2.5, (D) Influenza A identification rate analysis according to PM2.5, (E) Viral identification rate analysis according to PM10, (F) Influenza A identification rate analysis according to PM10.
CAI = comprehensive air-quality index, PM2.5 = particulate matter with a diameter of less than 2.5 µm, PM10 = PM with a diameter of less than 10 µm.
RESULTS
Baseline characteristics
A total of 735 patients with severe AECOPD were analyzed. The mean age was 74.2 years. Most (82.6%) patients were males. Current or ex-smokers accounted for 74.1%. Those who were using an inhaler accounted for 74.7%. The majority (n = 464, 63.1%) of patients had one or more comorbidities. There were 100 (13.6%) patients with bronchiectasis and 14 (1.9%) patients with interstitial lung disease (Table 1). The average length of hospital stay was 12.75 ± 14.63 days, and 10.5% of patients required intensive care unit (ICU) treatment. There was no difference in the prognosis (duration of hospital stay and need of ICU treatment) of acute exacerbation according to CAI. And, there was no difference in lung function according to CAI category (Supplementary Table 2).
Table 1
Baseline characteristics of patients with severe AECOPD events
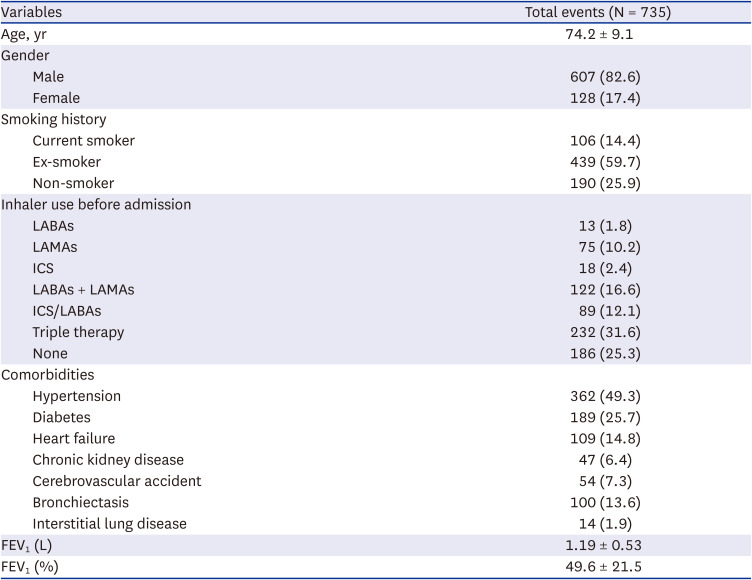
Values are presented as mean ± standard deviation or number (%).
AECOPD = acute exacerbations of chronic obstructive pulmonary disease, LABA = long-acting B agonist bronchodilator, LAMA = long acting antimuscarinic agent bronchodilator, ICS = inhaled corticosteroid, FEV1 = forced expiratory volume in one second.
Viral pathogen identification
Viral pathogens were identified in 270 (36.7%) of 735 patients. Two or more viruses were simultaneously identified in 24 (3.3%) patients. Influenza virus and rhinovirus were the most common viruses, whereas enterovirus and bocavirus were the least common viruses. When subjects were divided into four groups according to CAI and analyzed, the viral identification rate was different according to air pollution (P = 0.012). Specially, the viral identification rate was 55.9% in the group of CAI ‘D’ and 24.4% in the group with CAI ‘A’. This pattern was clearly seen for influenza virus A (P = 0.042) (Table 2).
Table 2
Viral pathogen identification according to CAI category
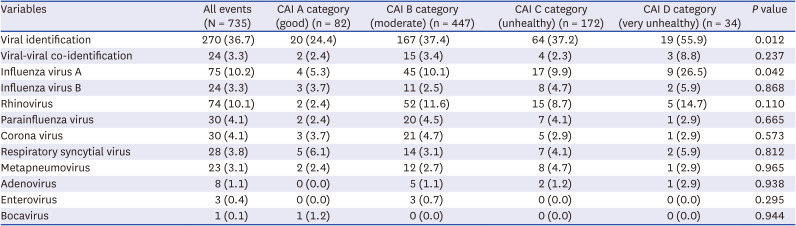
The CAI ‘D’ group with the highest air pollution had a significantly higher viral identification rate than the other three groups. The CAI ‘A’ group with the lowest air pollution level also had a significantly lower viral identification rate than the other three groups (Fig. 2A). Similarly, influenza A was confirmed to be higher in the CAI ‘D’ group than in the other three groups (Fig. 2B).
Patients were further divided into four groups based on PM10 and PM2.5 and analyzed. When they were analyzed based on PM2.5, the viral identification rate was higher in the group with the highest PM2.5 than in the other three groups (Fig. 2C). Similarly, influenza A was detected at a higher rate in the group with the highest PM2.5 than in the other three groups (Fig. 2D). When subjects were analyzed based on PM10, no statistically significant difference was found (Fig. 2E). This might be because the number of patients in the group with the highest PM10 was too small. However, it was found that influenza A had the lowest detection rate in the group with the lowest PM10 (Fig. 2F).
Bacterial pathogen identification
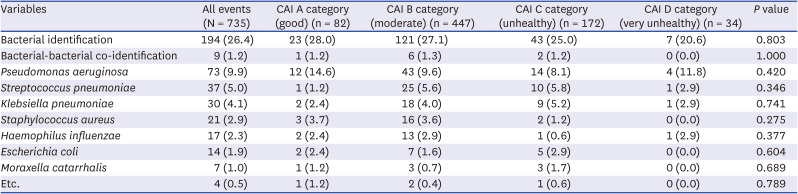
Bacterial pathogens were identified in 194 (26.4%) of 735 patients. Two or more bacteria were simultaneously identified in 9 (1.2%) patients. Pseudomonas aeruginosa was the most commonly identified bacterial species. When subjects were divided into four groups according to CAI and analyzed, there was no statistically significant difference in the detection of bacterial pathogen. Even when each bacterium was analyzed, no statistically significant difference was found (Table 3).
Table 3
Bacteria pathogen identification according to CAI category
DISCUSSION
This multicenter observational study analyzed causes of AECOPD. Our findings suggest that air pollution has the potential to affect severe AECOPD by increasing viral infections. Furthermore, air pollution has the potential to increase influenza A infection in COPD patients. A previous study in Kore Guro Hospital has reported that air pollution can increase severe AECOPD.7 Air pollution itself may aggravate COPD. It may exacerbate COPD by making patients vulnerable to viral infections.
It is well-known that air pollution can increase AECOPD. Acute exacerbation occurs within 2–3 days after exposure to air pollution.712 Each 10 μg/m3 increase in PM2.5 can lead to about 5% increase in the risk of AECOPD.13 The higher the exposure to PM at higher concentrations, the higher the likelihood of using steroids and antibiotics.14 Air pollution is so important that it affects AECOPD even in a low-air pollution state based on standards presented by the government.15 As an additional related factor, the lower the temperature and humidity, the greater the adverse effect of PM2.5 on AECOPD.13
The main adverse effect of air pollution is airway epithelial barrier dysfunction.16 Presumed mechanisms for adverse effects of air pollution on airways have been studied using diesel exhaust particles (DEP) (in vitro studies). In an in vitro study using human bronchial epithelial cells, the ciliary beat frequency is altered when exposed to DEP.17 Furthermore, DEP can increase IL-8, which can activate the NF-κB pathway and increase airway inflammation.18 Chronic PM2.5 exposure can reduce key ciliating cell transcription factors (e.g., FOXJ1 and MCIDAS) and induce mucus metaplasia-like remodeling.19 It has been also suggested that PM2.5 may induce mitochondrial dysfunction by reducing cellular ATP and mitochondrial membrane potential in human nasal epithelial cells.20 Air pollution may induce airway epithelial barrier dysfunction through ciliary dysfunction, mucus metaplasia, and mitochondrial dysfunction, making patients susceptible to respiratory infection. Moreover, air pollution not only increases acute exacerbation, but also advances COPD itself.
Although most studies have been done on the mouse model or normal subjects, air pollution may affect the lung microbiome. PM2.5 causes lung injury, which can lead to changes in multiple metabolites in the lung and result in changes of lung microbiome composition.21 PM-induced changes in the lung microbiome can alter alveolar macrophages and immunoglobulin levels, eventually disrupting pulmonary immunologic homeostasis.22 These changes have been confirmed in normal subjects and children.2324 Further studies are needed in COPD patients. Air pollution might affect the lung microbiome and immune system, making COPD patients susceptible to respiratory infections.
The strength of this study was that it was a multicenter study that identified various bacteria and viruses. However, it has some limitations. First, the biggest limitation of this study is that air pollution measurement standard was centered on hospitals in which patients were admitted. Likewise, 13 out of 28 hospitals are based in Seoul, so the standard for that air pollution data is biased toward Seoul. This might be different from the actual living environment, or the patient might have lived mainly indoors. However, a supplementary point was that the distance from the hospital to the measurement center was short (0.5–4.1 km). In addition, most patients visit regional hospitals in Korea. Moreover, the level of air pollution does not differ significantly across the country (Because the total area of Korea is rather smaller than other country). Second, colonization or contamination could not be distinguished. Although this study was conducted in a university level hospital with well-trained doctors performing the test with a high reliability, it was difficult to compensate for colonization and limitations of PCR test. Third, as retrospective multi-center data were used, some important data were omitted. For example, pulmonary function test results within 6 months were collected for only 74.3% of all patients. Thus, they could not be considered as full data. The mean FEV1 (L) was 1.19 L and the FEV1 (%) was 49.55 (%) for investigated patients. And we cannot analyze the factors such as pneumococcal vaccine and influenza vaccine. In addition, the panel used for respiratory viral PCR assay in each participating hospital is different, and it is expected that the difference in the detection rate of the panel may have affected the results. Although this limitation was discussed early in this study, this was inevitable in this multicenter retrospective data collection study. Fourth, although the correlation with virus was proved, the correlation with bacteria was not proved. This might be due to the aforementioned colonization or contamination. Fifth, in this epidemiological study, it was expected that population density (sex, age, occupation, etc.) influenced air pollution and viral infection, respectively. However, in-depth analysis was not conducted because data on the patient's precise regional characteristics could not be collected. Sixth, the point is that our study result is not a dose-dependent result of an increase in viral infection in proportion to the degree of air pollution. When classified as CAI, CAI A–C showed generally similar tendencies, there were many cases of high tendency only in CAI D. Rather than having a dose-dependent adverse effect on the level of air pollution, it is better to interpret that the problem increases when it exceeds a certain standard point.
This study analyzed the effect of air pollution on the infection cause, the most important factor in severe AECOPD. Air pollution can cause airway epithelial barrier dysfunction and changes in the immune system, making COPD patients more susceptible to respiratory infections. This is conspicuous for viral infection, especially influenza A infection. Thus, during the period of high air pollution and influenza season, COPD patients should be more careful.
 XML Download